. 2022 Jan;601(7893):446-451.
doi: 10.1038/s41586-021-04234-3. Epub 2021 Dec 22.

MicroRNA sequence codes for small extracellular vesicle release and cellular retention

Affiliations

MicroRNA sequence codes for small extracellular vesicle release and cellular retention

Ruben Garcia-Martin et al. Nature. 2022 Jan.

Abstract

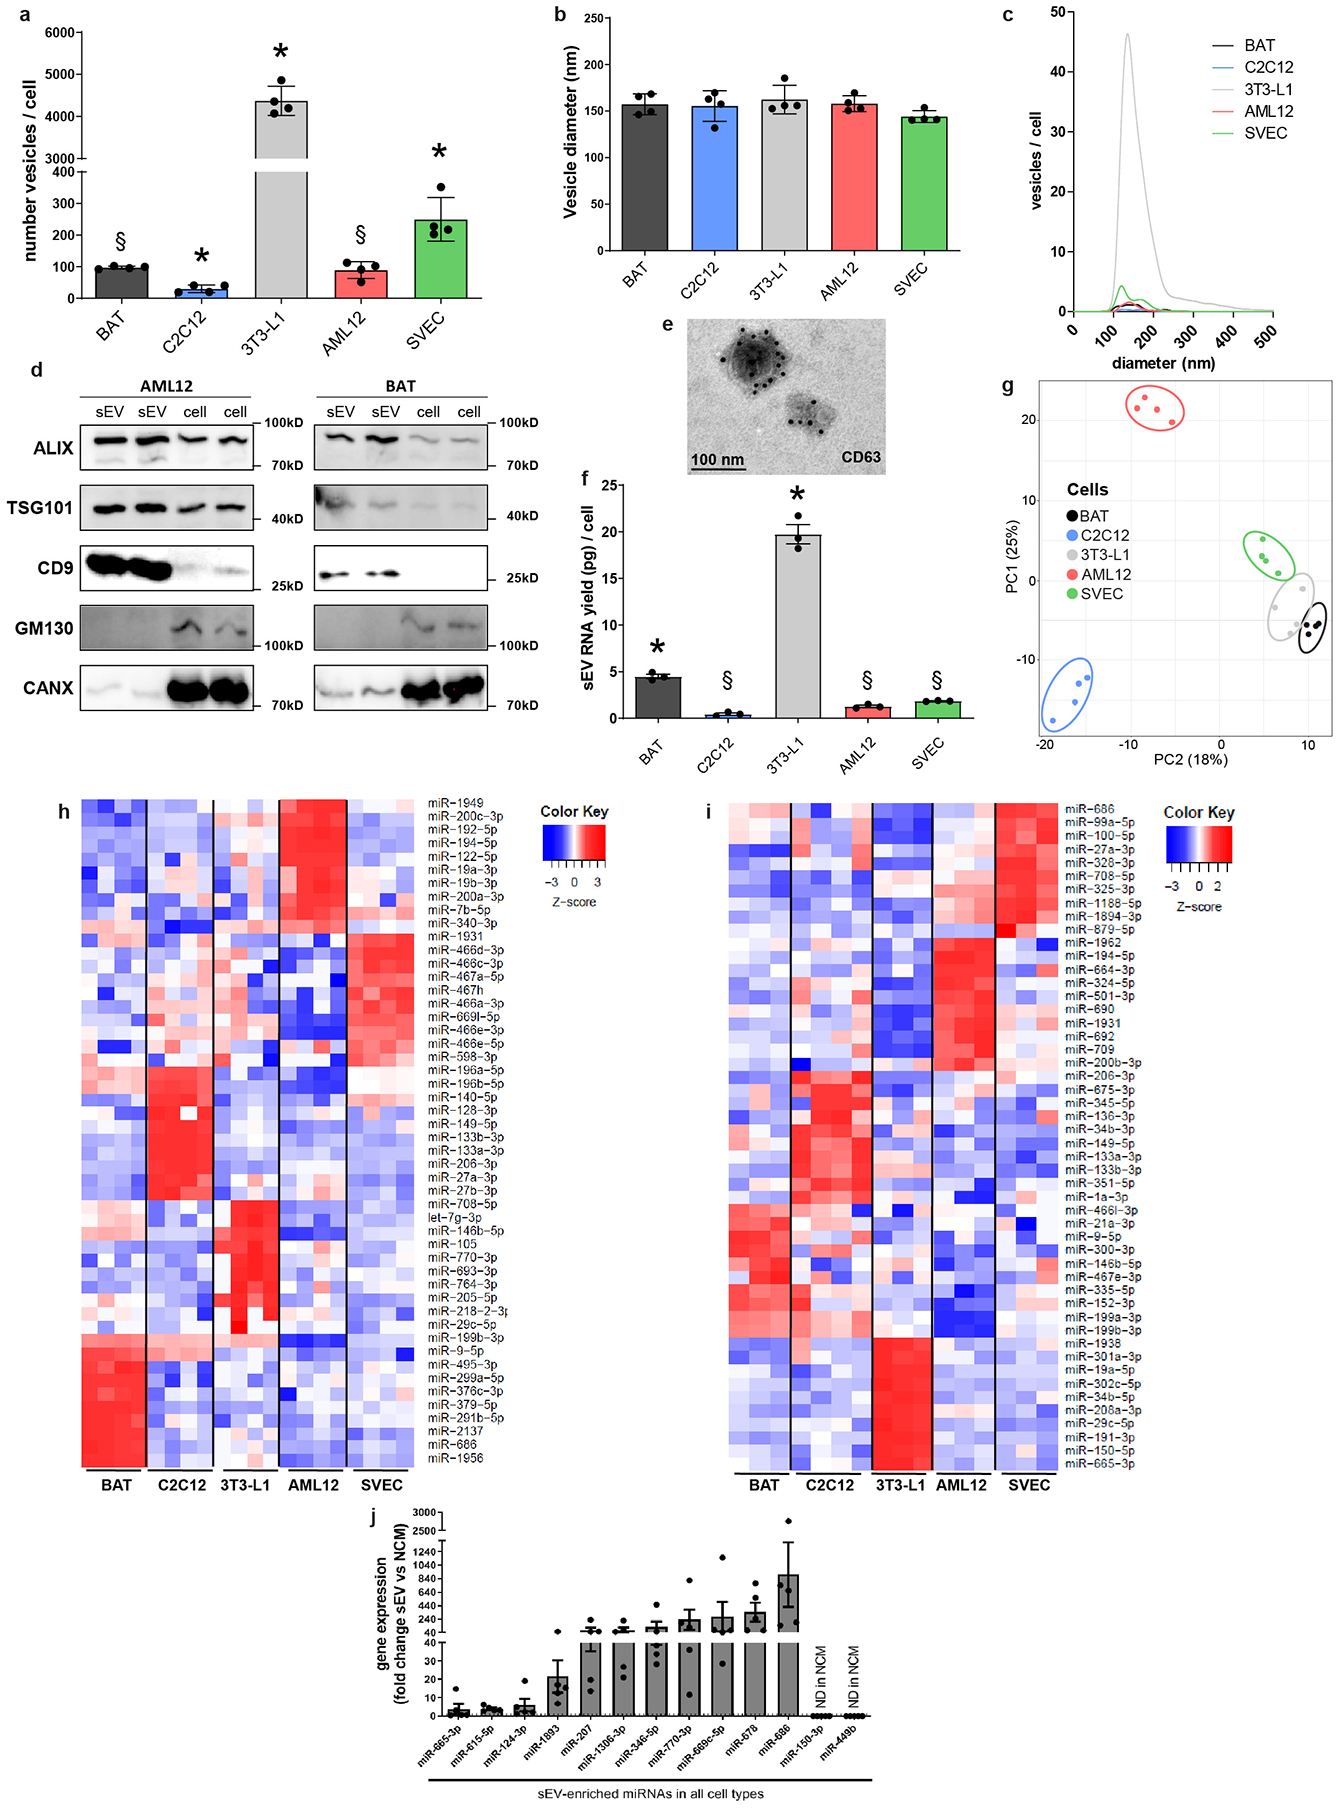
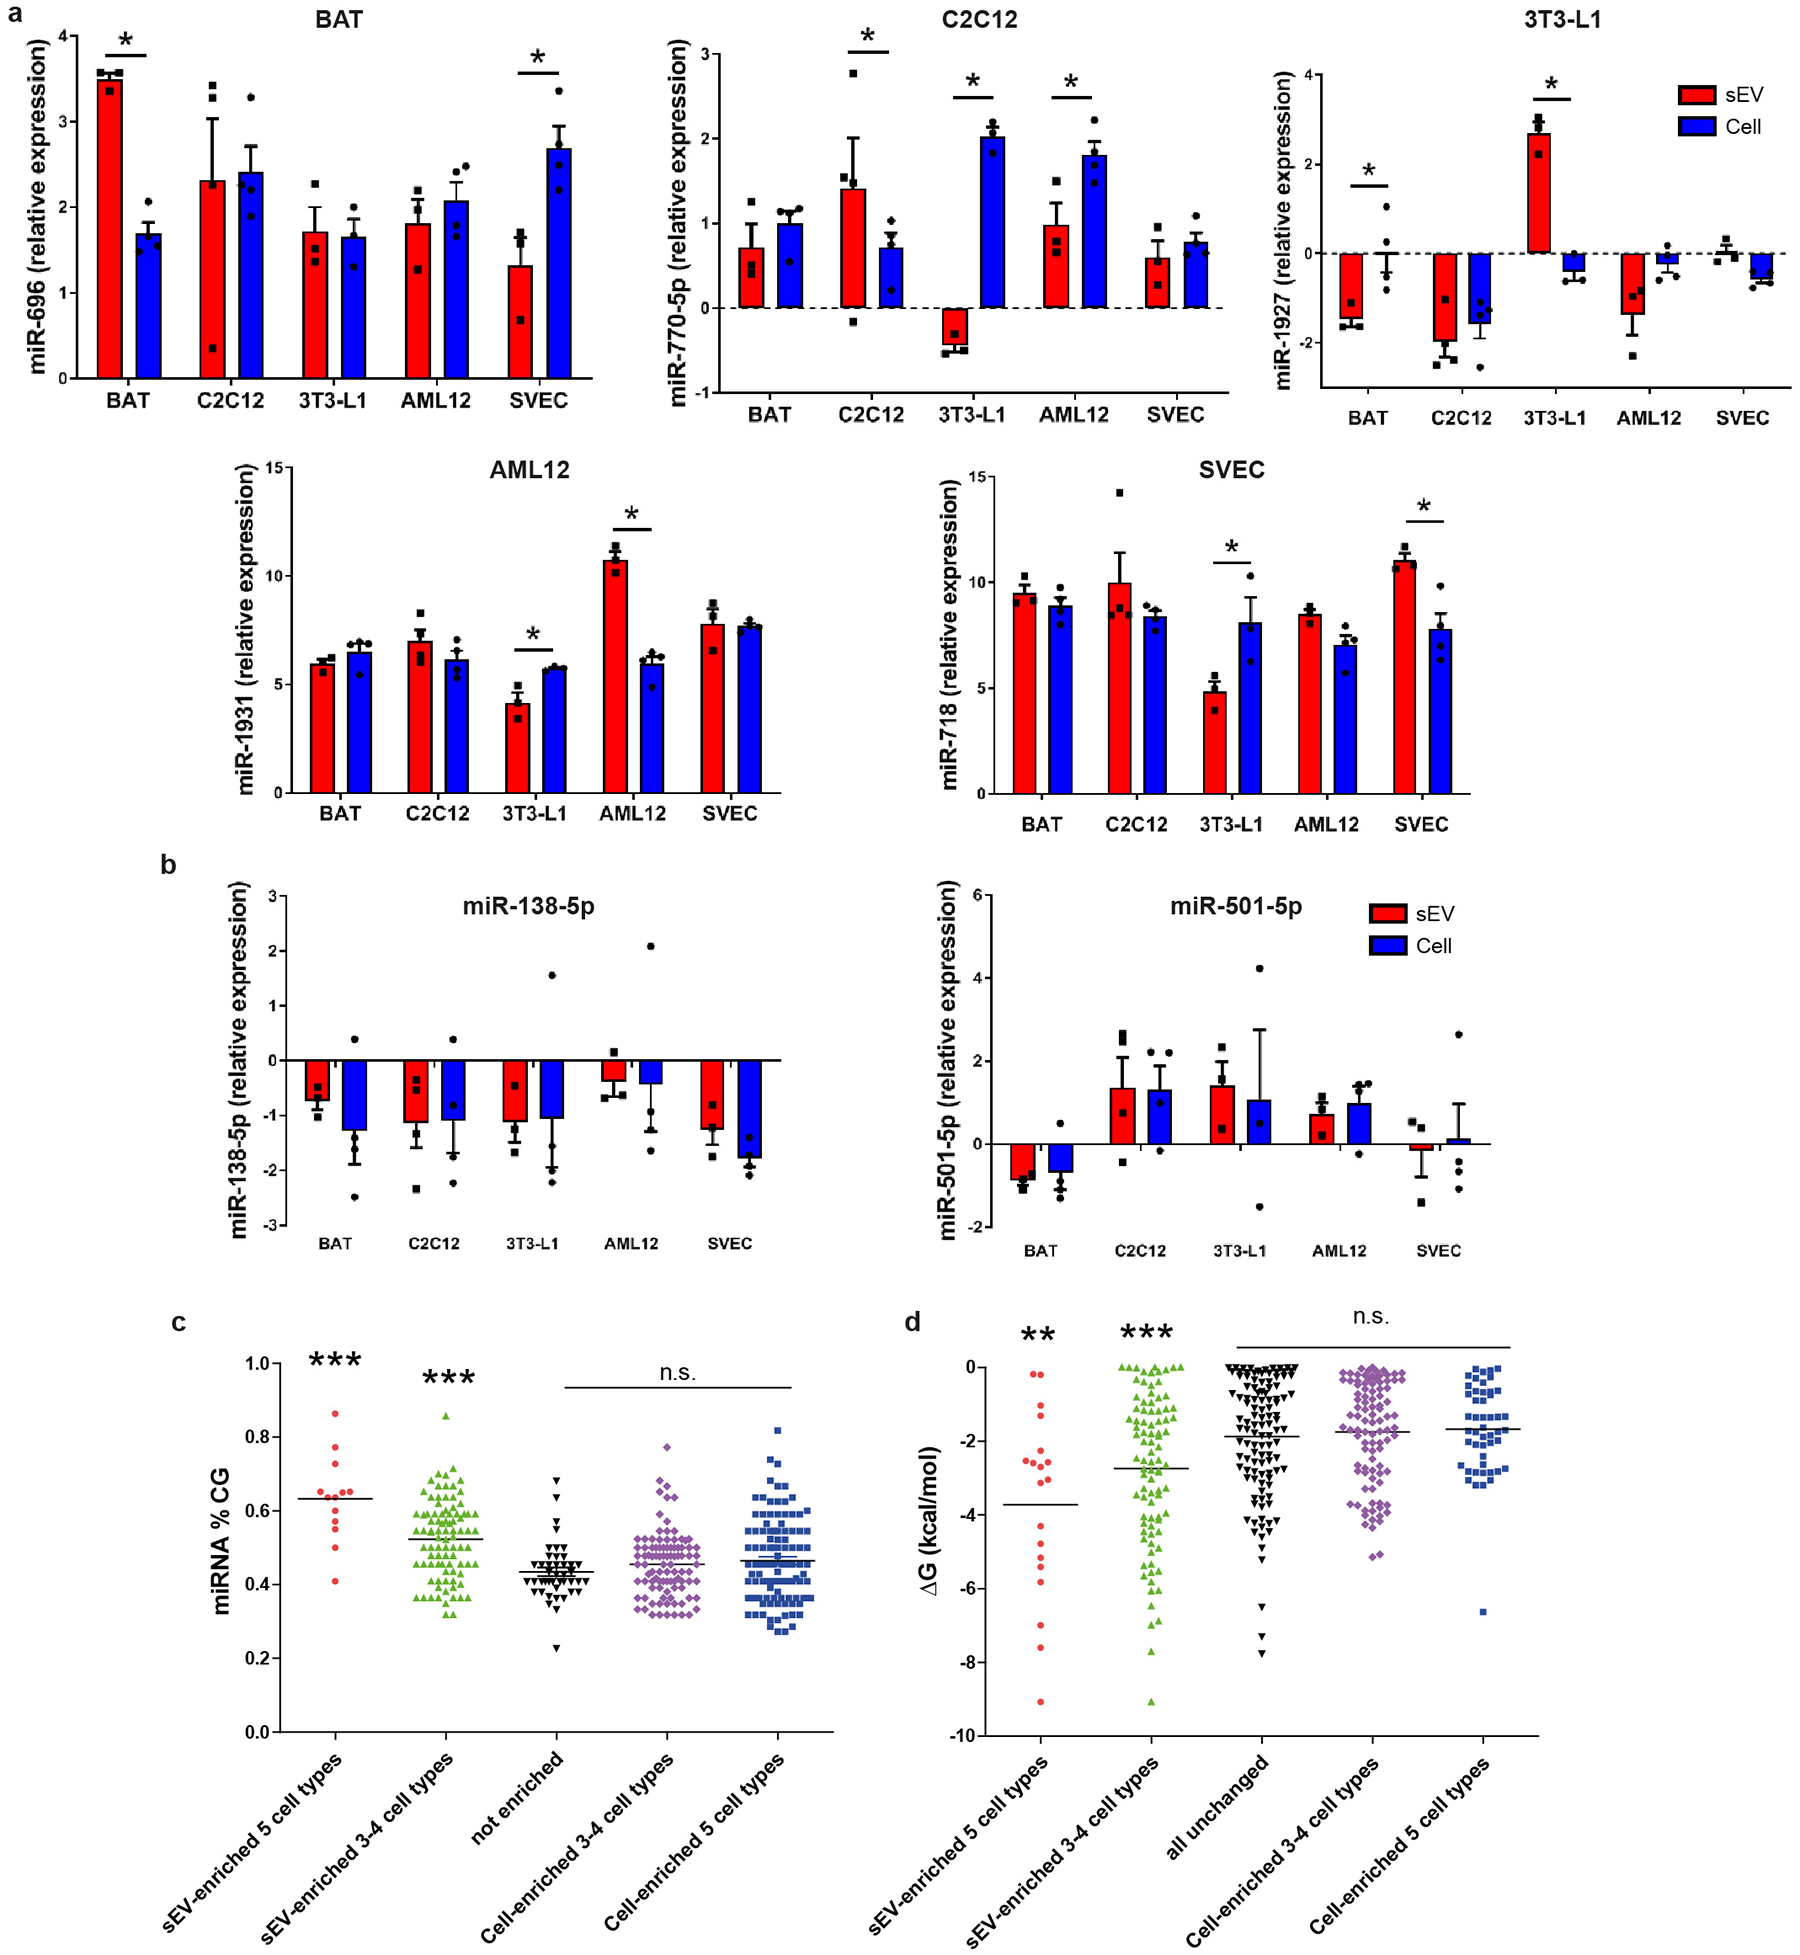
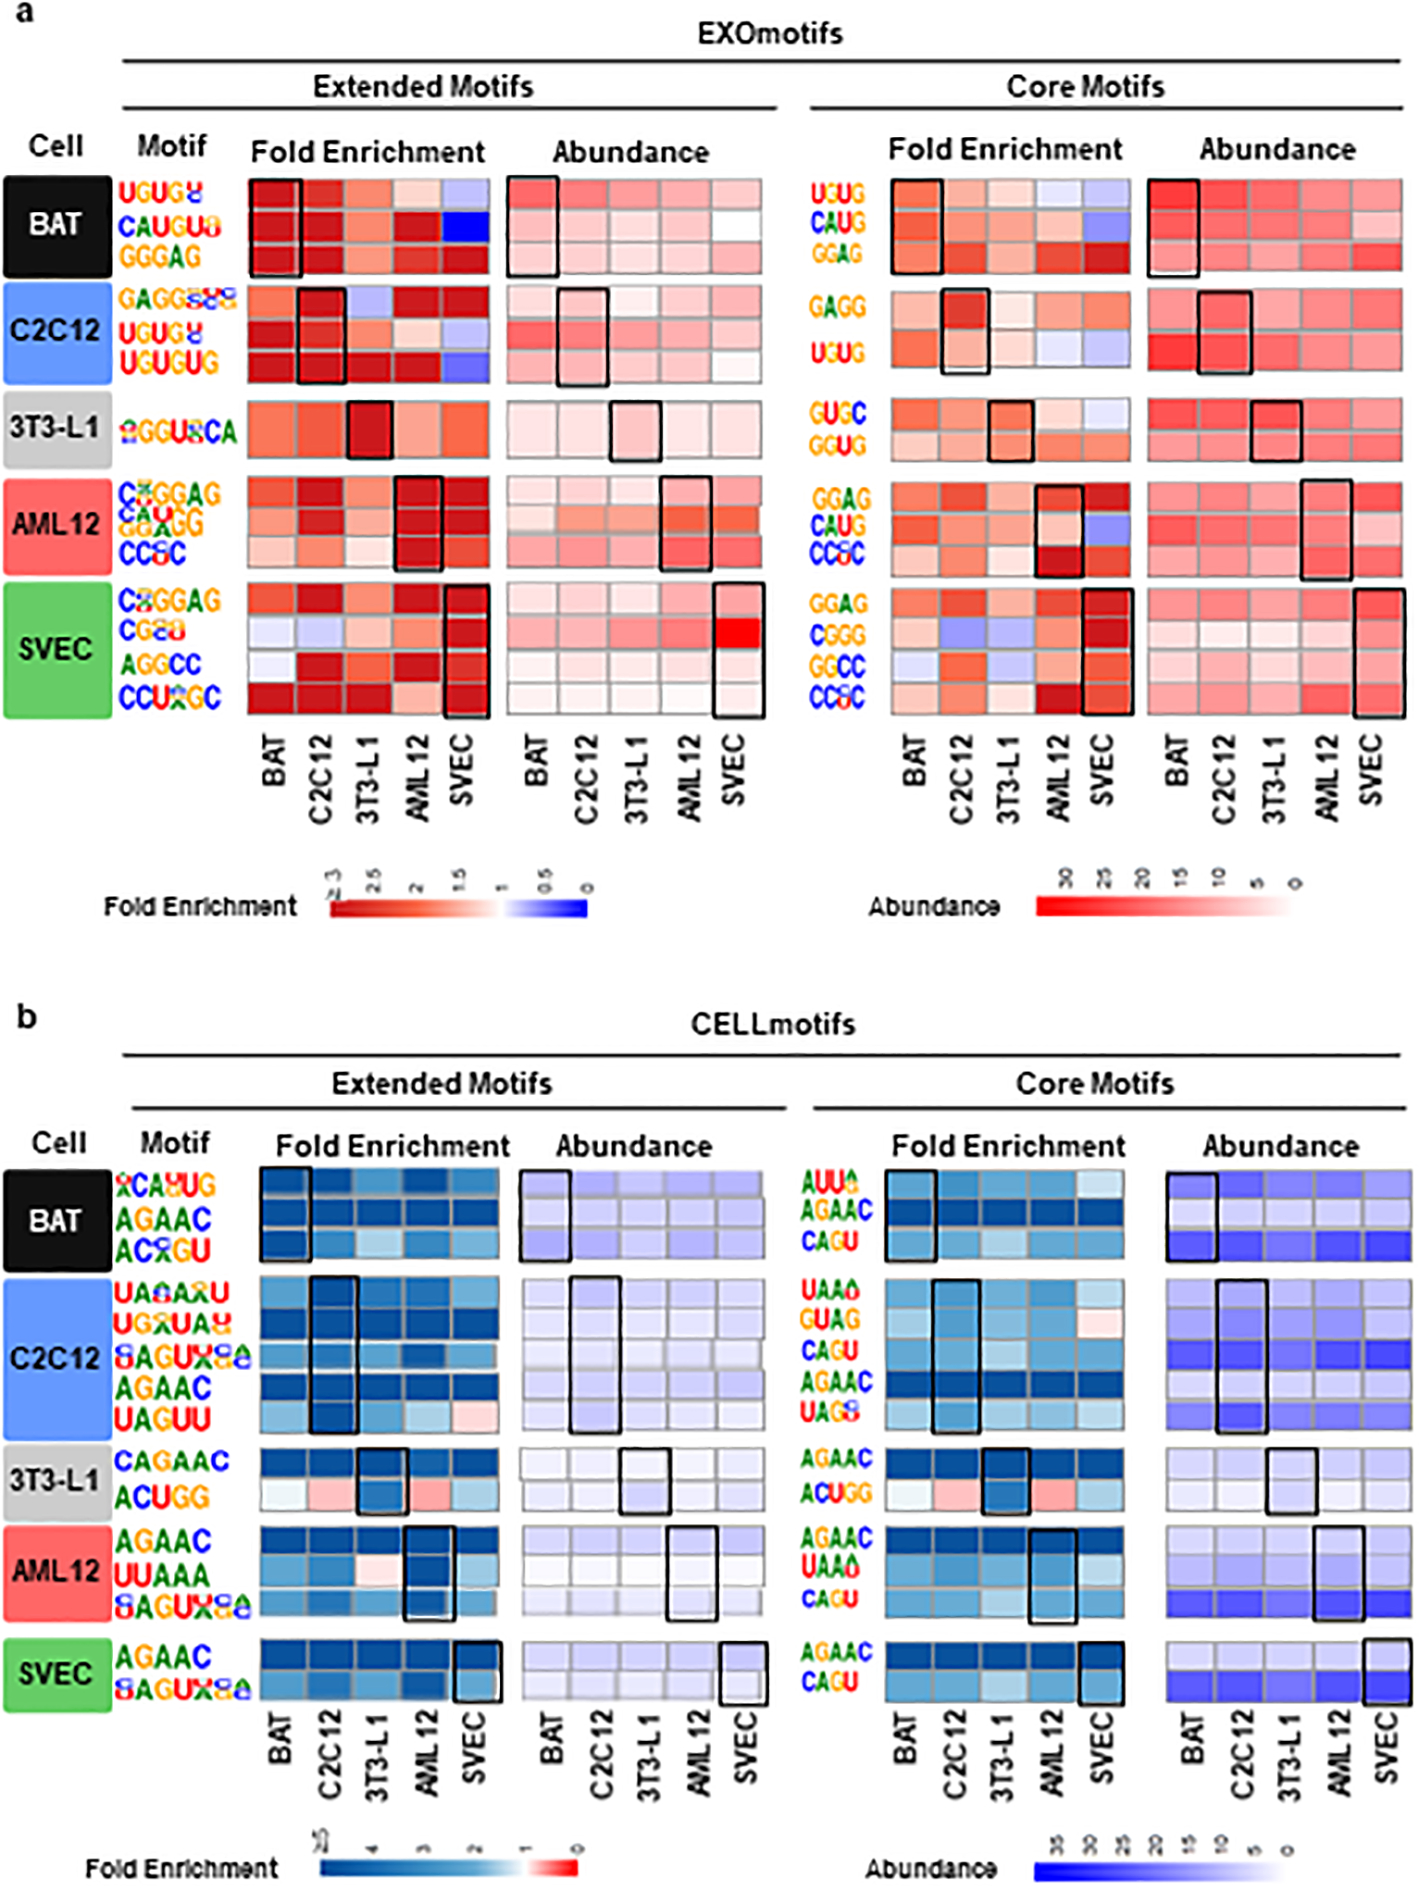
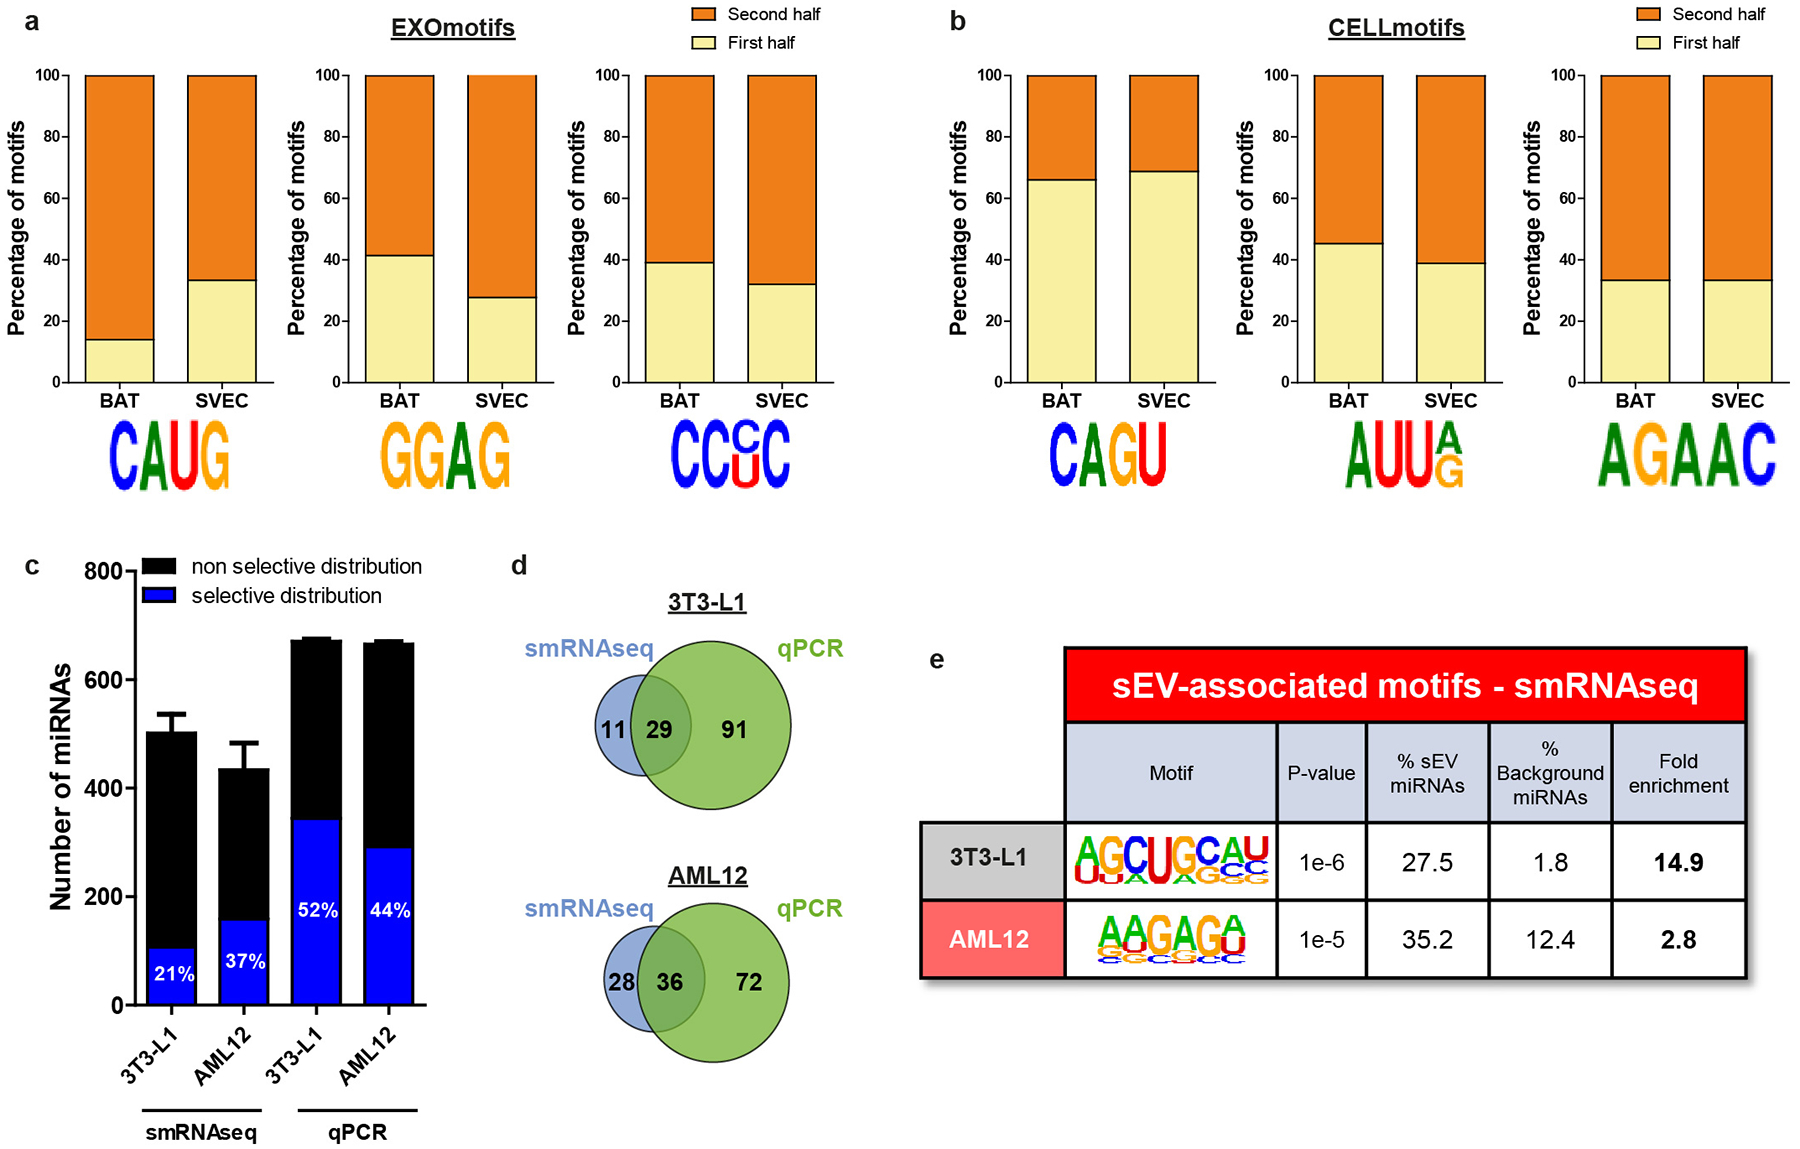
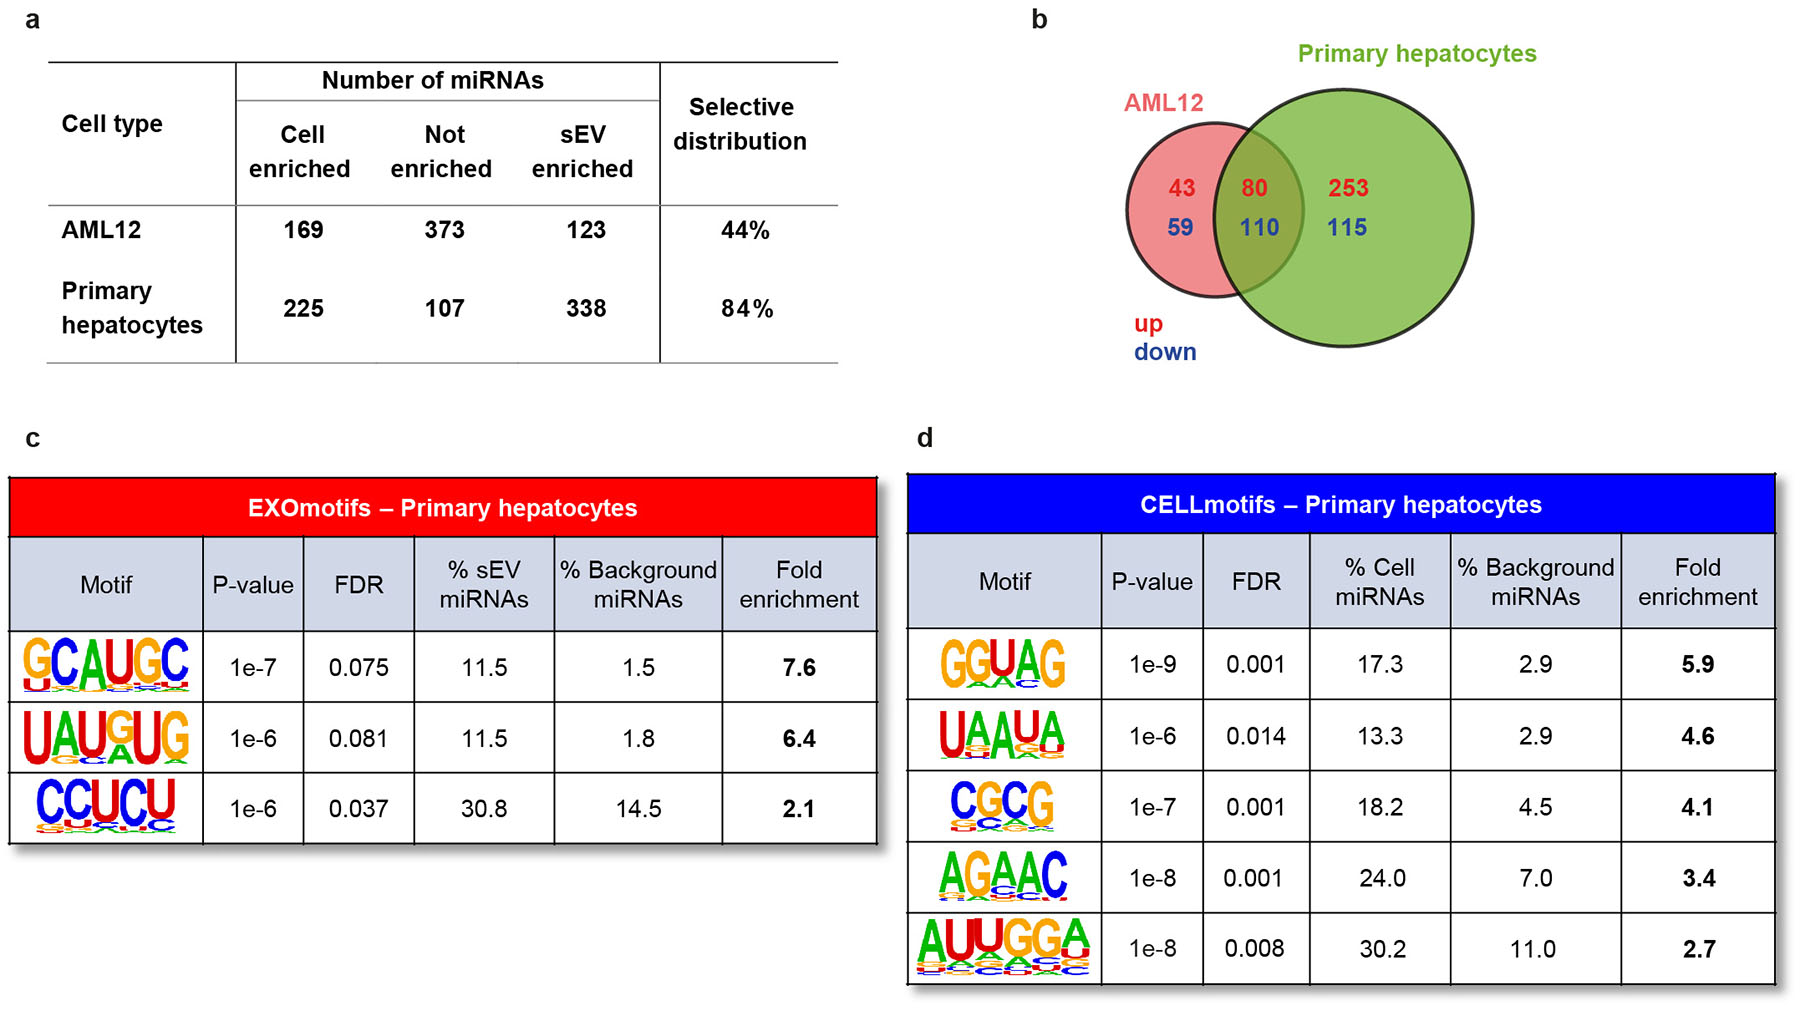
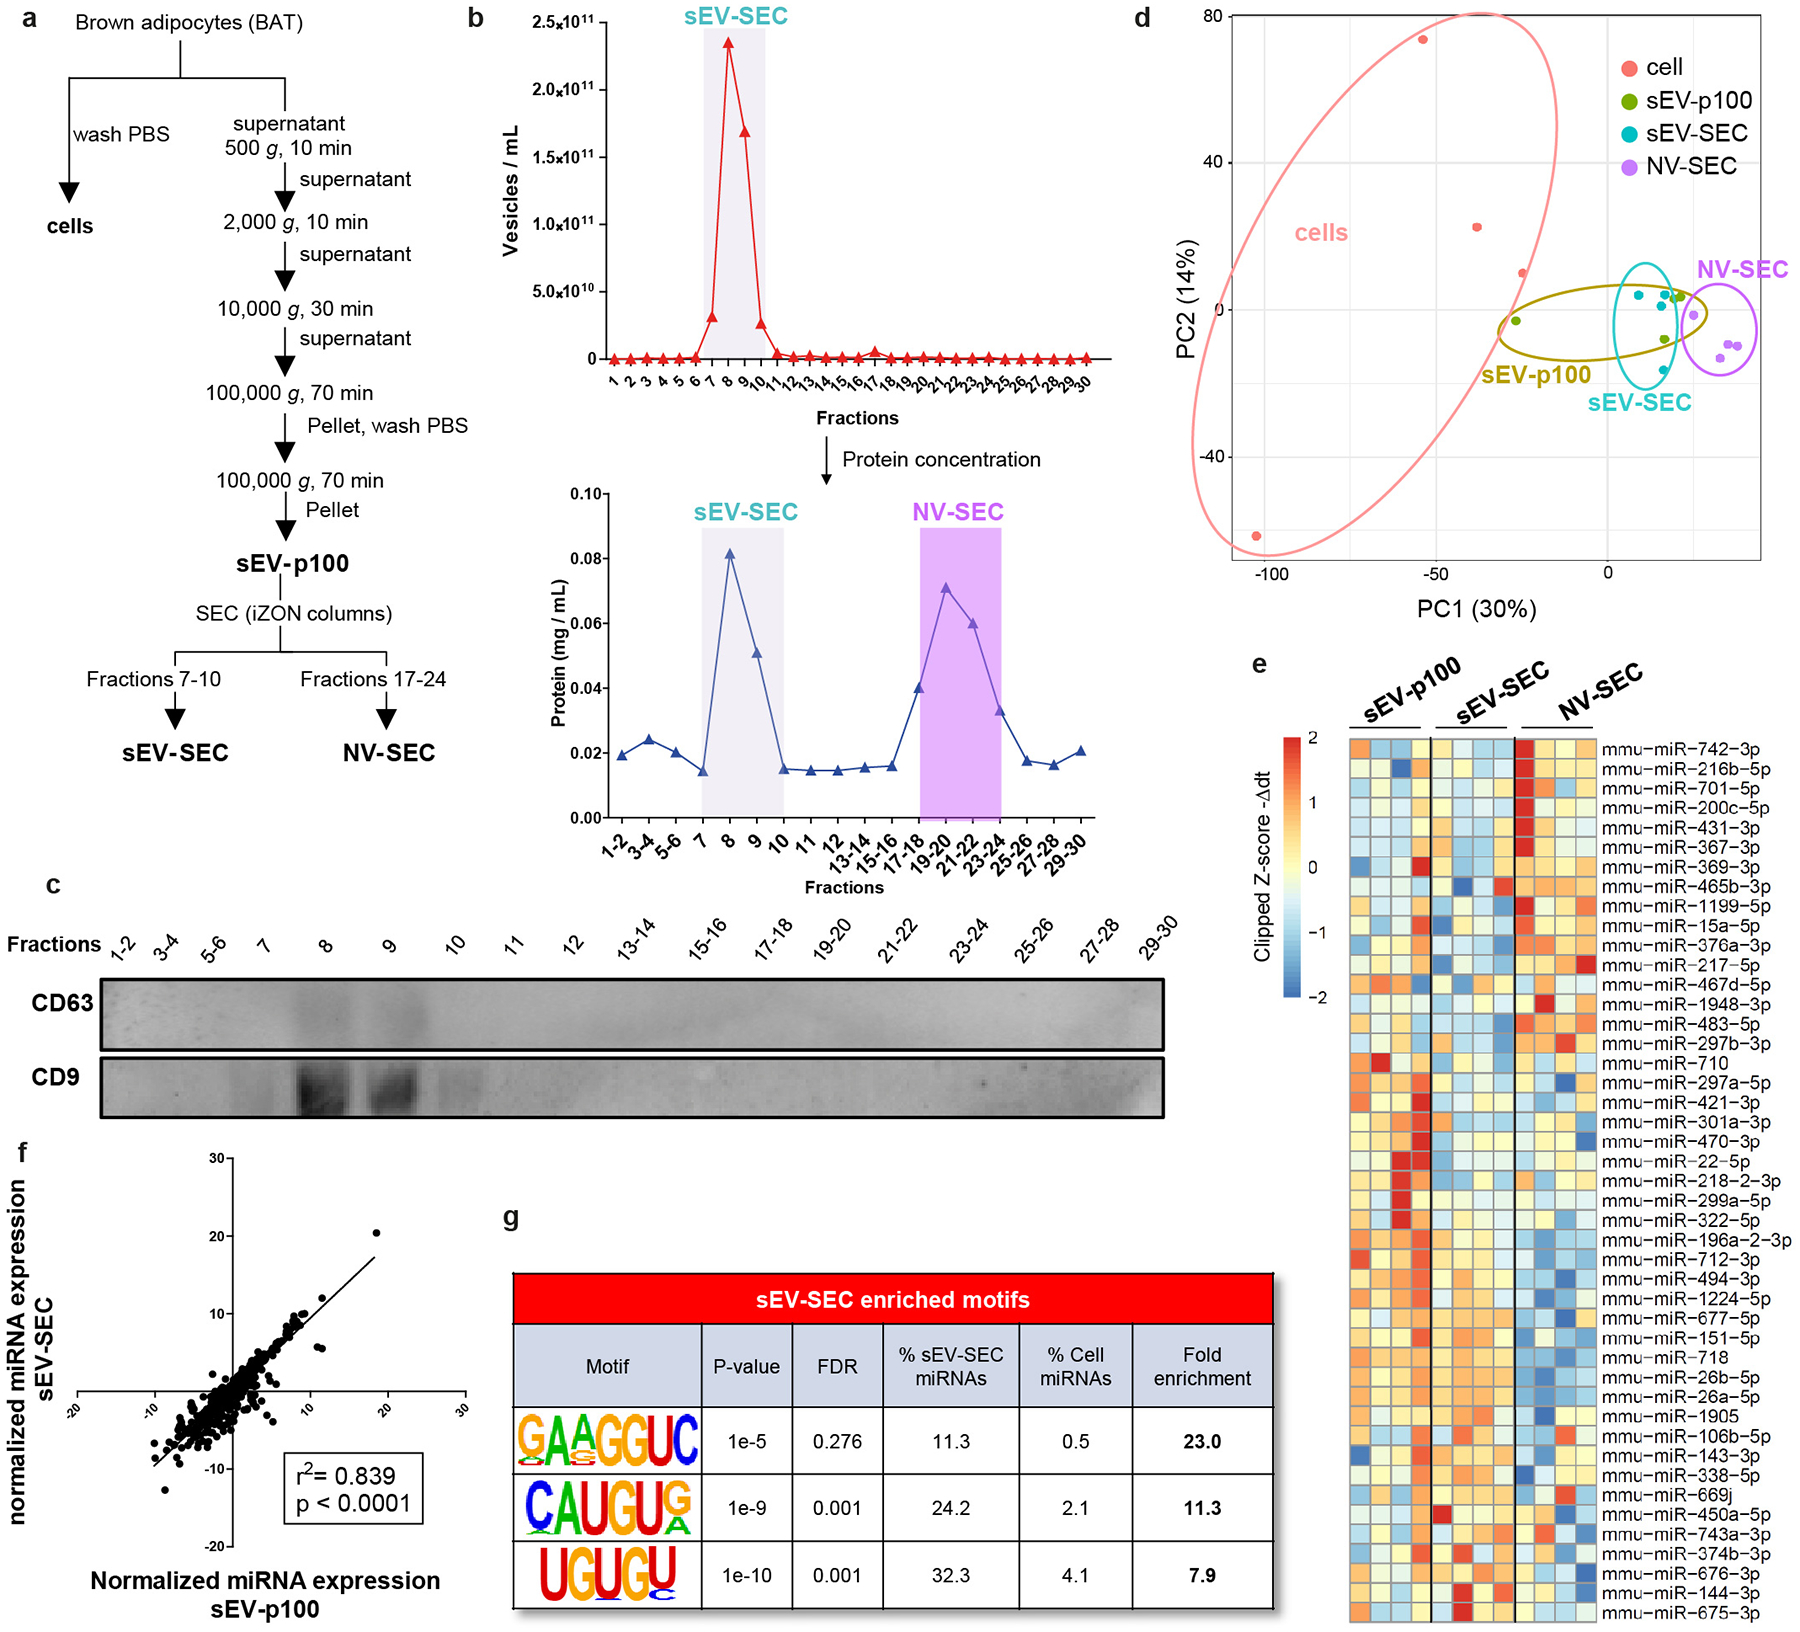
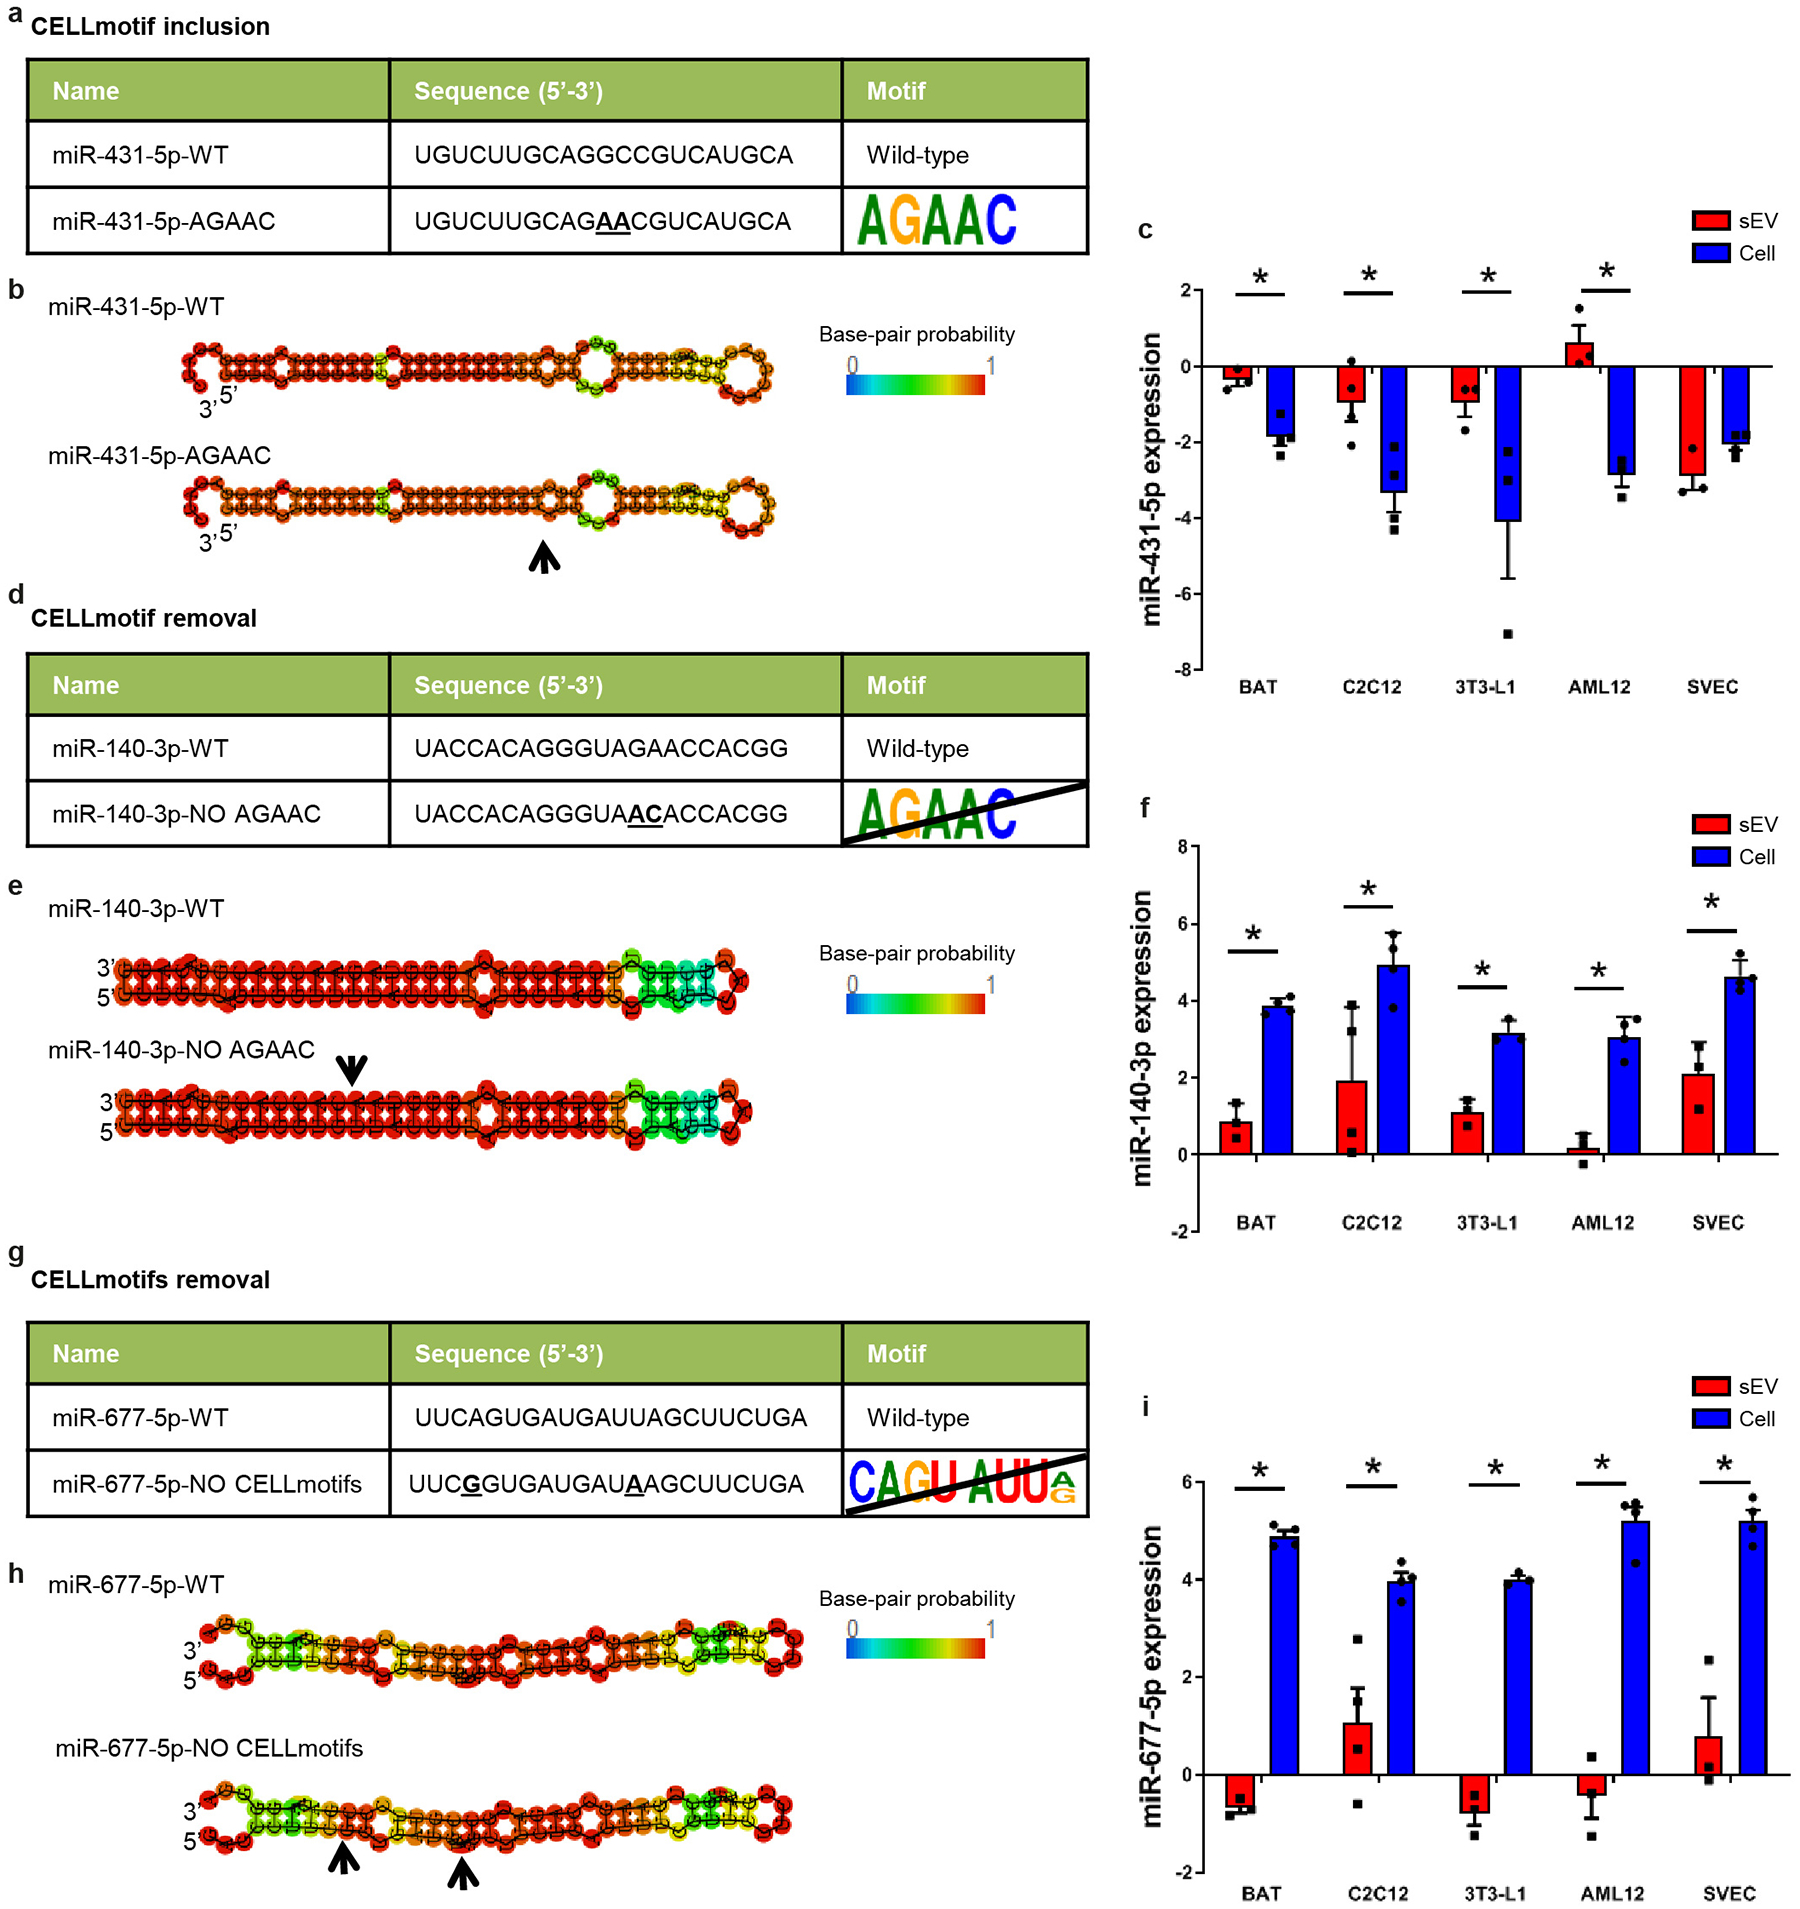
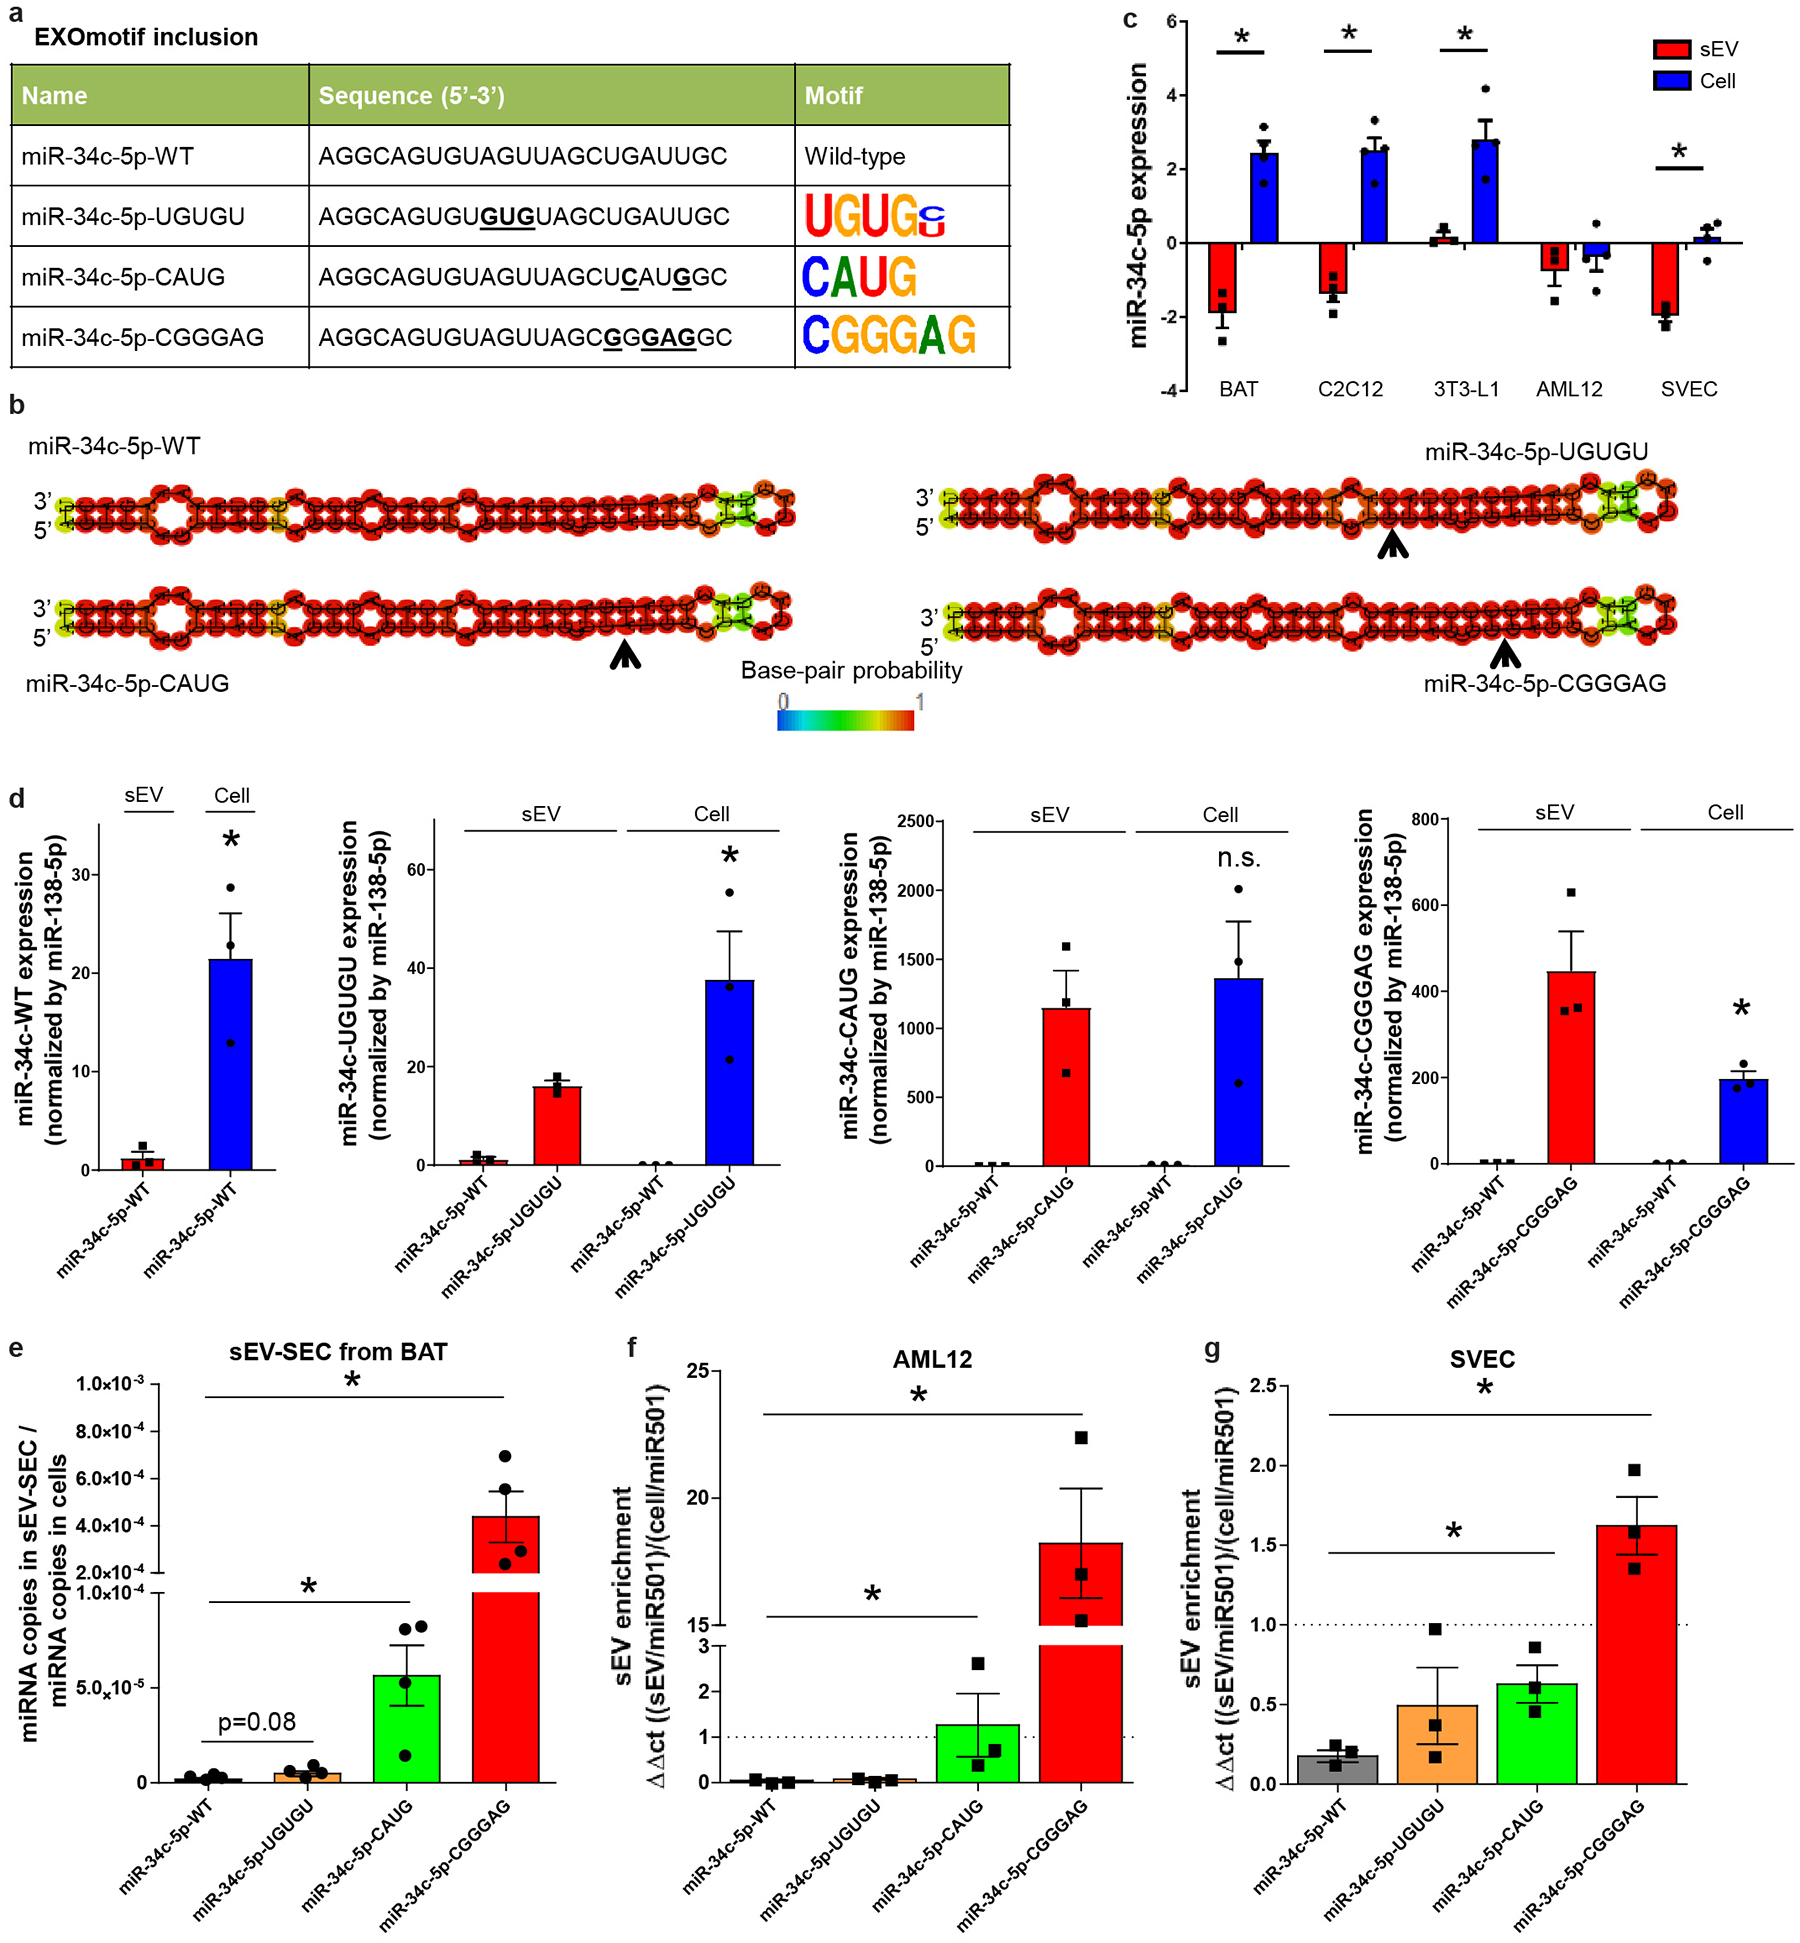
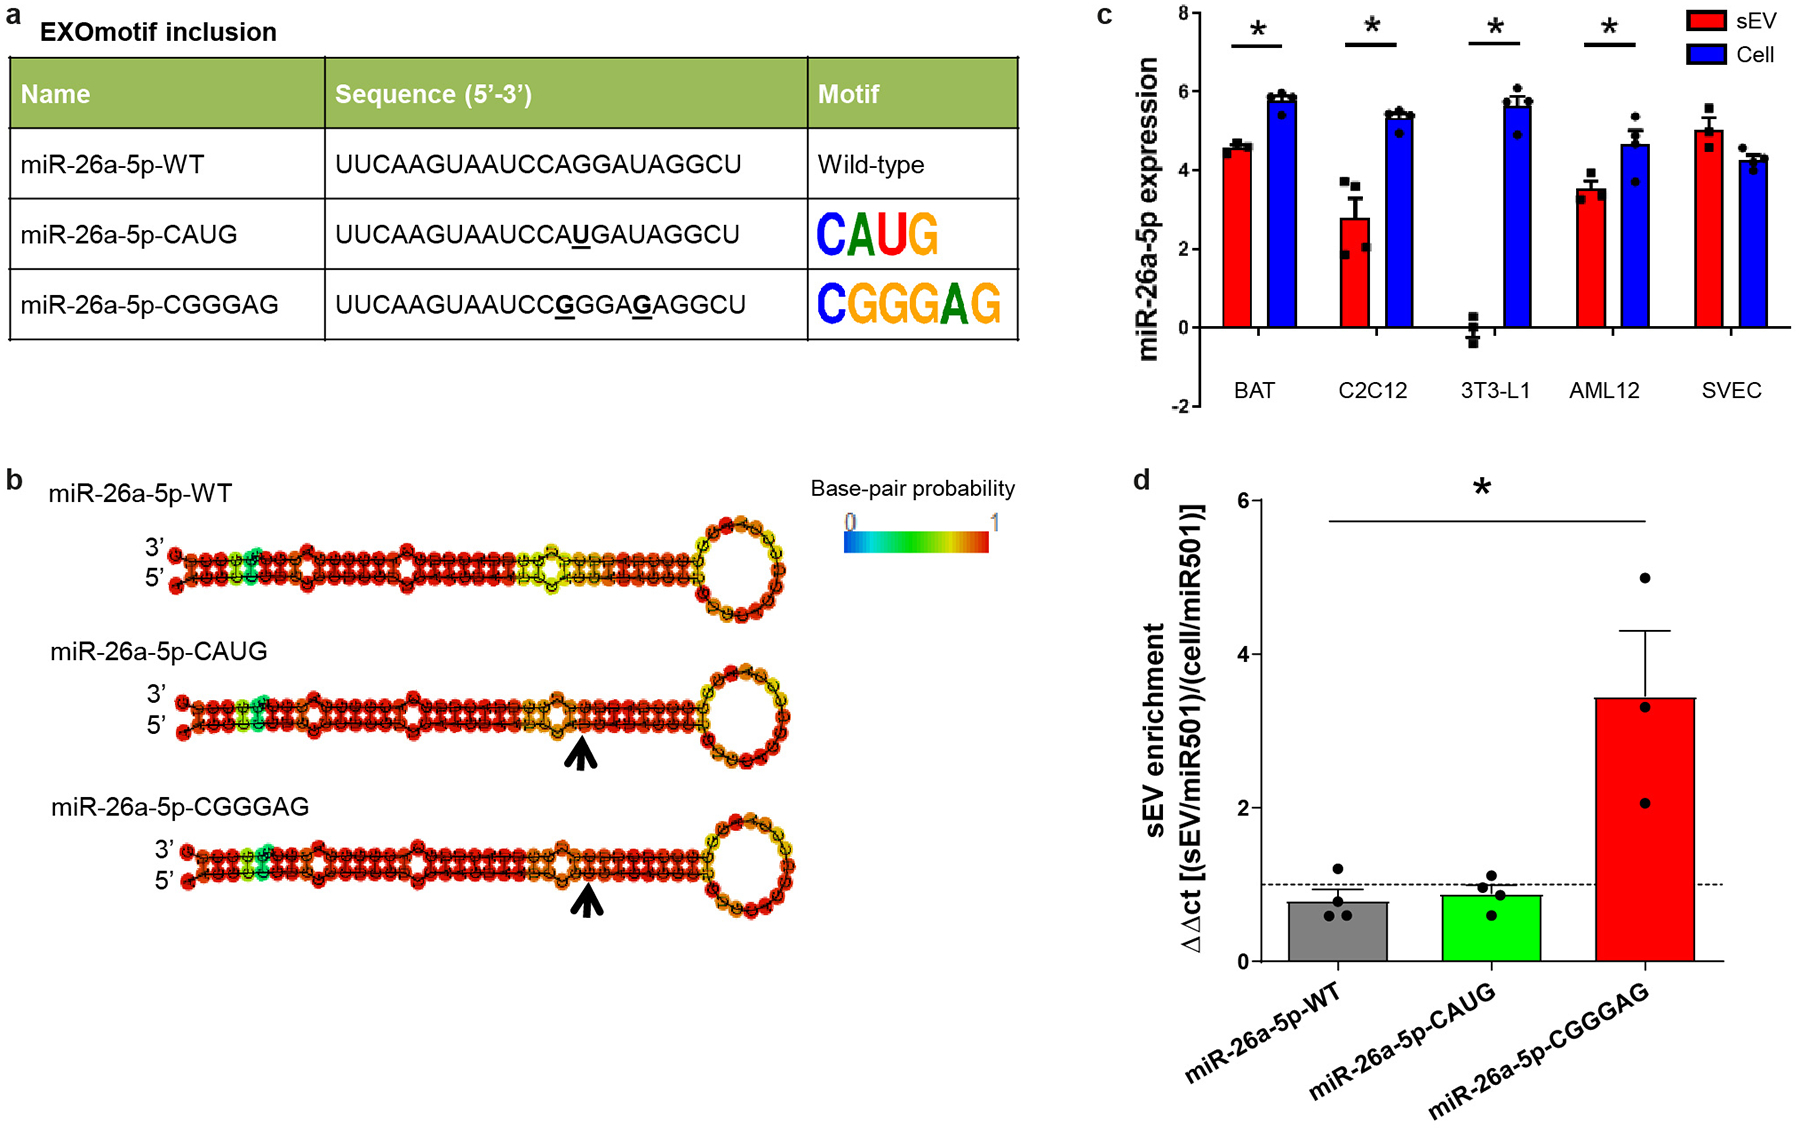
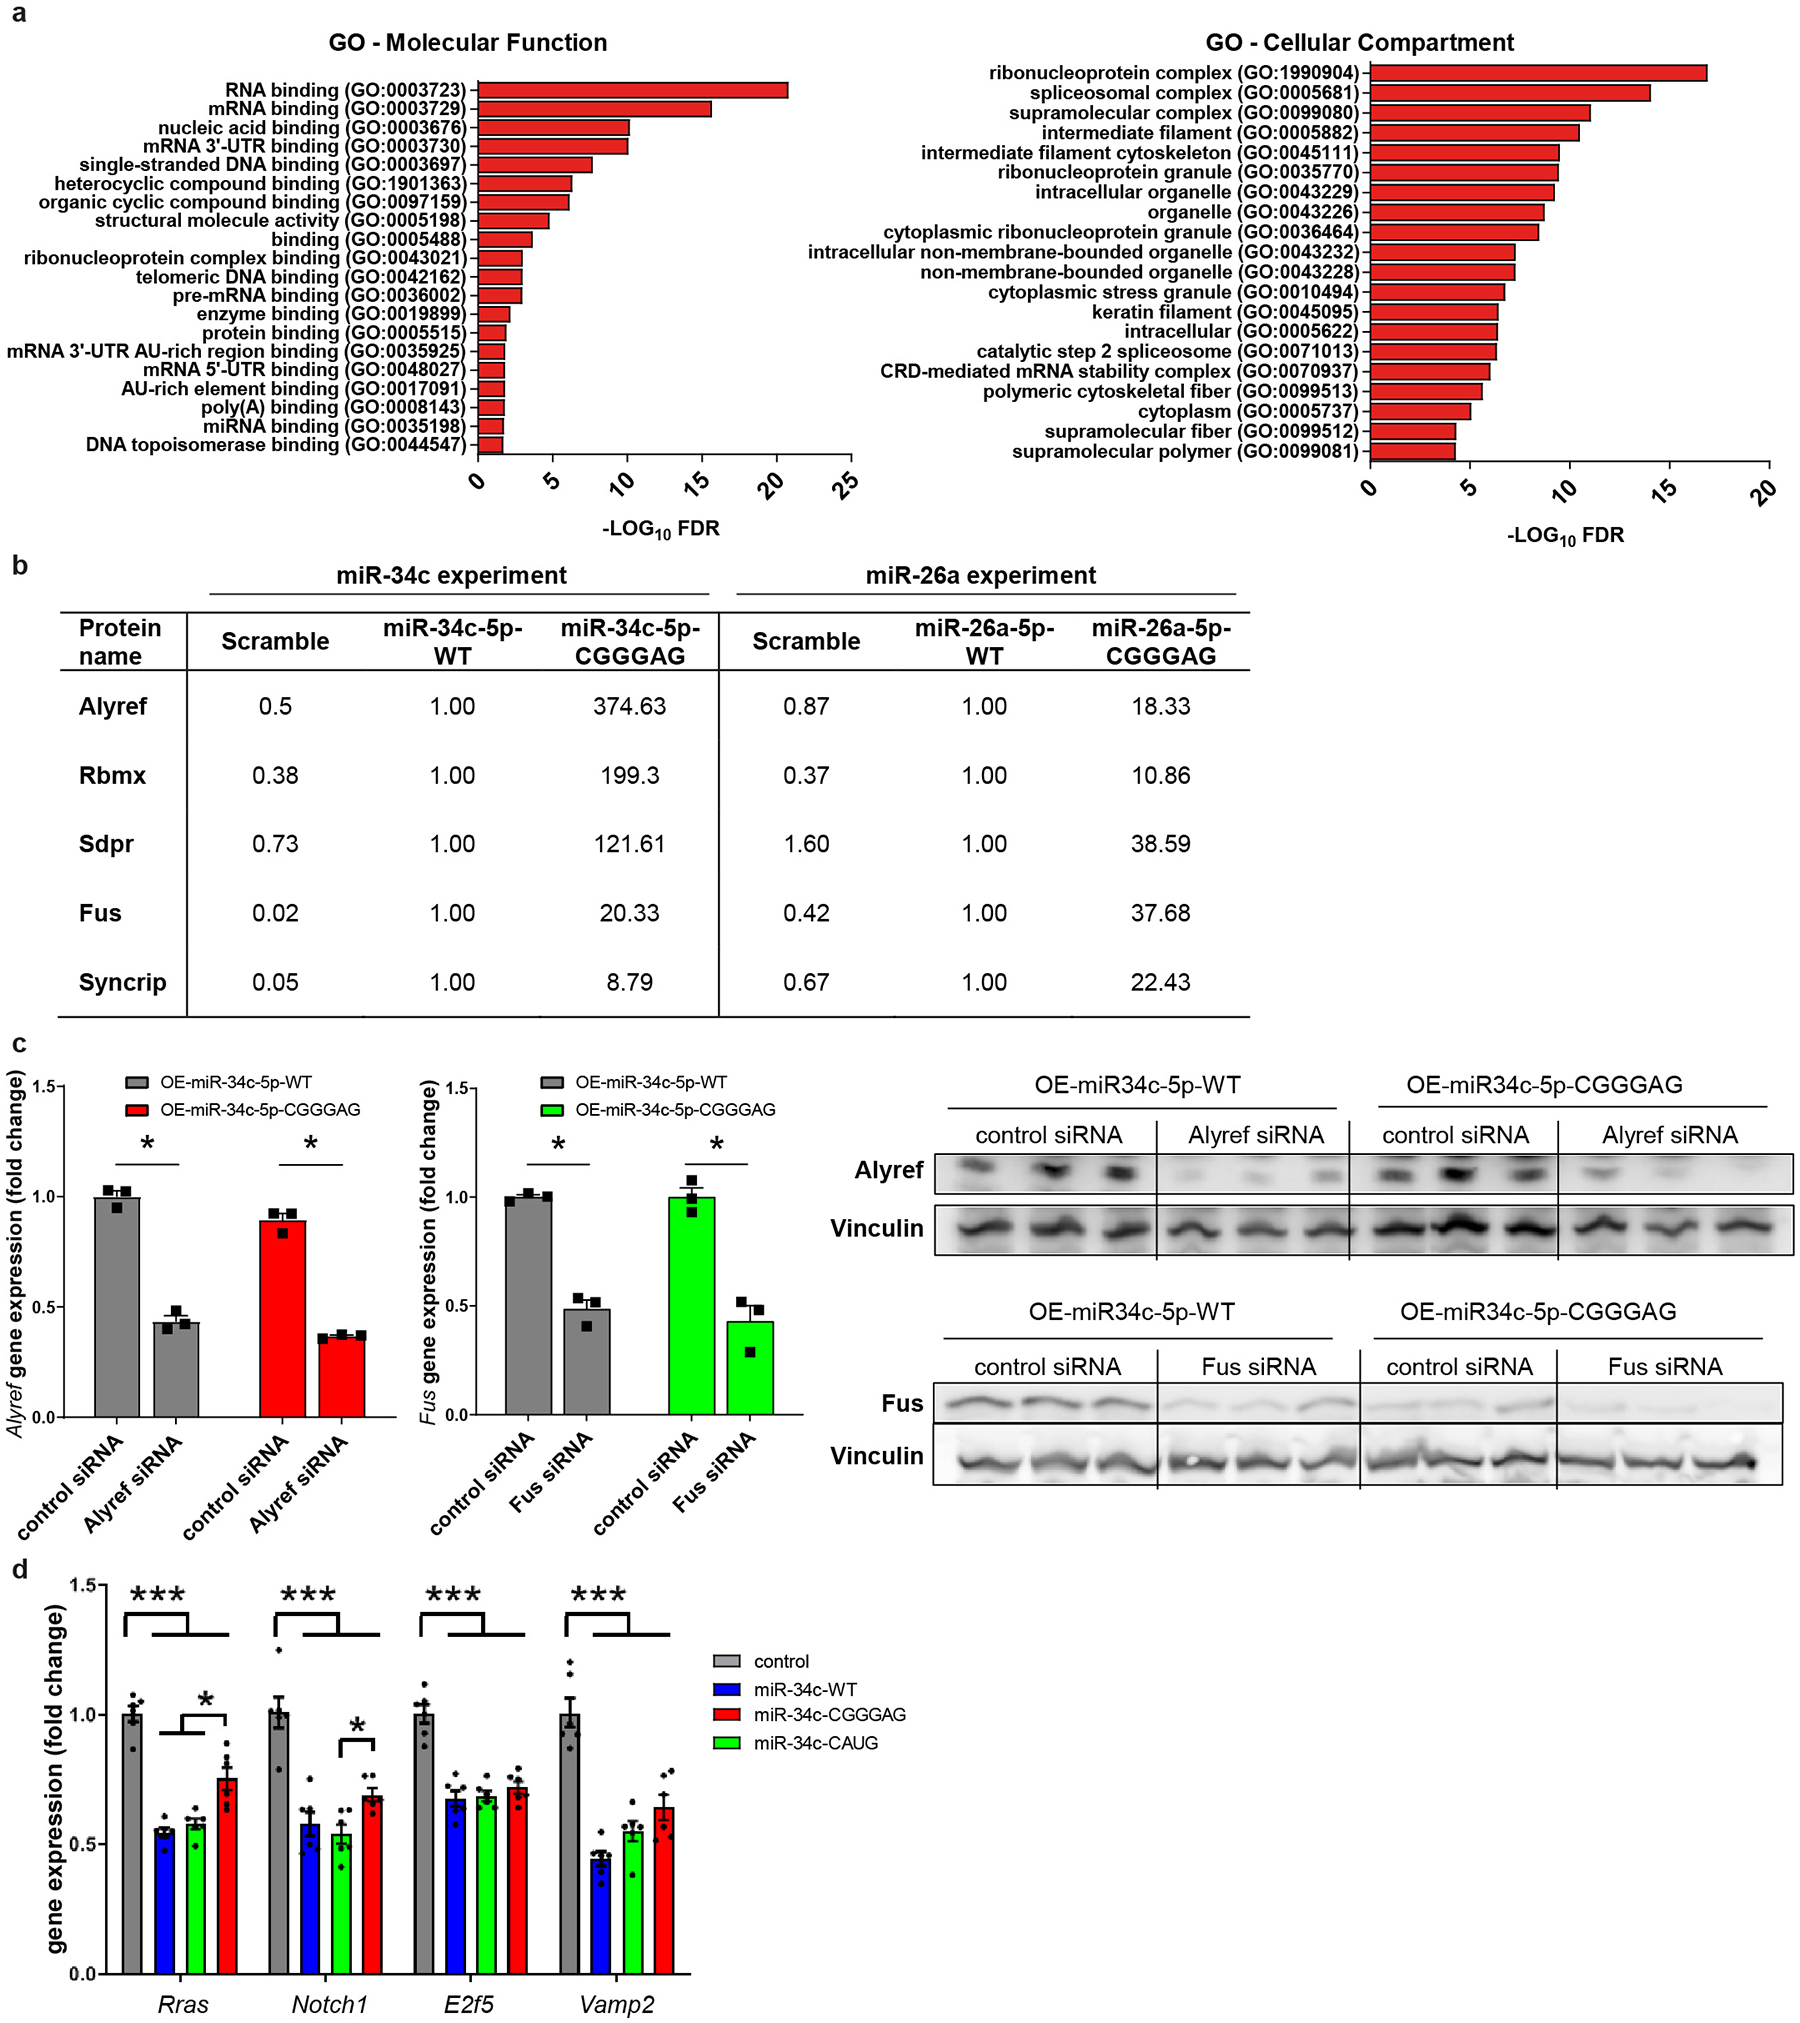
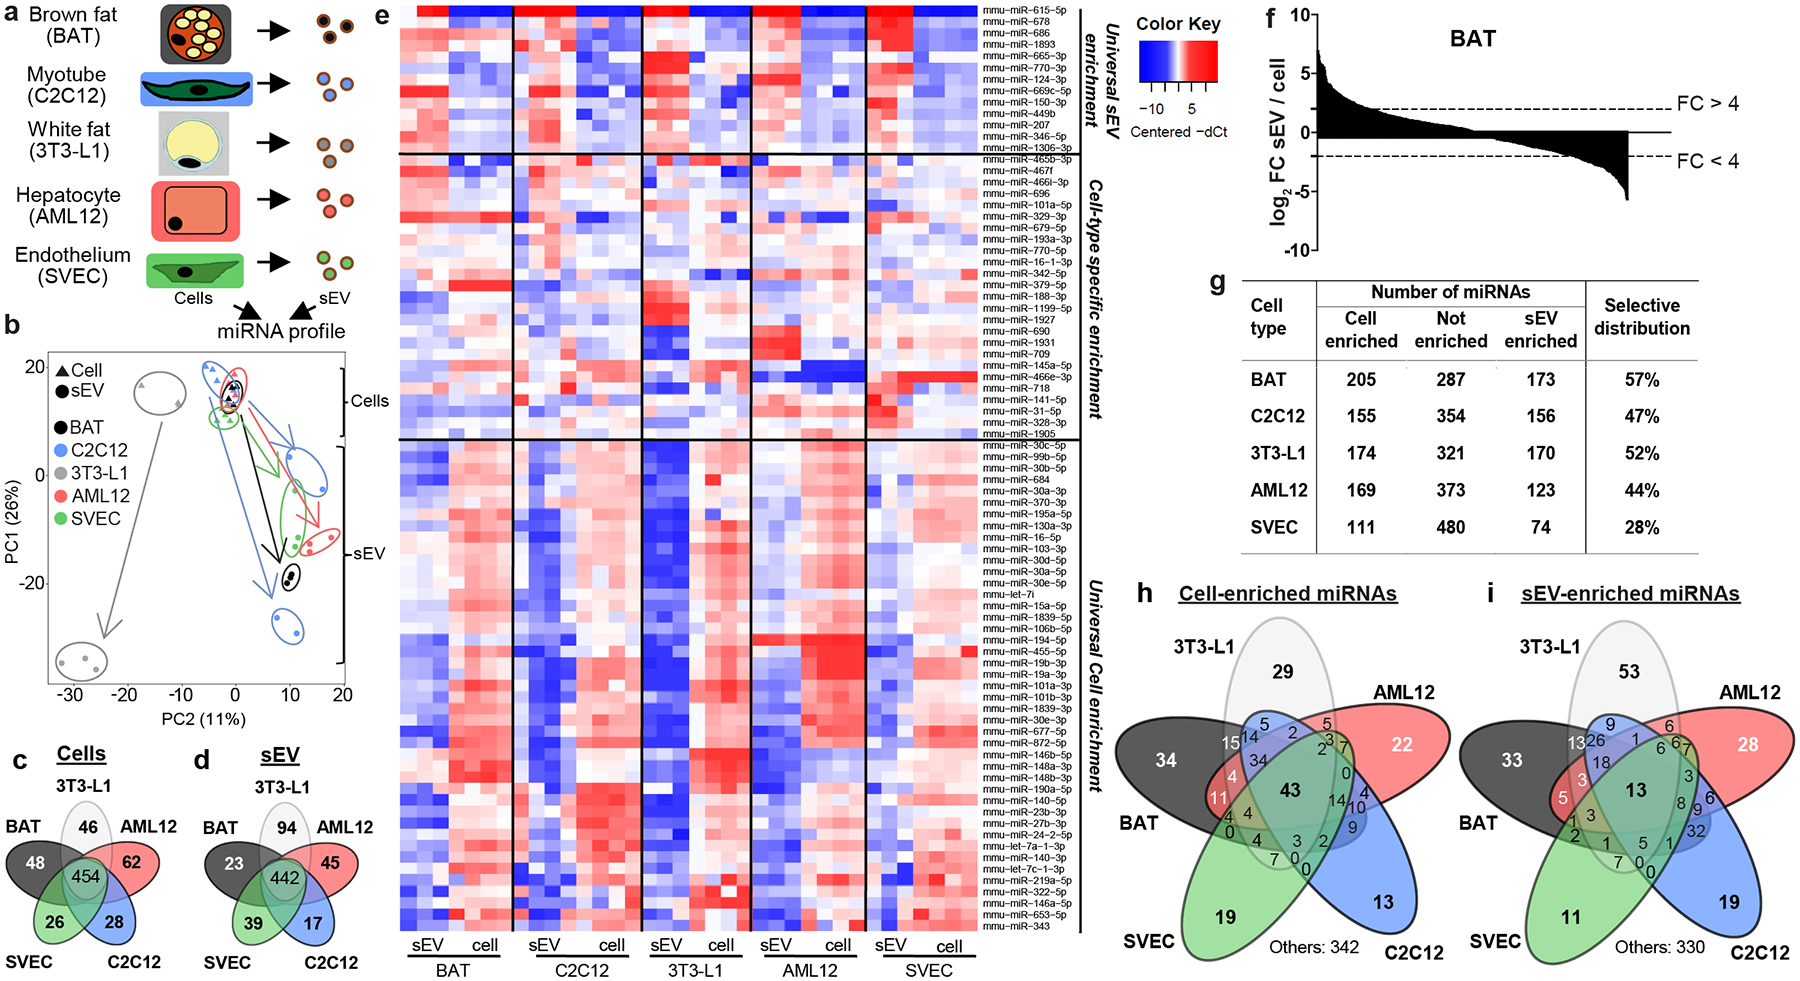
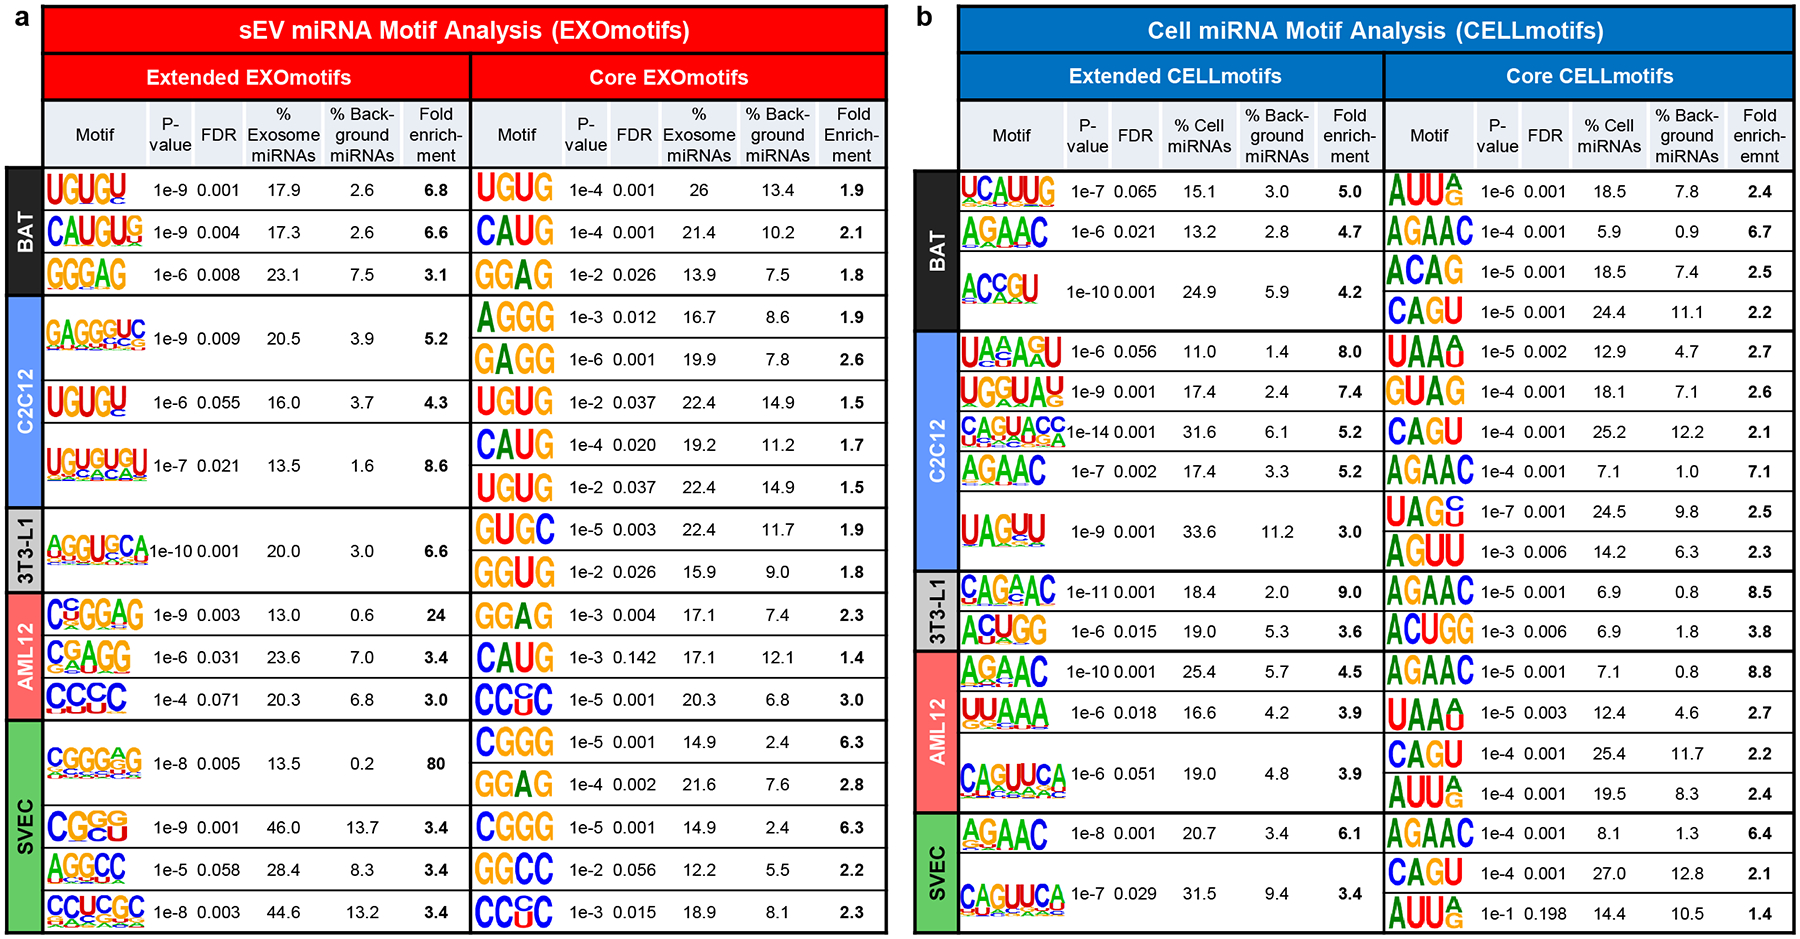
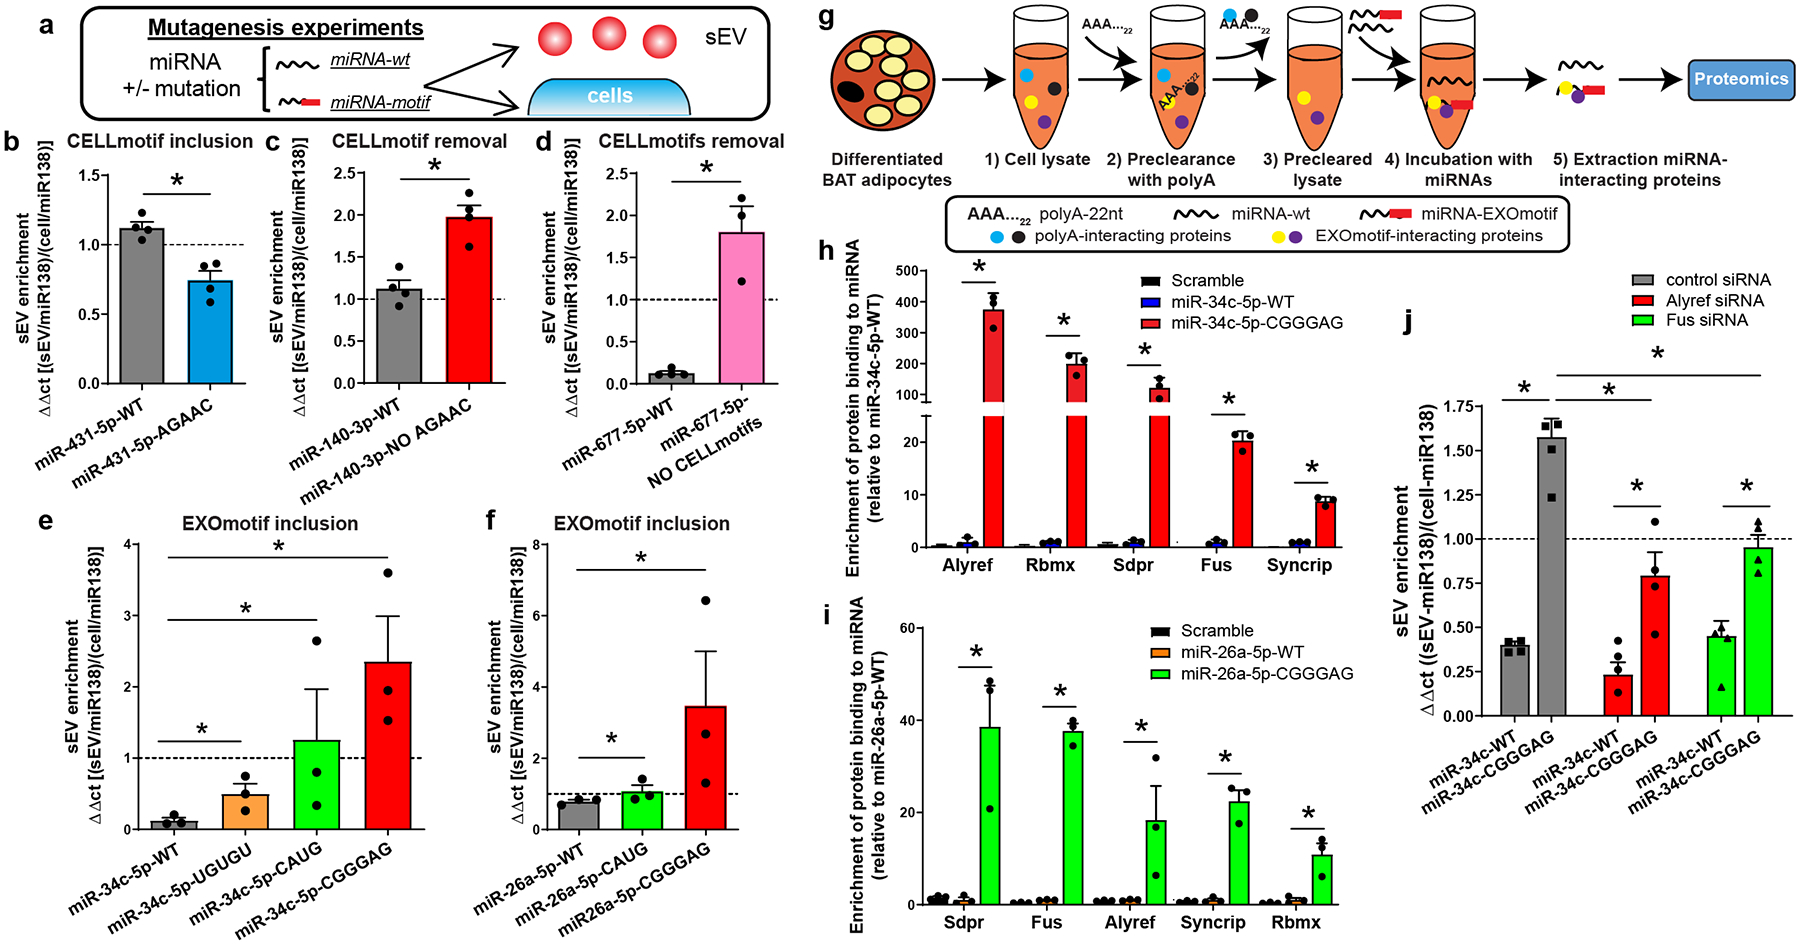
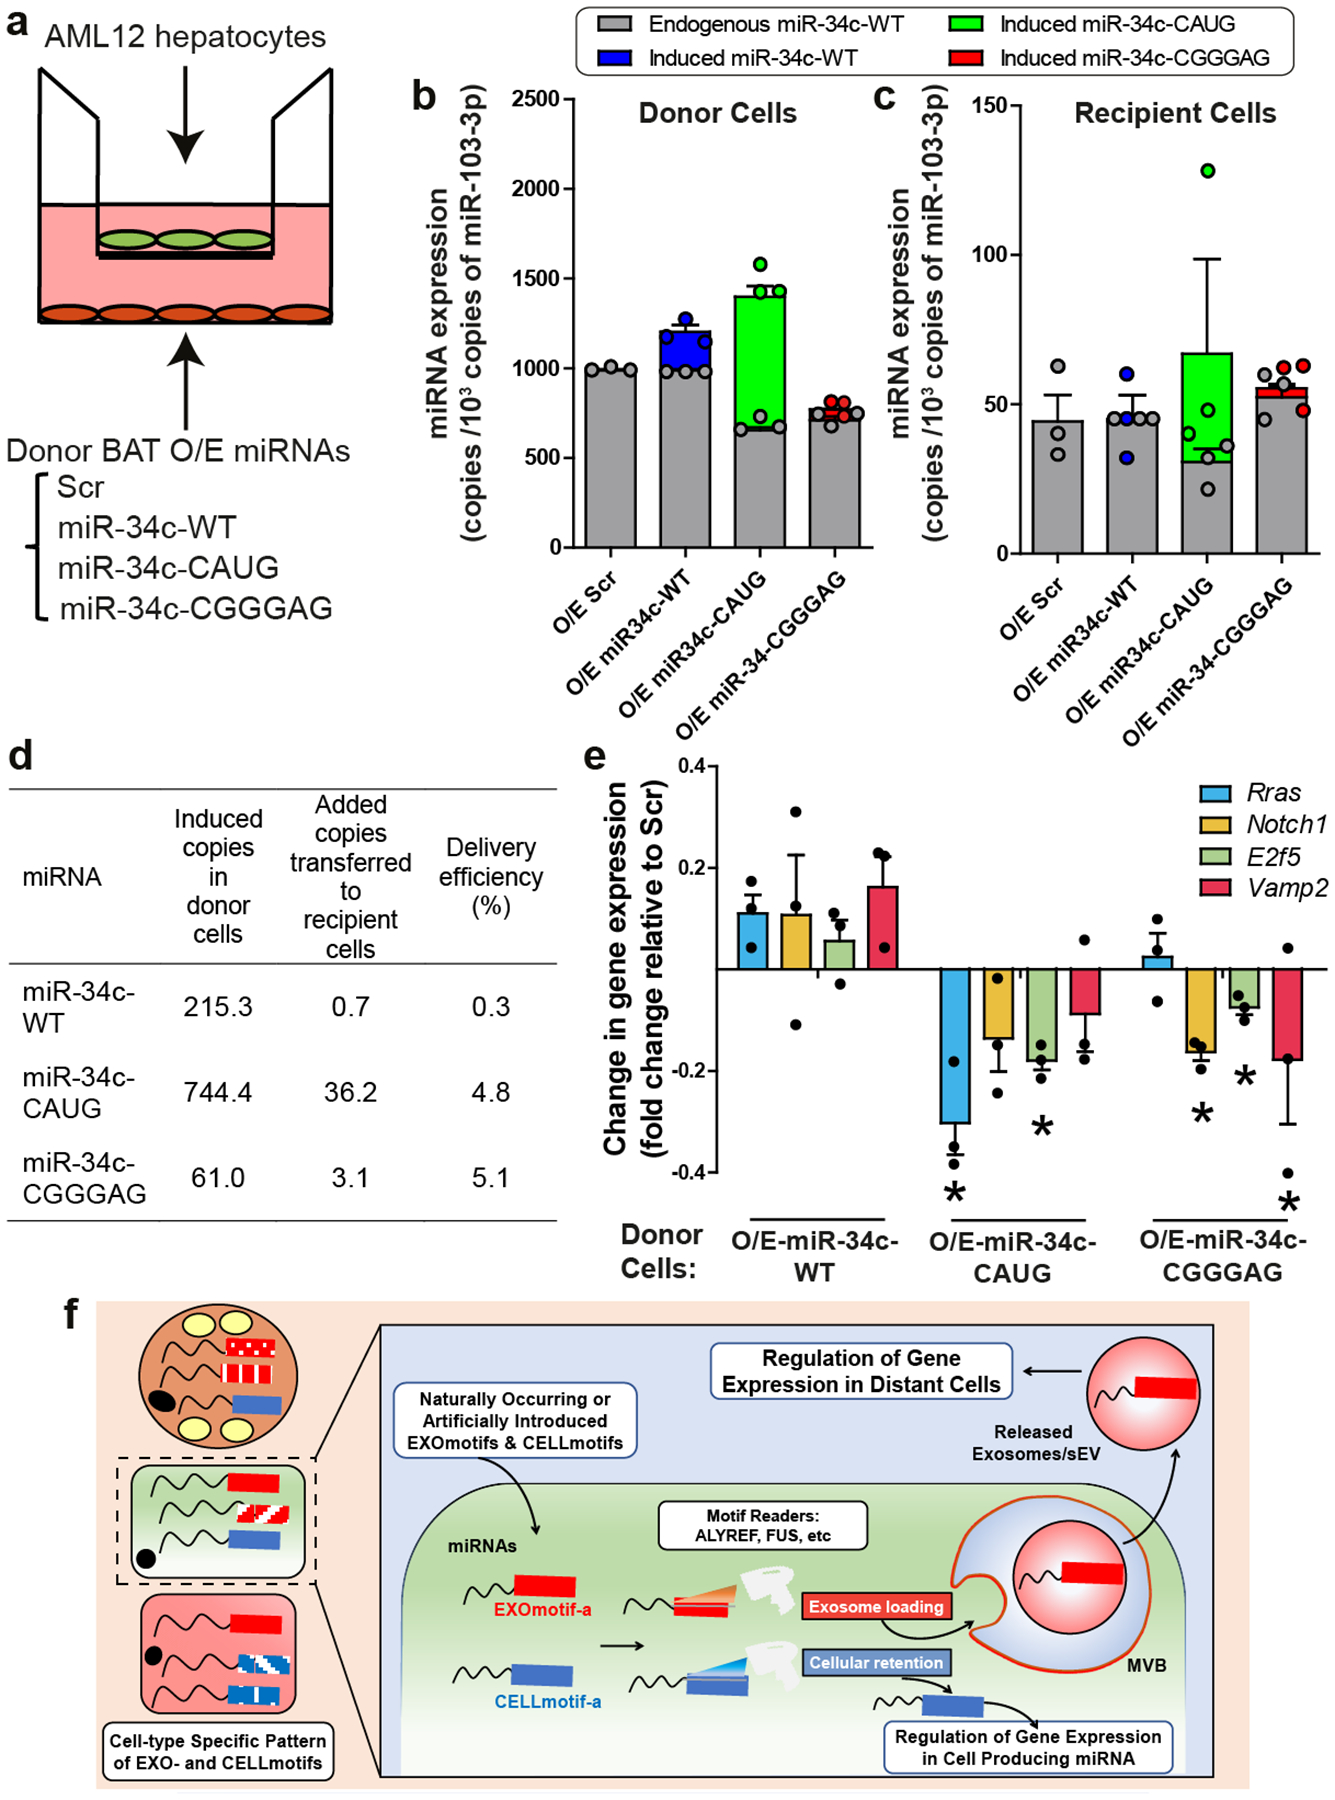
Exosomes and other small extracellular vesicles (sEVs) provide a unique mode of cell-to-cell communication in which microRNAs (miRNAs) produced and released from one cell are taken up by cells at a distance where they can enact changes in gene expression1-3. However, the mechanism by which miRNAs are sorted into exosomes/sEVs or retained in cells remains largely unknown. Here we demonstrate that miRNAs possess sorting sequences that determine their secretion in sEVs (EXOmotifs) or cellular retention (CELLmotifs) and that different cell types, including white and brown adipocytes, endothelium, liver and muscle, make preferential use of specific sorting sequences, thus defining the sEV miRNA profile of that cell type. Insertion or deletion of these CELLmotifs or EXOmotifs in a miRNA increases or decreases retention in the cell of production or secretion into exosomes/sEVs. Two RNA-binding proteins, Alyref and Fus, are involved in the export of miRNAs carrying one of the strongest EXOmotifs, CGGGAG. Increased miRNA delivery mediated by EXOmotifs leads to enhanced inhibition of target genes in distant cells. Thus, this miRNA code not only provides important insights that link circulating exosomal miRNAs to tissues of origin, but also provides an approach for improved targeting in RNA-mediated therapies.


Conflict of interest statement

Competing interest declaration

The authors declare no competing interests. A patent submitted by RGM and CRK (US Patent US2021171949A1) covers the data and applications of the findings described in this manuscript.

Figures

Extended Data Figure 1.
General features of sEV secretion among the five cell types studied. a) Number of vesicles over 48 hours released by each cell type normalized by the number of cells in the tissue-culture plate (n=4). *P≤0.05 (indicated cell type versus all other cell types), § P≤0.05 (indicated cell type versus 3T3-L1, C2C12 and AML-12) (Kruskal-Wallis followed by Mann-Whitney U test). b) Average vesicle size of the sEV as determined by Nanoparticle tracking analysis (NTA) for each cell type (n=4). c) Average size distribution and number of vesicles released per cell for each of the five cell types. d) Immunoblotting for the indicated sEV (ALIX, TSG101 and CD9) and cellular (GM130, CANX) markers in sEV and cell lysates from AML12 hepatocytes and BAT brown adipocytes. e) Electron micrograph showing CD63 gold immunostaining of sEV isolated from C2C12 cells. f) RNA yield obtained from sEV isolated from each cell type and normalized by the number of cells in the tissue-culture plate (n=3). *P≤0.05 (indicated cell type versus all other cell types); § P≤0.05 (indicated cell type versus 3T3-L1 and BAT) (Kruskal-Wallis followed by Mann-Whitney U test). g) Principal component analysis showing cellular miRNA profiles for each cell type. h) Heatmap showing the top 10 representative cellular miRNAs of each cell type. i) Heatmap showing the top 10 representative sEV miRNAs of each cell type. j) Comparative miRNA profile between cell-derived sEV and non-conditioned medium (NCM). Same volume of NCM as in cell-conditioned medium was processed for sEV isolation by differential ultracentrifugation. RNA was isolated and a miRNA profiling was performed for NCM. The miRNA expressions for the 13 miRNAs found sEV-enriched in all 5 cell types were compared to the NCM average Ct by ΔΔct method and represented as fold change. Each dot is the relative average value of each of the five cell types. Data are expressed as mean ± SEM.
Extended Data Figure 2.
Cell-type specific sEV enrichment of miRNAs and sEV versus cell housekeeping miRNAs. Effect of percentage of CG and Gibbs free energy (ΔG) in miRNA sorting or cellular retention. a) Normalized gene expression of representative miRNAs showing cell-type specific sEV enrichment: miR-696 (BAT), miR-770-5p (C2C12), miR-1927 (3T3-L1), miR-1931 (AML12) and miR-718 (SVEC). Average Ct from the whole miRNA profile was used for normalization for each sample (n=3–4). *P≤0.05 (Limma t-test) b) Normalized gene expression of two representative miRNAs (miR-138-5p and miR-501-5p) showing similar sEV and cellular expression for each cell type. Average Ct from the whole miRNA profile was used for normalization for each sample (n=3–4). c) Percentage of CG content in the sequence of the miRNAs: those sorted into the sEV in all cells are shown in red (n=13); those sorted into sEV in 3 or 4 of the five cell types are shown in green (n=90); those not enriched in either sEV or cells are shown in black (n=109); those retained in 3 or 4 cell types are shown in pink (n=97); and those retained in the cell bodies of all cell types are shown in blue (n=43). d) The calculated Gibbs free energy (ΔG) for each of the miRNA in each of the five groups described in panel c. For c and d lines indicate mean value, **P≤0.01, *** P≤0.001 between the indicated group and the other four groups (ANOVA followed by Bonferroni post-hoc test in c and d). Data are expressed as mean ± SEM.
Extended Data Figure 3.
Comparison of all identified Extended and Core EXOmotifs (a) and CELLmotifs (b) among the five different cell types. a) Fold enrichment (left half) and abundance (right half, as percentage of sEV-enriched miRNAs) containing the sEV-associated miRNA motifs. The first column indicates the cell type where these motifs were originally identified (see Main Figure 2a) and here shown in its predominant form in the second column (Extended motifs) and fifth column (Core motifs). The fold enrichment is shown in a red (high sEV enrichment)-white (neutral)-blue (cell enrichment) color gradient for indicated cell types displayed below. The abundance is shown in a red (high)-white (low) color gradient. The rectangles highlight the enrichment and presence of the motifs in the cell types where they were originally identified. b) Fold enrichment (left half) and abundance (right half, as percentage of cell-enriched miRNAs) containing the Cell-associated miRNA motifs. As in a), the first column indicates the cell type where these motifs were originally identified (see Main Figure 2b) and here shown in its predominant form in the second column (Extended motifs) and fifth column (Core motifs). The fold enrichment is shown in a blue (high cell enrichment)-white (neutral)-blue (red sEV enrichment) color gradient for indicated cell types displayed below. The abundance is shown in a blue (high)-white (low) color gradient. The rectangles highlight the enrichment and presence of the motifs in the cell types where they were originally identified.
Extended Data Figure 4.
Location of EXO and CELLmotifs and comparison between small miRNAseq (smRNAseq) and qPCR-based miRNA profiling. a-b) Percentage of miRNAs showing indicated EXOmotifs (a) or CELLmotifs (b) either in the 5’ half (nucleotides 1–9, light yellow bars) or 3’ half (from nucleotide 10 to the 3’ end, orange bars) of the miRNA sequence. c) sEV and cell lysates from differentiated 3T3-L1 white adipocytes and AML12 hepatocytes were subjected to smRNAseq or qPCR-based profiling (n=4 for each cell type and compartment). Detected miRNAs by each method in each cell type is displayed in black bars. Selective distribution (either sEV-enriched or cell-enriched) was calculated for each miRNA using both methods and the number of miRNAs displaying significant selective distribution is shown in blue bars. The percentages in the blue bars refers to the ratio between the number of selectively distributed miRNA and the total number of detected miRNAs for each method and cell type. d) Venn diagrams indicating the number of miRNAs with a selective distribution in sEV or cells detected by smRNAseq (blue circles) and qPCR (green circles) in 3T3-L1 (above) or AML12 (below). The total number of miRNAs detected simultaneously by these two methods was 180. e) Table depicting the top EXOmotif found by HOMER software in sEV-enriched miRNAs from 3T3-L1 and AML12 detected by smRNAseq. Fold enrichment refers to the ratio between presence in the sEV-enriched miRNAs and presence in the rest of miRNAs (background).
Extended Data Figure 5.
Comparison of miRNA profiling of AML12 and primary hepatocytes. Primary hepatocytes were isolated from C57Bl/6J wild-type mice (n=4) and cultured for 48 h in exosome-free medium to collect sEV and cell lysates, which were later subjected to RNA isolation and miRNA profiling for comparison to AML12 hepatocytes. a) Number of miRNAs showing selective cellular retention, non-selective distribution or selective sEV sorting in AML12 and primary hepatocytes. The selective distribution column is the sum of sEV- and cell-enriched miRNAs divided by the total number of miRNAs detected as percentage. FDR < 0.1 b) Venn-diagram showing the number of sEV- (red) and cell-enriched miRNAs (blue) in AML12 and primary hepatocytes and the overlap between them. c-d) Motifs associated to sEV (c) and cell (d) enrichment in primary hepatocytes. The table shows the significance of the enrichment (P-value), false discovery rate (FDR), the percentage of miRNAs significantly enriched in sEV (in c) or cell (in d) that contain the motif, the percentage of miRNAs not enriched in the background miRNAs containing the motif and the fold-enrichment as the ratio between the previous two columns.
Extended Data Figure 6.
Isolation of sEV and NV using an additional step of size exclusion chromatography. a) Diagram of the isolation method used to obtain cellular, sEV-p100 pellet, sEV-SEC and NV-SEC samples using two rounds of ultracentrifugation followed by size exclusion chromatography (SEC). (n=4). b) NTA analysis for EV concentration (top graph) of the 30 fractions obtained from SEC. These fractions were pooled in pairs in some cases and concentrated using Amicon centrifugal 3 KDa filter prior assessing protein concentration (bottom graph). c) Immunoblot for classical exosomal markers CD63 and CD9 for the concentrated fractions shown in b, bottom graph. d) PCA plot for the miRNA profile from the cells, sEV-p100, sEV-SEC and NV-SEC samples. e) Heatmap of the top differentially expressed miRNAs among sEV-p100, sEV-SEC and NV-SEC. High expression is shown in red and low expression in blue. f) Pearson correlation between averaged normalized miRNA expression levels in sEV-p100 and sEV-SEC. Expression levels were first normalized to average ct of each sample. g) Motifs found overrepresented in sEV-SEC enriched-miRNAs compared to cellular-enriched miRNAs.
Extended Data Figure 7.
Additional information about mutations in miR-431-5p, miR-140-3p and miR-677-5p. a) Table depicting the name and sequence of the CELLmotif AGAAC incorporated in miR-431-5p. Bold underlying text in the sequence indicated changed nucleotides in the guide strand of the miRNA used to introduce the CELLmotif AGAAC. Nucleotides in the passenger strand were also modified to maintain miRNA structure. b) Predicted structure for the hairpin miRNA for the constructs shown in a. Red means high probability of pairing, while blue indicates low probability calculated by RNAfold WebServer software. Arrow indicates the location of the mutated nucleotides. c) Normalized gene expression for miR-431-5p wild-type in cells and sEV for each cell type. Average Ct from the whole miRNA profile was used for normalization for each sample. d) Table depicting the name and sequence of the wild-type miR-140-3p and mutated version without CELLmotif AGAAC. Bold underlying text in the sequence indicated changed nucleotides in the guide strand of the miRNA used to remove the CELLmotif AGAAC. Nucleotides in the passenger strand were also modified to maintain miRNA structure. e) Predicted structure for the hairpin miRNA for the constructs shown in d. Red means high probability of pairing, while blue indicates low probability. Arrow indicates the location of the mutated nucleotides. f) Normalized gene expression for miR-140-3p wild-type in cells and sEV for each cell type. Average Ct from the whole miRNA profile was used for normalization for each sample. g) Table showing the name and sequence of the wild-type miR-677-5p and the version in which CELLmotifs were mutated. Bold underlined text in the sequence indicated mutated nucleotides in the guide strand of the miRNA to remove CELLmotifs CAGU and AUU[A/G]. Nucleotides in the passenger strand were also modified accordingly to maintain miRNA structure. h) Predicted structure for the hairpin miRNA for the constructs shown in g. Red means high probability of pairing while blue indicates low probability. Arrows indicate the location of the mutated nucleotides. i) Normalized gene expression for miR-677-5p wild-type in cells and exosomes for each cell type. Average Ct from the whole miRNA profile was used for normalization for each sample. Data are expressed as mean ± SEM. n=3–4. *P≤0.05 (Limma t-test).
Extended Data Figure 8.
Additional information about mutations in miR-34c. a) Table depicting the name and sequence of the different EXOmotifs introduced in miR-34c-5p. Bold underlying text in the sequence indicates changed nucleotides in the guide strand of the miRNA. Nucleotides in the passenger strand were also modified accordingly to maintain miRNA structure. b) Predicted structure for the hairpin miRNA for each of the constructs shown in a. Red means high probability of pairing while blue indicates low probability calculated by RNAfold WebServer software. Arrows indicate the location of the mutated nucleotides. c) Normalized expression for miR-34c-5p wild-type in cells and sEV for each cell type. Average Ct from the whole miRNA profile was used for normalization for each sample. *P≤0.05 (Limma t-test). d) To visualize the changes in the sEV and cell content of each miRNA construct before sEV enrichment calculation, normalized expression of miR-34c wild-type (WT) or its EXOmotif-containing versions miR-34-UGUGU, miR-34-CAUG and miR-34-CGGGAG are displayed for the cells overexpressing each of the miR-34c versions. miR-138-5p was used to normalize expression in sEV versus cells as we previously showed that the levels of this miRNA are equivalent in both compartments.*P≤0.05 (Mann-Whitney U test comparing sEV and cell expression for the same miRNA version, i.e. red versus blue bars). e) Absolute copy number of the miRNAs displayed in the x-axis overexpressed in brown adipocytes were quantified in sEV isolated by ultracentrifugation followed by size exclusion chromatography and normalized by the miRNA copy number in all producing cells for each sample. f) sEV enrichment calculated as the ratio of sEV expression divided by cellular expression for each of the constructs expressed in and secreted from AML12 hepatocytes. g) sEV enrichment calculated as the ratio of sEV expression divided by cellular expression for each of the constructs expressed in and secreted from SVEC endothelial cells. In both panels e and f, the dashed line separates preferential sEV enrichment (above line) versus preferential cellular enrichment (below line). Expression was normalized to the expression of miR-501-5p, which is to be equally abundant in sEV and cells for each cell type. Data are expressed as mean ± SEM. n=3, *P≤0.05, Kruskal-Wallis followed by Mann-Whitney U tests.
Extended Data Figure 9.
Additional information about mutations in miR-26a. a) Table depicting the name and sequence of the different EXOmotifs introduced in miR-26a-5p. Bold underlying text in the sequence indicates changed nucleotide/s in the guide strand of the miRNA. Nucleotides in the passenger strand were also modified accordingly to maintain miRNA structure. b) Predicted structure for the hairpin miRNA for each of the constructs shown in a. Red means high probability of pairing while blue indicates low probability calculated by RNAfold WebServer software. Arrows indicate the location of the mutated nucleotide/s. c) Normalized expression for miR-26a-5p wild-type in cells and sEV for each cell type. Average Ct from the whole miRNA profile was used for normalization for each sample. *P≤0.05 (Limma t-test). d) sEV enrichment calculated as the ratio of sEV expression divided by cellular expression for each of the constructs expressed in and secreted from SVEC endothelial cells. The dashed line separates preferential sEV enrichment (above line) versus preferential cellular enrichment (below line). Expression was normalized to the expression of miR-501-5p. *P≤0.05 (Kruskal-Wallis followed by Mann-Whitney U test), n=3–4.
Extended Data Figure 10.
Further information miRNA pulldown and direct transfection of AML12 cells. a) Analyses for Molecular Function (left) and Cellular Component Gene Ontology (right) of the 67 proteins identified in the proteomic study. b) Table showing average values for relative binding enrichment of the proteins listed in the first column to the miRNA constructs shown in the top row. The columns 2–5 refer to miR-34c and its CGGGAG-containing version, while columns 6–8 refer to miR-26a and its CGGGAG-containing version. In both cases, binding to wild-type miRNAs was set as 1, and the binding of the other miRNA constructs (scramble and CGGGAG-containing version) was normalized respect to that. Only those proteins showing a log2 Fold Enrichment of CGGGAG-containing miRNA version versus wild-type miRNA >3 (>8 fold) were included. c) Brown adipocytes overexpressing wild type miR-34c (OE-miR-34c-5p-WT) or CGGGAG-containing miR-34c (OE-miR-34c-5p-CGGGAG) were transfected with either control siRNA (grey bars), Alyref siRNA (red bars) or Fus siRNA (green bars) and analyzed for knockdown efficiency by qPCR (left) and immunoblotting (right). *P≤0.05 (Kruskal-Wallis followed by Mann-Whitney U test), n=3. d) EXOmotif-containing miR-34c versions have the same efficiency in reducing target gene expression than wild-type miR-34c. AML12 hepatocytes were directly transfected with mimic miR-34c wild-type or its mutant versions miR-34-UGUGU, miR-34-CAUG and miR-34-CGGGAG or non-targeting miRNA (control) for 24 hours and expression of predicted and experimentally-validated miR-34c target genes were analyzed. TATA-box binding protein (Tbp) was used as housekeeping gene. n=6. *P≤0.05, ***P≤0.001 (ANOVA followed by Bonferroni post-hoc test). Data are expressed as mean ± SEM.
Figure 1.
Figure 1.
Cell type-specific miRNAs in sEV and cells, and selectivity of sEV versus cellular distribution of certain miRNAs. a) The experimental setup and cell lines used in this study. b) Principal Component Analysis (PCA) showing cellular (triangles) and sEV (circles) miRNA profiles for each cell type (n=3–4). c) Venn diagram showing the number of miRNAs with specific expression in cell bodies of each cell type. The number in the center refers to those miRNAs with no specific expression in the cell body of any of the five cell lines studied. d) Venn diagram for miRNAs with specific expression in the sEV of each cell type. e) Heatmap showing the abundance of the indicated miRNAs in sEV and cell bodies for each cell type studied. High expression based on normalized Ct is shown in red and low expression in blue. f) Waterfall diagram showing sEV enrichment for all expressed miRNAs in brown adipocytes as log2 fold difference for relative abundance in sEV versus relative abundance for the same miRNA in cell body. The dashed lines indicate a four-fold difference. g) Table indicating the number of miRNAs showing significant cellular- or sEV-enrichment (FDR<0.1) or no enrichment for each cell type. The last column indicates the percentage of miRNAs with a selective distribution as the ratio between the sum of sEV and cellular enriched miRNAs divided by the total number of measured miRNAs. h) Venn diagram indicating the number of miRNAs significantly enriched in the cell bodies compared to their respective sEV for the indicated cell-types and the different combinations among them. i) Venn diagram indicating the number of miRNAs significantly enriched in the sEV compared to their respective cell body of each cell type and their combinations.
Figure 2.
Figure 2.
Motifs over-represented in miRNAs preferentially sorted into sEV/exosomes (EXOmotifs) or cell retained (CELLmotifs) for each cell type. a) Table showing the sEV/exosomal motifs (EXOmotifs) identified for each cell type in their extended version (left) and core version (right). For each motif, the P-value, false discovery rate (FDR), the percentage of miRNAs significantly enriched in exosomes/sEV that contain the motif, the percentage of miRNAs not enriched in exosomes/sEV containing the motif (background) and the fold-enrichment as the ratio between the previous two columns are displayed. b) Table showing the cell retention-associated motifs (CELLmotifs) identified for each cell type in their extended version (left) and core version (right). Calculated are as in panel a.
Figure 3.
Figure 3.
CELLmotifs and EXOmotifs regulate miRNA distribution. Alyref and Fus participate in sorting of miRNAs containing CNGGNG-EXOmotif. a) Experimental setup for interrogating motif functionality. b) sEV enrichment calculated as the ratio of sEV expression divided by cellular expression in AML12 hepatocytes for either miR-431-5p wild-type (miR-431-5p-WT) or its version containing the CELLmotif AGAAC (miR-431-5p-AGAAC). c) The same motif AGAAC was removed from miR-140-3p (miR-140-3p NO AGAAC) in brown adipocytes and the sEV enrichment was calculated for it as for the wild-type version (miR-140-3p-WT). d) Core-CELLmotifs CAGU and AUU[A/G] were removed from miR-677-5p (miR-677-5p-NO CELLmotifs) in AML12 hepatocytes and its sEV enrichment was calculated as for the wild-type version (miR-677-5p-WT). e) sEV enrichment for wild-type miR-34c-5p (miR-34c-WT) or the miR-34c versions containing UGUGU, CAUG or CGGGAG EXOmotifs expressed in brown adipocytes (BAT). f) sEV enrichment for wild-type miR-26a-5p and its versions containing EXOmotifs CAUG and CGGGAG expressed in BAT. g) Experimental setup for the miRNA pulldown experiments. h and i) Proteins displaying at least 8-fold better (log2 > 3) binding to the EXOmotif-containing version relative to its wild-type counterpart. h) Binding to miR-34c-WT was set as 1, and the binding to scrambled miRNA and miR-34c-CGGGAG were calculated relative to miR-34c-WT (n=3). i) Similar to h, but relative to miR-26a-WT (n=3). *P≤0.05 Motif-containing vs WT miRNA (paired T-test with Storey’s method for group-wise correction). j) sEV enrichment for miR-34c-WT and miR-34c-CGGGAG in BAT treated with Alyref, Fus or non-targeting control siRNAs. In panels b-f and j, the dashed line separates sEV enrichment (above line) versus cellular enrichment (below line). The data are from 3–4 independent experiments, i.e., biological replicates, with each replicate being the average of duplicate/triplicate qPCR reactions. Expression was normalized to miR-138-5p. Data are expressed as mean ± SEM, *P≤0.05 (Kruskal-Wallis followed by Mann-Whitney-U test).
Figure 4.
Figure 4.
Incorporation of EXOmotifs enhances miRNA delivery and target inhibition. a) Diagram illustrating the transwell experiment. b) miRNA expression for endogenous basal miR-34c (grey bar), induced wild-type miR-34c over the basal (blue), miR-34c-CAUG (green) and miR-34c-CGGGAG (red) in the donor cells and expressed as the number of copies of each miRNA per 103 copies of miR-103-3p as an endogenous control. c) miRNA expression for basal miR-34c (grey bar), induced wild-type miR-34c over the basal (blue), miR-34c-CAUG (green) and miR-34c-CGGGAG (red) in the recipient cells after co-incubation with the donor cells overexpressing these miRNAs respectively, as indicated in the x-axis and normalized per 103 copies of miR-103-3p. d) Average number of copies of each miRNA induced in the donor cells above the levels measured in control Scr cells (second column) and the number of copies in the recipient cells over the levels in cells cocultured with the O/E-Scr donors (third column). Values are normalized per 103 copies of miR-103-3p. The last column represents the ratio between the second and third columns. e) Change in gene expression for miR-34c targets in the recipient cells induced by the coculture with miR-34c-WT, miR-34c-CAUG or miR-34c-CGGGAG donor cells as indicated in the x-axis and relative to recipient cells co-incubated with O/E-Scr donors. n=3; Data are expressed as mean ± SEM. *P≤0.05 motif-containing vs WT-miR-34c for each gene (Kruskal-Wallis followed by Mann-Whitney-U test). f) Proposed model for the sEV/exosomal sorting and cellular retention of miRNAs mediated by the cell-specific repertoire of EXO- and CELLmotifs. In this, “reader” proteins (i.e., Alyref and Fus for motif CGGGAG) recognize the miRNA motifs that promote sorting of EXOmotif-harboring miRNAs into exosomes/multivesicular bodies (MVB) or cellular retention (CELLmotif). The released exosomes then deliver their miRNA cargo to nearby or distal cells leading to changes in gene expression and cellular function.

Comment in

References

    1. Thomou T et al. Adipose-derived circulating miRNAs regulate gene expression in other tissues. Nature 542, 450–455, doi:10.1038/nature21365 (2017). - DOI - PMC - PubMed
    1. Valadi H et al. Exosome-mediated transfer of mRNAs and microRNAs is a novel mechanism of genetic exchange between cells. Nat.Cell Biol 9, 654–659 (2007). - PubMed
    1. Skog J et al. Glioblastoma microvesicles transport RNA and proteins that promote tumour growth and provide diagnostic biomarkers. Nat.Cell Biol 10, 1470–1476 (2008). - PMC - PubMed
    1. Mori MA, Ludwig RG, Garcia-Martin R, Brandao BB & Kahn CR Extracellular miRNAs: From Biomarkers to Mediators of Physiology and Disease. Cell Metab 30, 656–673, doi:10.1016/j.cmet.2019.07.011 (2019). - DOI - PMC - PubMed
    1. Tosar JP et al. Assessment of small RNA sorting into different extracellular fractions revealed by high-throughput sequencing of breast cell lines. Nucleic Acids Res 43, 5601–5616, doi:10.1093/nar/gkv432 (2015). - DOI - PMC - PubMed

Methods References

    1. Fasshauer M et al. Essential role of insulin receptor substrate-2 in insulin stimulation of Glut4 translocation and glucose uptake in brown adipocytes. J Biol Chem 275, 25494–25501, doi: 10.1074/jbc.M004046200 (2000). - DOI - PubMed
    1. Thery C, Amigorena S, Raposo G & Clayton A Isolation and characterization of exosomes from cell culture supernatants and biological fluids. Curr Protoc Cell Biol Chapter 3, Unit 3 22, doi:10.1002/0471143030.cb0322s30 (2006). - DOI - PubMed
    1. Peltier HJ & Latham GJ Normalization of microRNA expression levels in quantitative RT-PCR assays: identification of suitable reference RNA targets in normal and cancerous human solid tissues. RNA 14, 844–852, doi:10.1261/rna.939908 (2008). - DOI - PMC - PubMed
    1. Collins BC et al. Multi-laboratory assessment of reproducibility, qualitative and quantitative performance of SWATH-mass spectrometry. Nat Commun 8, 291, doi:10.1038/s41467-017-00249-5 (2017). - DOI - PMC - PubMed
    1. Schilling B, Gibson BW & Hunter CL Generation of High-Quality SWATH((R)) Acquisition Data for Label-free Quantitative Proteomics Studies Using TripleTOF((R)) Mass Spectrometers. Methods Mol Biol 1550, 223–233, doi:10.1007/978-1-4939-6747-6_16 (2017). - DOI - PMC - PubMed

Publication types