. 2022 Jan;601(7893):460-464.
doi: 10.1038/s41586-021-04252-1. Epub 2021 Dec 22.

Structure of Hsp90-Hsp70-Hop-GR reveals the Hsp90 client-loading mechanism

Affiliations

Structure of Hsp90-Hsp70-Hop-GR reveals the Hsp90 client-loading mechanism

Ray Yu-Ruei Wang et al. Nature. 2022 Jan.

Abstract

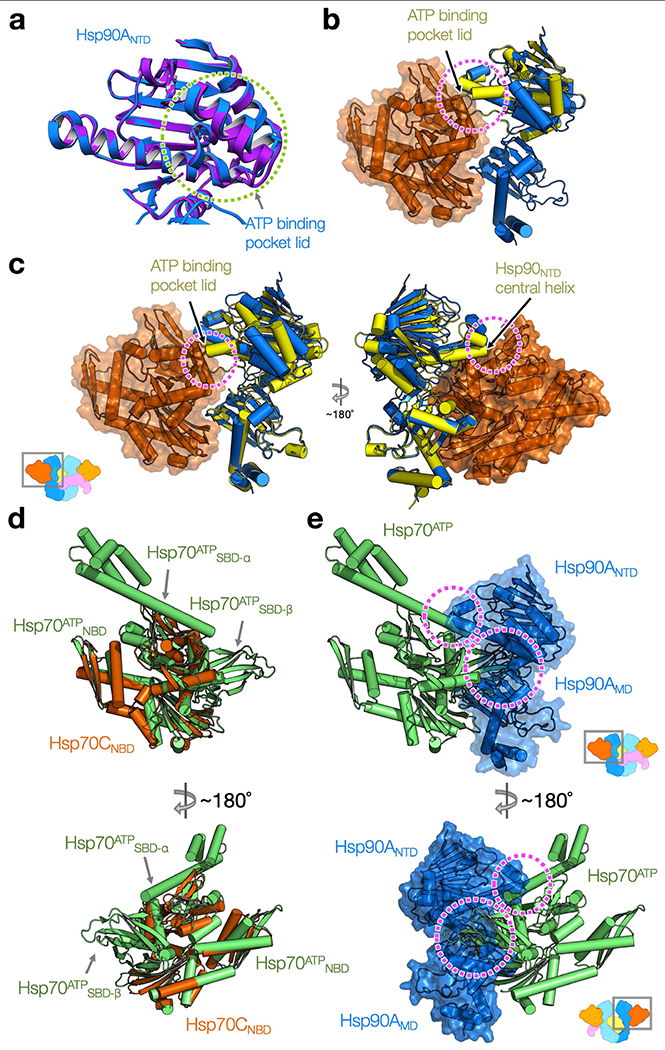
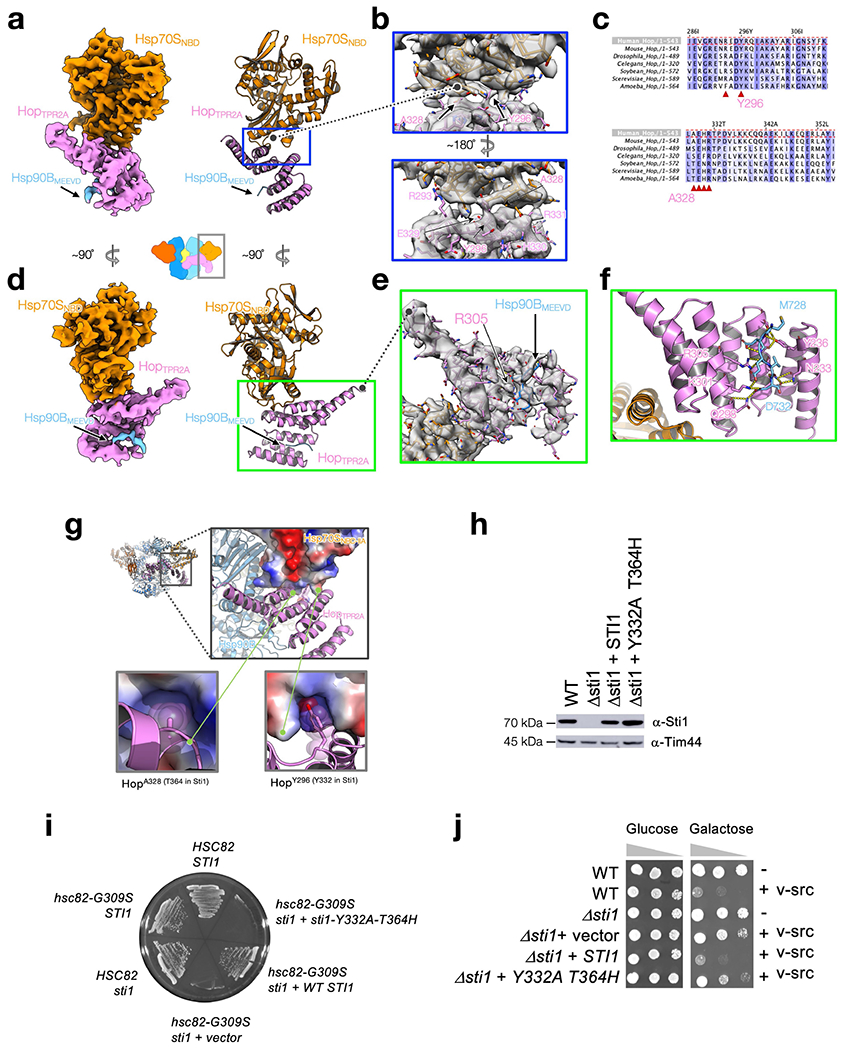
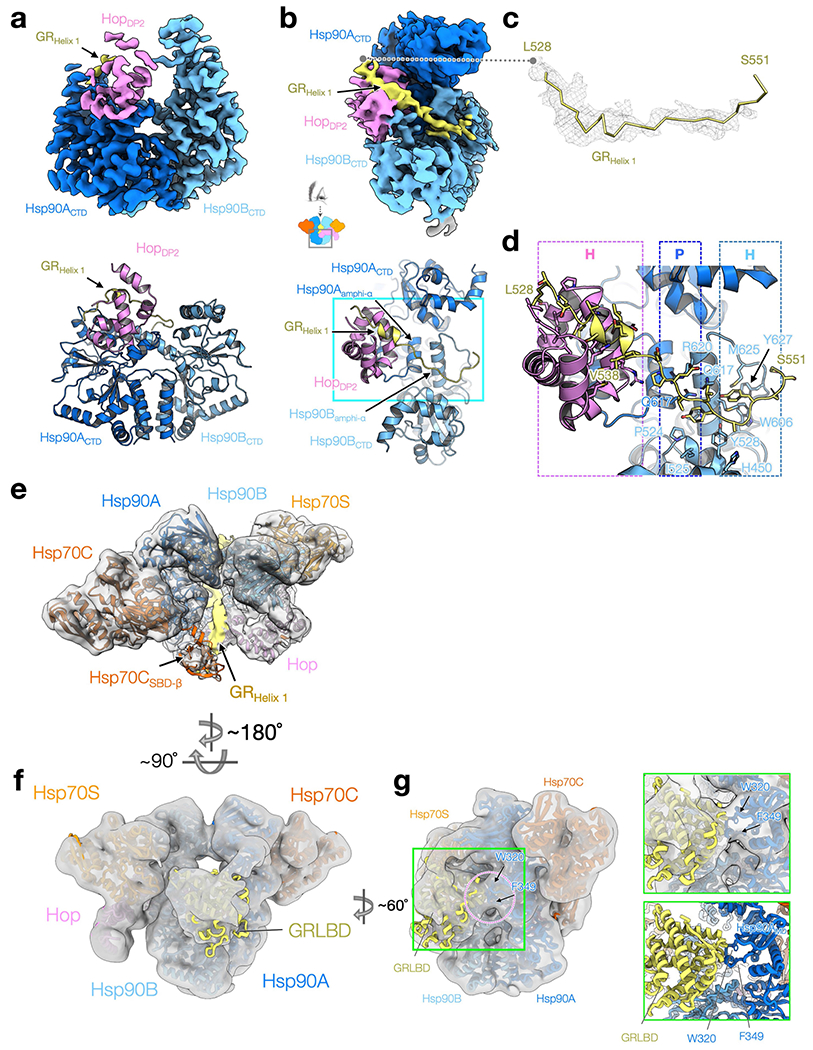
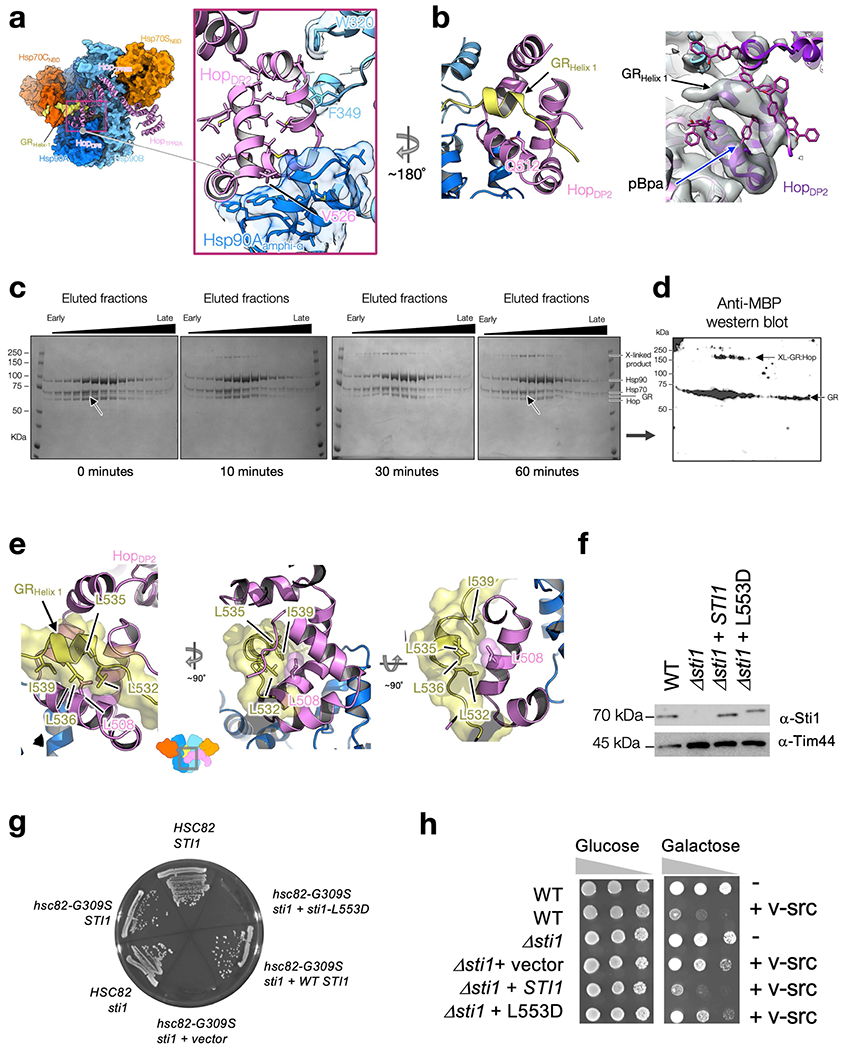
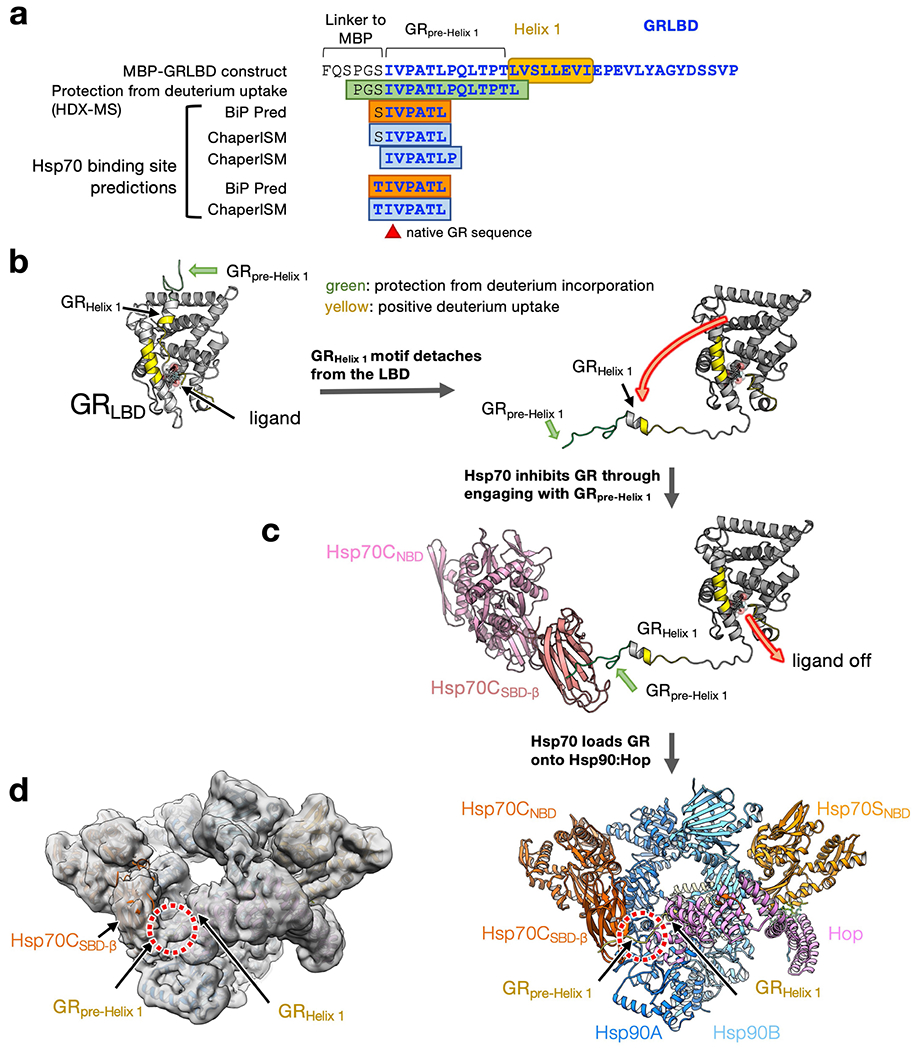
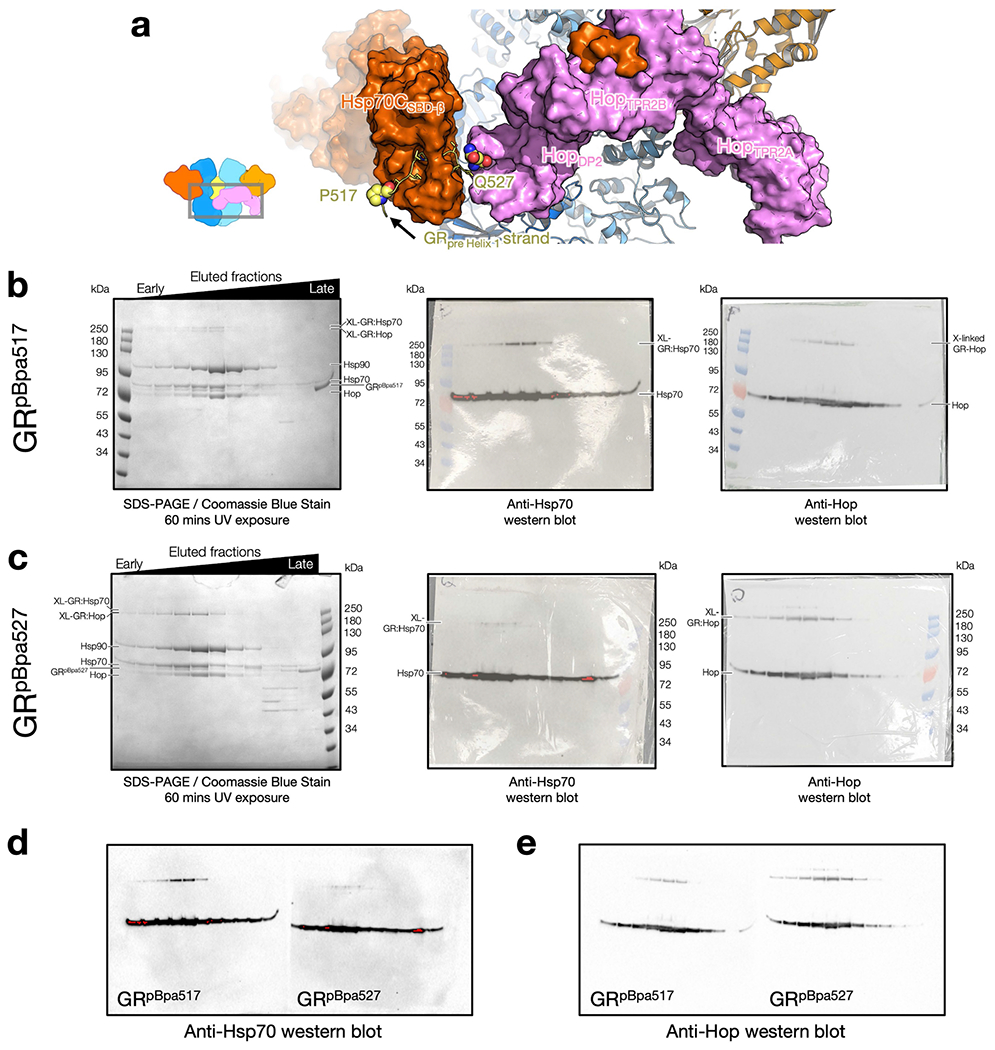
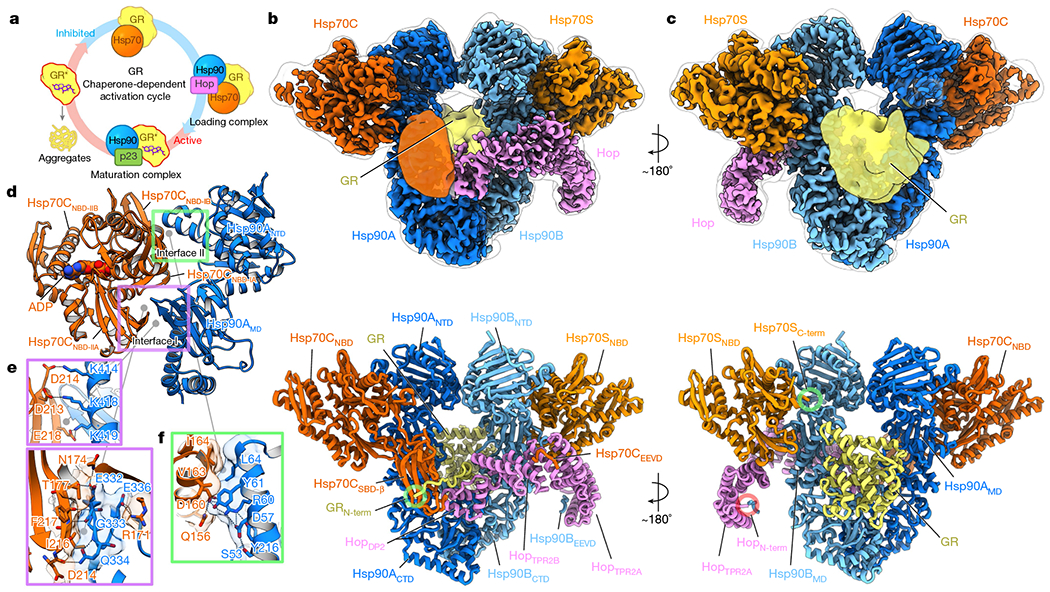
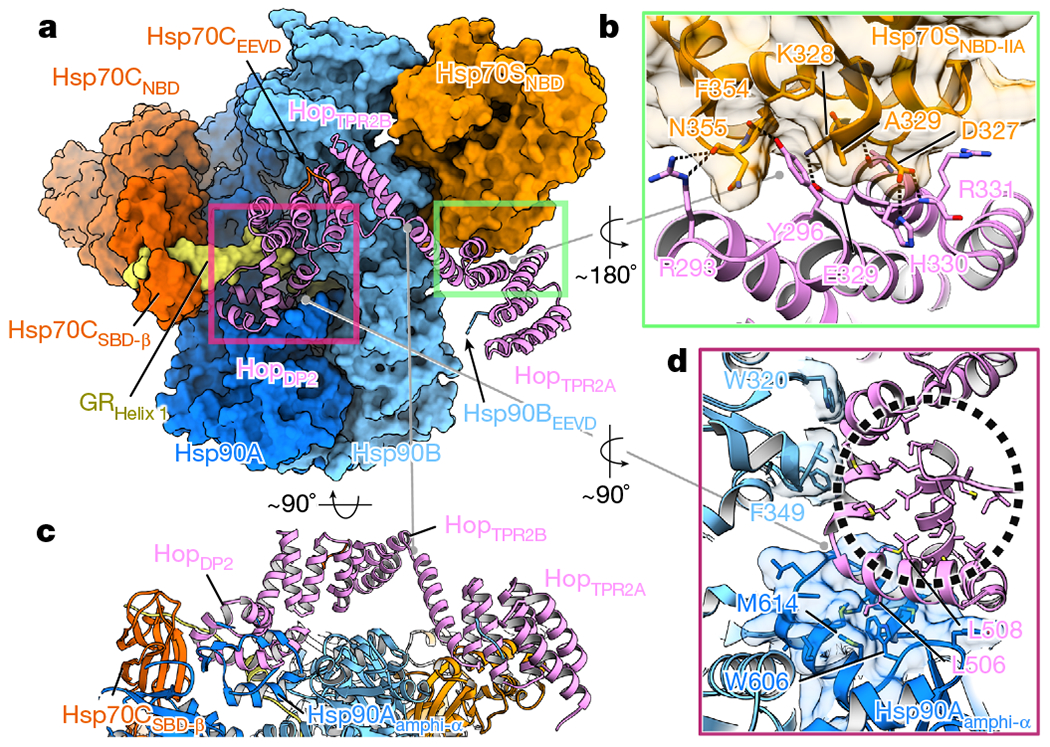
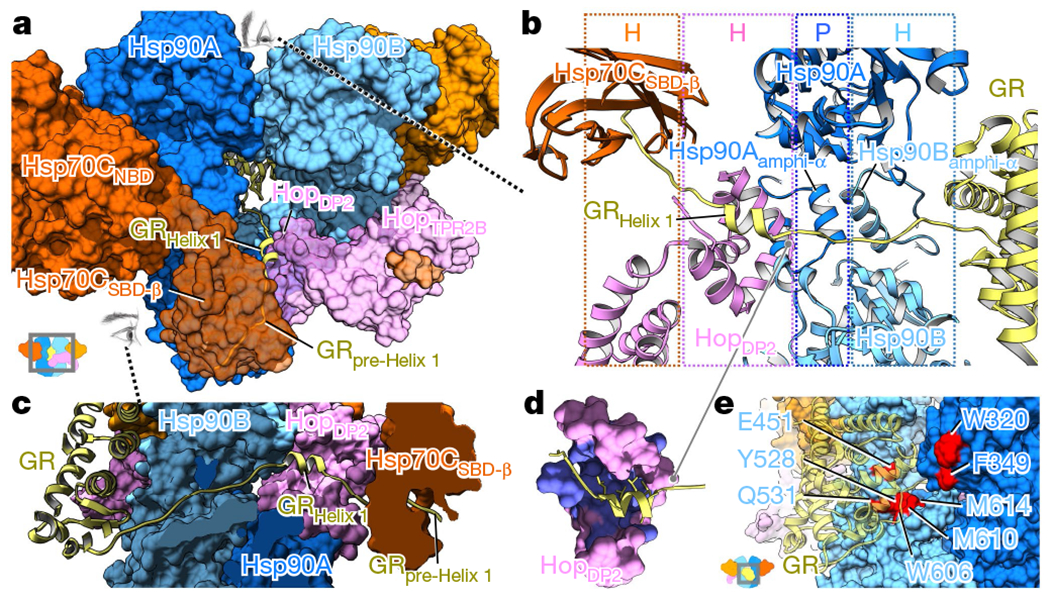
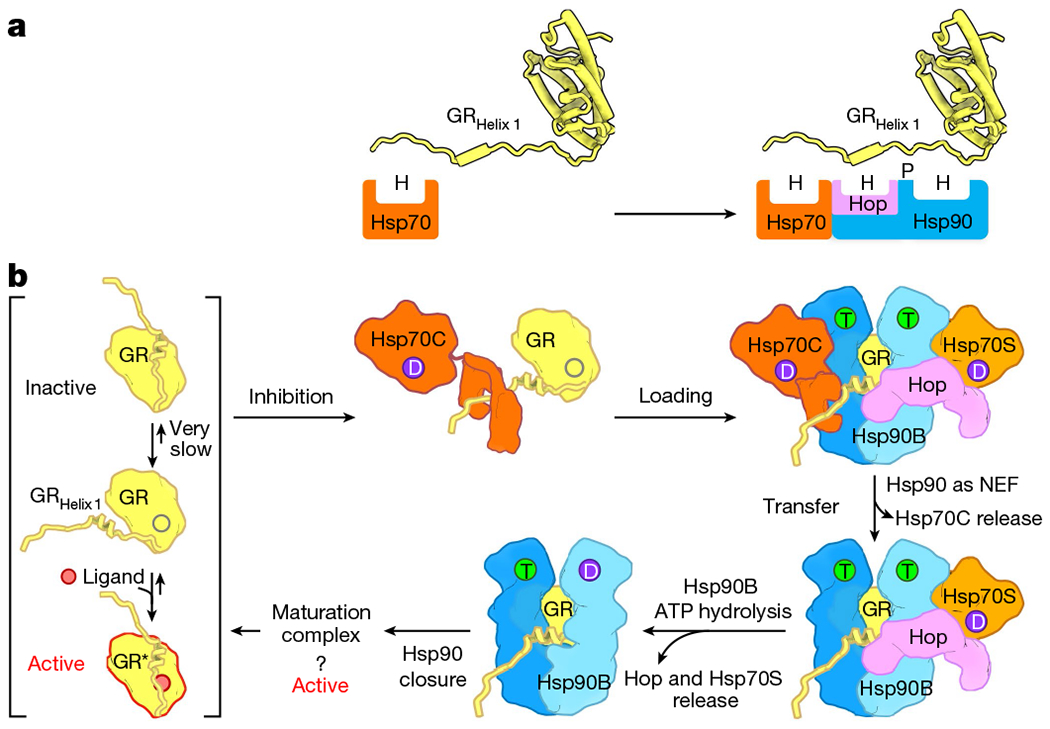
Maintaining a healthy proteome is fundamental for the survival of all organisms1. Integral to this are Hsp90 and Hsp70, molecular chaperones that together facilitate the folding, remodelling and maturation of the many 'client proteins' of Hsp902. The glucocorticoid receptor (GR) is a model client protein that is strictly dependent on Hsp90 and Hsp70 for activity3-7. Chaperoning GR involves a cycle of inactivation by Hsp70; formation of an inactive GR-Hsp90-Hsp70-Hop 'loading' complex; conversion to an active GR-Hsp90-p23 'maturation' complex; and subsequent GR release8. However, to our knowledge, a molecular understanding of this intricate chaperone cycle is lacking for any client protein. Here we report the cryo-electron microscopy structure of the GR-loading complex, in which Hsp70 loads GR onto Hsp90, uncovering the molecular basis of direct coordination by Hsp90 and Hsp70. The structure reveals two Hsp70 proteins, one of which delivers GR and the other scaffolds the Hop cochaperone. Hop interacts with all components of the complex, including GR, and poises Hsp90 for subsequent ATP hydrolysis. GR is partially unfolded and recognized through an extended binding pocket composed of Hsp90, Hsp70 and Hop, revealing the mechanism of GR loading and inactivation. Together with the GR-maturation complex structure9, we present a complete molecular mechanism of chaperone-dependent client remodelling, and establish general principles of client recognition, inhibition, transfer and activation.


Conflict of interest statement

Competing interests The authors declare no competing interests.

Figures

Extended Data Fig. 1 |
Extended Data Fig. 1 |. Purification of the GR-loading complex and the cryo-EM single-particle image processing pipeline.
a, Domain organization of the chaperone proteins in the GR-loading complex. b, Top, elution profile of gel filtration using SEC-MALS to confirm the homogeneity of the GR-loading complex. The apparent molecular weight of the eluent estimated by SEC-MALS is ~370 kDa, although the two-Hsp70 client-loading complex is ~440 kDa. The discrepancy may be a result of multiple species co-eluted. Bottom, SDS–PAGE stained with Coomassie blue of the eluted fractions marked in (top). c, SDS–PAGE stained with Coomassie blue of the fractions treated with 0.02% (w/v) glutaraldehyde cross-linking for 20 min at room temperature, followed by quenching with 20 mM Tris buffer at pH 7.5. Data in (b-c) are representative data of at least two independent experiments. d, Initial model generation for the GR-loading complex. The 60 Å low-pass filtered initial model used to reconstruct the 3D model was adopted from the Hsp90 semi-open conformation structure from the Hsp90:Hop cryo-EM structure. e, Schematic workflow of the global cryo-EM map reconstruction. Yellow boxes indicate the selected class to move forward. Blue box indicates one-Hsp70 loading complex. Purple box indicates the final high-resolution global reconstruction. f, Flow chart of focused classification/refinement using the signal subtraction approach from RELION. Final reconstructions for individual masked classifications/refinements were selected based on the resolution intercepted with the FSC 0.143 from 3D auto-refine. K=number of classes; T=regularization factor, Tau.
Extended Data Fig. 2 |
Extended Data Fig. 2 |. Resolution estimates for cryo-EM reconstructions, atomic B-factor refinement and model-map FSC.
a, Local resolution estimates for the GR-loading complex global reconstruction were calculated using RELION with front view (left) and back view (right). b, Euler angle distribution in the final reconstruction. Orthogonal views of the reconstruction are shown with front view (top) and side view (bottom) c, Gold-standard FSC for the global cryo-EM reconstruction. d, Atomic model with B-factors refined with colour key shown on the left. e, Histogram of the B-factor values of all non-hydrogen atoms in the atomic model, coloured by the same colour key in d. f, Model-map FSC. g, Focused classification and refinement of the GR-loading complex. Masks were created at various regions of the GR-loading complex (left) and its corresponding gold-standard FSC (right) after 3D auto-refine. The nominal resolution for each reconstruction is labelled and indicated in the FSC plots.
Extended Data Fig. 3 |
Extended Data Fig. 3 |. The Hsp90 in both two-Hsp70 and one-Hsp70 GR-loading complexes adopts a semi-closed conformation.
a, Close-up view of the novel dimerization interface of the symmetric Hsp90 dimer with residues at the interface in transparent surface representation. The interface is composed of two molecular switches of Hsp90, the first helix and the lid motif. b, c, The Hsp90 in the loading complex (b) is one step away from the fully closed ATP state (c). Front (left) and side (right) views of the Hsp90 in the two-Hsp90 GR-loading complex (b) and the Hsp90 in the GR-maturation complex (c). Arrows indicate displacements from the Hsp90 in the loading state, in which a large twisting motion is apparent from the side view. d, Comparison of cryo-EM reconstructions of the one-Hsp70 and two-Hsp70 GR-loading complexes. Schematic model of the two-Hsp70 loading complex (left). Front views of cryo-EM maps of the two-Hsp70 (middle; grey colour) and one-Hsp70 (right; salmon colour) GR-loading complexes. Right, the one-Hsp70 reconstruction has lost density for Hsp70CNBD (dashed circle) and Hsp70CSBD-α (red arrows); however, density for GRpre-Helix 1 and GRHelix 1 (black arrows) is in the same location as it is in the two-Hsp70 GR-loading complex. e, Rigid-body fitting of the two Hsp90 protomers individually in the one-or two-Hsp70 loading complexes cryo-EM reconstructions shows both of the Hsp90s share a similar semi-closed conformation. The Hsp90 in the one-Hsp70 loading complex (middle panel) has a slightly wider opening angle (right panel) than the Hsp90 in the two-Hsp70 loading complex (left panel). f, The lumen of the semi-closed Hsp90 presented in the loading complex can fit a helix. A helix (magenta) can be accommodated in the semi-closed Hsp90. Front view (left) and top view (right).
Extended Data Fig. 4 |
Extended Data Fig. 4 |. Interfaces I and II are both crucial for Hsp90–Hsp70 interactions and client activation.
a, b, The Hsp70 cleft (dashed circles), formed by Hsp70NBD-IA and Hsp70NBD-IIA (a), which Hsp90MD interacts with, is used by the Hsp70 interdomain linker in the Hsp70 ATP state and Hsp40’s J-domain (b). Hsp90A:Hsp70C in the loading complex are shown as cartoon (a, left) and surface (a, right) representation. The E. coli Hsp70 (eHsp70):J-protein complex in the ATP state (PDB ID: 5NRO) are shown as cartoon (b, left) and surface (b, right) representation. The two subdomains of eHsp70 are coloured in green for eHsp70ATPNBD and in pink for eHsp70ATPSBD. The E.coliHsp40J-domain (eHsp40J-domain) is coloured in purple. c, d, Mapping Hsp90/Hsp70 residues previously characterized by the Wickner group on the loading complex. Five yeast Hsp90 (Hsp82P281,G313,K394,K398,K399) and four yeast Hsp70 (ssa1R169,N172,E210,T219) mutations previously characterized by the Wickner group, are all located at Interface I. These ‘Wickner residues’ are shown with stick and transparent sphere representation, whereas residues that interact with the Wickner residues are shown with only stick representation. Polar interactions are highlighted with green dashed lines. Residue numbers of the Wickner residues in yeast Hsp90/Hsp70 are shown as the labels within parentheses. Based on the proximity of the Wickner residue positions to Interface I residues, our structure can readily explain why Hsp82P281C (P301, Hsp90) and Ssa1T219C(T222, Hsp70) (d) showed no effect, whereas the other four Hsp90 mutants (Hsp82G313S(G333, Hsp90), Hsp82K394C(K414,Hsp90), Hsp82K398E(K418,Hsp90), Hsp82K399C(K419, Hsp90)) and the other three Hsp70 mutants (Ssa1N172D(N174, Hsp70), Ssa1R169H(R171, Hsp70), Ssa1E210R(D213, Hsp70)) (c) disrupted Hsp90:Hsp70 interaction significantly. eh, In vivo validation of Interface I and II of the Hsp90:Hsp70 interactions in the GR-loading complex. Mapping the positions of the three mutations (arrows and yellow surface representation in e) used for in vivo validation on the atomic structure of Hsp90:Hsp70 (dark blue:dark orange; surface representation in e) in the GR-loading complex. The Interface I residues used, Hsp90G333 (Hsc82G309) and Hsp90K418 (Hsc82K394), are indicated by arrows (e, left panel). The Interface II residue, Hsp90R60 (Hsc82R46), is indicated by an arrow (e, right panel). Residue numbers of the residues in yeast Hsc82 are shown as the labels within parentheses in e. In f, His-Hsc82 complexes were isolated from yeast and analysed by SDS-PAGE and visualized by Coomassie staining and immunoblot analysis (see also Supplementary Fig. 10 for the uncropped gels/blots). Yeast proteins: Sti1=Hop; Ssa1/2=Hsp70; Hsc82=Hsp90β. In g, plasmids expressing wild-type or mutant Hsc82 were expressed as the sole Hsp90 in JJ816 (hsc82hsp82) cells. Growth was examined by spotting 10-fold serial dilutions of yeast cultures on rich media, followed by incubation for two days at 30 °C or 37°C. In h, strains expressing wild-type (WT) or mutant HSC82 were transformed with a multicopy plasmid expressing GAL1-v-src (pBv-src) or the control plasmid (pB656). Yeast cultures were grown overnight at 30 °C in raffinose-uracil drop-out medium until mid-log phase. Galactose (20%) was added to a final concentration of 2%. After six hours, cultures were serially diluted 10-fold onto uracil drop-out plates containing galactose. Plates were grown for 2-3 days at 30°C.
Extended Data Fig. 5 |
Extended Data Fig. 5 |. Both the Hsp90ATP and the Hsp70ATP conformations are incompatible with the GR-loading complex.
a, Overlay of the crystal structure of Apo Hsp90 fragment (purple; PDB ID: 3T0H) to the Hsp90ANTD (dark blue). Green circle highlights the open ATP pocket lid. b, Closure of the ATP pocket lid in the ATP state of Hsp90NTD (the Hsp90α structure from the GR-maturation complex is in yellow, ribbon representation) clashes (magenta circle) with the Hsp70NBD (orange, surface and ribbon representation) in the loading complex. The NTD fragment of Hsp90ATP is aligned with the Hsp90NTD in the loading complex. c, Superimposition of the ATP state of Hsp90NTD-MD fragment (yellow) to the Hsp90A (dark blue) at the MD. Magenta circles indicate steric clashes of the ATP state of the Hsp90NTD to the Hsp70NBD (orange; surface/ribbon representation). d, Superposition of the Hsp70ATP conformation (green; PDB ID: 4B9Q) to the Hsp70CNBD (dark orange). Arrows indicate the two subdomains of Hsp70ATPSBD, which cause serious steric clashes with the Hsp90 in the loading complex shown in e. e, The superimposed Hsp70ATP shown in e is fixed from d and the Hsp90 (dark blue; surface/ribbon representation) of the GR-loading complex is present. Magenta circles highlight steric clashes caused by the two subdomains of Hsp70ATPSBD (green) to the Hsp90ANTD-MD.
Extended Data Fig. 6 |
Extended Data Fig. 6 |. The Hsp70–Hop interface in the GR-loading complex is crucial for cellular functions and client maturation.
af, The atomic interactions of Hsp70SNBD:HopTRP2A:Hsp9GBMEEVD in the GR-loading complex. The cryo-EM map from focused classification and refinement is shown in (a and d, left). The atomic model with the corresponding view from (a and d, left) is shown in the right panels of (a, d). Close-up views of the Hsp70SNTD:HopTPR2A interface with the atomic model fit into the density (b). Two key residues (HopY296 and HopA328) are buried in the surface with their sidechain density indicated by the arrows (b, top and bottom). Density of the interface residues highlighted in Fig. 2b is shown in (b, bottom). Sequence alignments of Hop with key residues at the Hsp70NBD:HopTPR2A interface highlighted by the red triangles in (c), in which the colour scheme is BLOSUM62. Close-up view of the atomic model of HopTPR2A:Hsp90BMEEVD fit with the cryo-EM map is shown in (e). Close-up view of the atomic interactions of the MEEVD fragment from Hsp90B (light blue) and HopTPR2A (pink) from e is shown in f, in which polar interactions are depicted with dashed lines. gj, In vivo validation of the Hsp70SNBD:HopTPR2A interface in the loading complex. The two buried residues in Hsp70SNBD-IIA:HopTPR2A interface, which were chosen for the mutational studies, are shown in g. Components of the GR-loading complex (g, top left) are coloured as in other figures and as labelled. Hsp70SNBD is shown in surface-charge representation (blue: positive; red: negative) calculated using PyMOL. Note that the corresponding residue numbering of the two positions in yeast Hop (Sti1) are shown in parentheses of the labels of the bottom panels in g. In h, Sti1Y332A-T364H accumulates at levels similar to WT Sti1 (see also Supplementary Fig. 10 for the uncropped gels/blots); data in h are representative of two independent experiments. Extracts from WT cells (JJ762), sti1 cells (JJ623), or sti1 cells transformed with a plasmid that expresses WT Sti1 or Sti1Y332A-T364H were analysed by SDS–PAGE and immunoblotted with a polyclonal antisera specific for Stil. Loading control is antibody against mitochondrial protein Tim44. In i, sti1-Y332A-T364H is inviable in hsc82hsp82 cells expressing hsc82-G309S. hsc82hsp82 (JJ117) or sti1hsc82hsp82 (JJ1443) strains harbouring YEp24-HSP82 were transformed with plasmids expressing WT HSC82 or hsc82-G309S. Strains that lacked STI1 were also transformed with an empty plasmid or a plasmid expressing WT STI1 or sti1-Y332A-T364H. Transformants were grown in the presence of 5-FOA for 3 days to counter-select for the YEp24-HSP82 plasmid. STI1 is essential under these conditions and the growth of cells expressing sti1-Y332A-T364H was indistinguishable from those expressing the empty plasmid. In j, WT cells, sti1 cells or sti1 cells transformed with a plasmid that expresses WT Sti1 or Sti1-Y332A-T364H were transformed with an empty plasmid or a plasmid that expresses GAL-v-src. v-src induction in the presence of galactose sharply reduces the growth of WT cells, but not cells lacking STI1. The growth of cells expressing sti1-Y332A-T364H was very similar to those expressing the empty plasmid, indicating that sti1-Y332A-T364H is unable to support v-src function. The growth of cells in the presence of glucose was indistinguishable. 10-fold serial dilutions of cultures were grown for 3 days in the presence of galactose or glucose.
Extended Data Fig. 7 |
Extended Data Fig. 7 |. The cryo-EM density and atomic model of GRHelix 1 motif interacting with Hsp90 and HopDP2.
a, The focused map of the Hsp90ABCTD:Hsp70CSBD-β:HopDP2:GRHelix1 (top) and the atomic model shown in ribbon representation (bottom). b, The top view of the reconstruction and model shown in a. c, The density (mesh) for the GRHelix 1 motif (residues 528-551) gripped by Hsp90 and HopDP2. d, The atomic interactions of the GRHelix 1 motif with Hsp90 and HopDP2 corresponding to b, cyan box in bottom). Residues in contact with the GR motif are shown in stick representation. The types of molecular interaction Hsp90 and HopDP2 provide are indicated at the top; H and P denote hydrophobic and polar interactions, respectively. e, The 7Å low-pass filtered cryo-EM map shows that the lumen density (yellow shade) of GR connects to the globular part of GR on the other side of Hsp90. f, Docking of the GRLBD to the 10Å low-pass filtered map shows that the low-resolution GR density can fit the rest of the GRLBD. g, The low-pass filtered map shows that W320 and F349 (arrows) of Hsp90A in the loading complex are in contact with GRLBD.
Extended Data Fig. 8 |
Extended Data Fig. 8 |. Validations of HopDP2 binding to GR and of the in vivo importance of the client-binding pocket in HopDP2.
ad, Using photoreactive, site-directed cross-linking to validate the HopDP2:GR interaction (a, the pink box) and (b, left). In a, HopDP2 is loosely packed and uses surface-exposed hydrophobic residues, shown in sticks, to interact with Hsp90Aamphi-α (shown in transparent surface and with hydrophobic residues in sticks) and Hsp90BW320,F349. Suggested by modelling of the photoreactive cross-linker p-benzoyl-l-phenylalanine (pBpa) on various positions of HopDP2 to search for the position which is at the closest proximity to the GRHelix1 density (b, right), the pBpa was placed at HopQ512 (b, left). The blue arrow on the right panel in b points at the selected position, Q512 (right panel, b). A time course of UV-exposed GR-loading complex analysed by SDS–PAGE and visualized by Coomassie staining (c). Whole fractions of GR-loading complex eluted from the size-exclusion column were exposed to UV using a gel imager (see also Methods). In c, arrows at 0 and 60 min indicate a reduced intensity of the GR band over the time course. Western blot of the SDS–PAGE gel after a 60 min UV exposure, using anti-MBP antibody to detect the MBP-tagged GR is shown in (d). Data in (c, d) are from one experiment. eh, HopDP2’s client-binding/transfer function is crucial for cellular functions and client maturation. HopL508 (L553 in Sti1) is located on the hydrophobic palm (Fig. 2d) of HopDP2, interacting closely with the LXXLL motif of GRHelix 1 through hydrophobic interactions (e, left, middle and right). Mutations of HopL508 completely abrogated GR function in vivo (Sti1L553A in Schmid et al. 201233), lead to growth defects (g), and failed to promote v-src maturation (h). The mutant Sti1L553D accumulates at levels similar to WT Sti1 (f); data in f are from two independent experiments (see also Supplementary Fig. 10 for the uncropped gels/blots). Extracts from WT cells (JJ762), sti1 cells (JJ623) or sti1 cells transformed with a plasmid that expresses WT Sti1 or Sti1L553D were analysed by SDS–PAGE and immunoblotted with a polyclonal antisera specific for Sti1. Loading control is antibody against mitochondrial protein Tim44. In g, sti1-L553D is inviable in hsc82hsp82 cells expressing hsc82-G309S. hsc82hsp82 (JJ117) or sti1hsc82hsp82 (JJ1443) strains harbouring YEp24-HSP82 were transformed with plasmids expressing WT HSC82or hsc82-G309S. Strains that lacked STI1 were also transformed with an empty plasmid or a plasmid expressing WT STI1 or sti1-L553D. Transformants were grown in the presence of 5-FOA for 3 days to counter-select for the YEp24-HSP82 plasmid. STI1 is essential under these conditions and the growth of cells expressing sti1-L553D was indistinguishable from those expressing the empty plasmid. In h, WT cells, sti1 cells or sti1 cells transformed with a plasmid that expresses WT Sti1 or Sti1-L553D were transformed with an empty plasmid or a plasmid that expresses GAL-v-src. v-src induction in the presence of galactose sharply reduces the growth of WT cells, but not cells lacking STI1. The growth of cells expressing sti1-L553D was very similar to those expressing the empty plasmid, indicating that sti1-L553D is unable to support v-src function. The growth of cells in the presence of glucose was indistinguishable. 10-fold serial dilutions of cultures were grown for 3 days in the presence of galactose or glucose.
Extended Data Fig. 9 |
Extended Data Fig. 9 |. Hsp70 inhibits GR by binding the pre-Helix 1 region of GR.
a, After engaging with Hsp70/Hsp40, the GRpre-Helix 1 region exhibits protection from deuterium incorporation in a HD-exchange mass spectrometry (HDX-MS) experiment. In the GRpre-Helix 1 region, there are Hsp70-binding sites predicted by two state-of-the-art algorithms (BiP Pred and ChaperISM59). b, Left, GRLBD crystal structure (PDB ID: 1M2Z) coloured by the change of deuterium uptake (HDX-MS data was retrieved from a previous study); green: protection from deuterium incorporation; yellow: positive deuterium uptake. Right, the detachment of the entire GRHelix 1 motif explains the positive deuterium uptake around the ligand-binding pocket. c, The protection from deuterium incorporation of the GRpre-Helix 1 region can be explained by the binding of Hsp70. Together b and c provide a molecular mechanism describing how Hsp70 can inhibit GR ligand binding. d, GR’s pre-Helix 1 remains bound to Hsp70CSBD-β (red circles) in the loading complex. Left, the 6Å; low-pass filtered cryo-EM map of the loading complex. Right, atomic model with ribbon presentation.
Extended Data Fig. 10 |
Extended Data Fig. 10 |. The GRpre-Helix1 strand is engaged with the client-loading Hsp70 (Hsp70C) in the GR-loading complex.
a, The photoreactive cross-linker (pBpa) was placed at two positions in the GRpre-Helix1 strand, residues before (GRP517, sphere presentation) and after (GRQ527, sphere representation) the predicted Hsp70-binding site (GR519–526, stick representation). b, c, Whole fractions of GR-loading complex eluted from the size-exclusion column were exposed to UV using a gel imager (see also Methods). As expected, at both positions, cross-links between GR and Hsp70 were formed in the GR-loading complex, indicated by high molecular weight species. Left, SDS–PAGE stained with Coomassie blue. Middle, anti-Hsp70 Western blot. Right, anti-Hop Western blot. Data from (b, c) are from one experiment. Hsp70 cross-linking efficiency was higher for the GRpBpa517position (b, middle) than for the GRpBpa527 position (c, middle). It is likely because 1) the C-terminal end of the Hsp70-bound substrate tends to be flexible in the reverse binding mode, as indicated by high atomic B-factors and missing density from previously determined Hsp70 crystal structures with a reverse peptide bound (PDB ID: 4EZZ, 4EZQ, 4EZT, and 4EZY), and 2) GR527 is closer to Hop543 than Hsp70. In addition, the two positions were able to cross-link with Hop (b, c, right), indicating it is the client-loading Hsp70 that the GRpre-Helix 1 strand cross-linked with, rather than the scaffolding Hsp70. Note that although the GR517position is not adjacent to Hop in the GR-loading complex model, we reasoned that the cross-link may be formed in the one-Hsp70 loading complex (b, right). These results demonstrate that it is the GRpre-Helix 1 strand bound to Hsp70C, supporting our structural model. d, e, Raw western blots from middle and right panels in b, c. Red pixels in the western blots shown indicate overexposure.
Fig. 1 |
Fig. 1 |. GR-loading complex and the molecular basis of Hsp90–Hsp70 interactions.
a, GR ligand binding is regulated by molecular chaperones in a constant cycle of inactivation and activation. The activated states of GR are indicated by asterisks. b, c, Front (b) and back (c) views of a composite cryo-EM map and the atomic model of the GR-loading complex. Densities of Hsp70CSBD and the globular C-terminal GR are taken from the 10 Å low-pass-filtered map of the high-resolution reconstruction of the full complex. Subunit colouring is maintained throughout. df, Hsp90–Hsp70 interactions (d) are mediated via two main interfaces (interface I, purple rectangle (e) and interface II, green rectangle (f)). Residues involved in these interactions are shown in sticks and transparent surfaces(e, f). Dominant polar interactions are depicted by dashed lines.
Fig. 2 |
Fig. 2 |. Hop interacts closely with all components in the loading complex.
a, Hop (pink ribbon) uses HopTPR2A to interact with Hsp70S (green rectangle). HopDP2 interacts with both Hsp90 protomers, Hsp70CSBD and a portion of GR (pink rectangle). The Hop TPRs also bind EEVD fragments from both Hsp90 and Hsp70. b, In the Hop–Hsp70 interface (green rectangle, a), the Hop residue Y296 inserts into a cavity on Hsp70SNBD-IIA (transparent surface). Dashed lines depict polar interactions. c, HopTPR2B is suspended above Hsp90, supported by Hsp70–HopTPR2A and Hsp90–HopDP2. d, HopDP2 uses surface-exposed hydrophobic residues to interact with Hsp90Aamphi-α (shown with transparent surface and with hydrophobic residues in sticks) and Hsp90B(W320, F349). HopDP2 is loosely packed with many hydrophobic residues exposed in the ‘palm’ (black circle) of the ‘hand’. Note that the binding of GR to HopDP2 is omitted.
Fig. 3 |
Fig. 3 |. GR is unfolded and threaded through the Hsp90 lumen, binding HopDP2 and Hsp70CSBD-β.
a, GR (ribbon model) is partially unfolded, with the N-terminal residues simultaneously gripped by Hsp70CSBD-β and HopDP2, and is threaded through the semi-closed lumen of Hsp90. The remaining GR is at the other side of the loading complex, which was modelled by docking this portion (556–777) from the GR crystal structure into the 10 Å low-pass-filtered GR density (Methods). b, Top-down view of GR recognition via an extended client-binding pocket collectively formed by Hsp70CSBD-β, HopDP2 and Hsp90A/Bamphi-αs. The N-terminal residues of GR (residues 520–551), which form a strand-helix-strand motif (yellow), are captured in the loading complex. The molecular property of each binding pocket is colour-coded and labelled on the top panel (H and P denote hydrophobic and polar interactions, respectively). c, Side view (see-through) of the GR N-terminal motif captured by the loading complex. d, The exposed hydrophobic pocket in HopDP2 (purple) binds the LXXLL motif of GRHelix1. e, Residues on Hsp90 (blue and cyan surface) previously reported to be important for GR (transparent yellow ribbon) activation are highlighted in red.
Fig. 4 |
Fig. 4 |. Model of how Hsp70 loads GR onto Hsp90.
a, The molecular principle of GR recognition at the client-loading step. H and P denote hydrophobic and polar interactions, respectively. b, Catalysis of GR ligand binding by the actions of Hsp70 and Hsp90. GR under physiological conditions is in a sparingly populated equilibrium between apo-closed (inactive) and open apo states to which ligand can bind. GRHelix 1 acts as a lid to gate and support ligand binding. Hsp70C (dark orange) in its ADP state (D) binds the GRpre-Helix 1 strand, enabling GRHelix 1 to detach and inhibit ligand binding (top middle). Facilitated by HopDP2 recognizing the GRHelix 1 LXXLL motif, Hsp70C loads GR onto Hsp90 (blue), forming the client-loading complex (top right). Although the observed structure was for an Hsp90Apo state, under physiological conditions ATP is highly abundant and would probably occupy Hsp90’s ATP-binding pockets (T). The ATP binding and NEF activity of Hsp90 facilitate the release of Hsp70C (bottom right). The energy from the ATP hydrolysis (D) on Hsp90B (light blue) is used to release Hsp70S (light orange) and Hop (bottom middle), which is followed by full closure of Hsp90 towards the GR-maturation complex.

References

    1. Kim YE, Hipp MS, Bracher A, Hayer-Hartl M & Hartl FU Molecular chaperone functions in protein folding and proteostasis. Annu. Rev. Biochem 82, 323–355 (2013). - PubMed
    1. Genest O, Wickner S & Doyle SM Hsp90 and Hsp70 chaperones: collaborators in protein remodeling. J. Biol. Chem 294, 2109–2120 (2019). - PMC - PubMed
    1. Lorenz OR et al. Modulation of the Hsp90 chaperone cycle by a stringent client protein. Mol. Cell 53, 941–953 (2014). - PubMed
    1. Picard D et al. Reduced levels of hsp90 compromise steroid receptor action in vivo. Nature 348, 166–168 (1990). - PubMed
    1. Nathan DF, Vos MH & Lindquist S In vivo functions of the Saccharomyces cerevisiae Hsp90 chaperone. Proc Natl Acad. Sci. USA 94, 12949–12956 (1997). - PMC - PubMed

Publication types

MeSH terms