. 2022 Jan;601(7893):428-433.
doi: 10.1038/s41586-021-04244-1. Epub 2021 Dec 22.

Valine tRNA levels and availability regulate complex I assembly in leukaemia

Affiliations

Valine tRNA levels and availability regulate complex I assembly in leukaemia

Palaniraja Thandapani et al. Nature. 2022 Jan.

Abstract

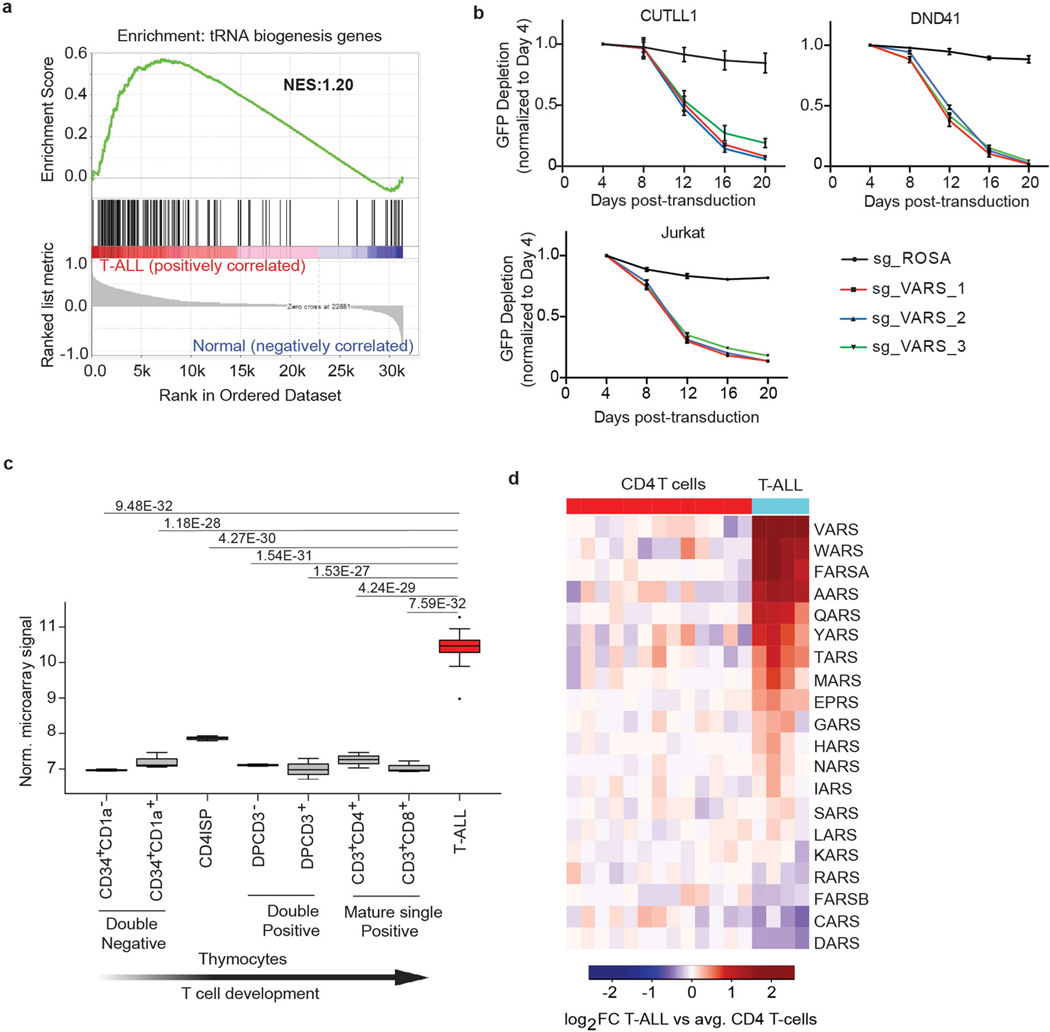
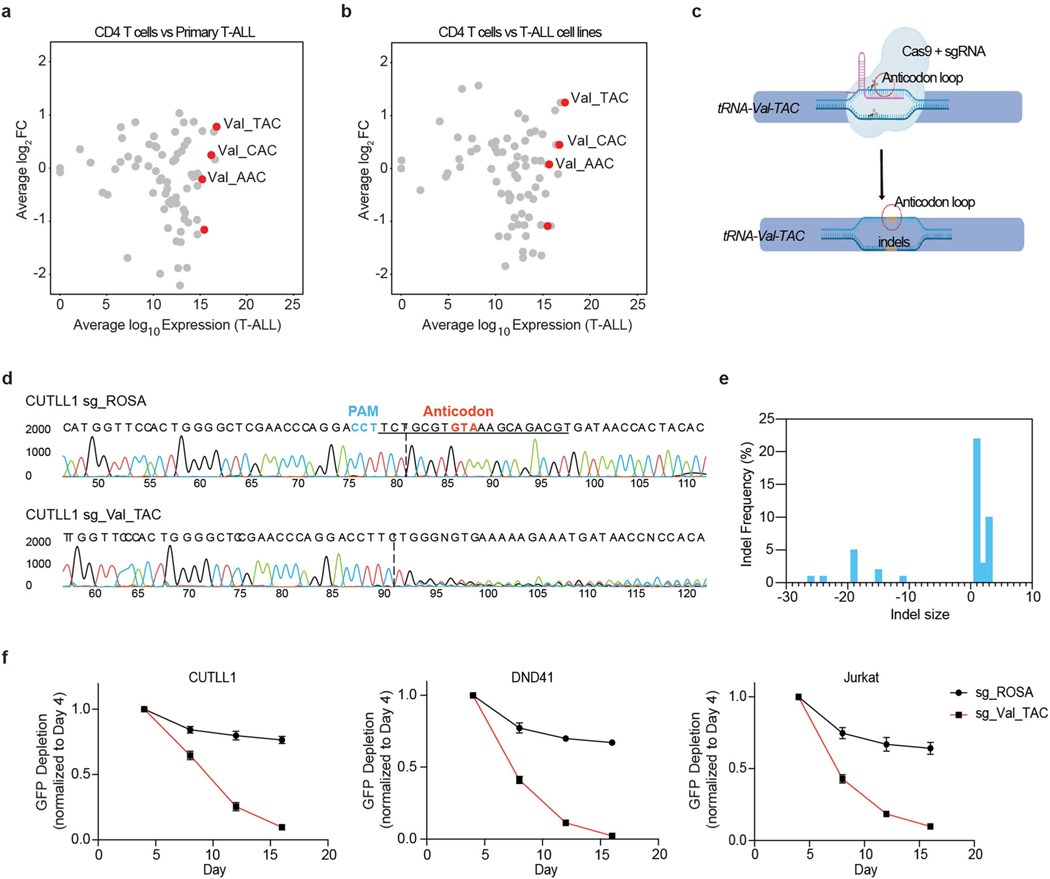
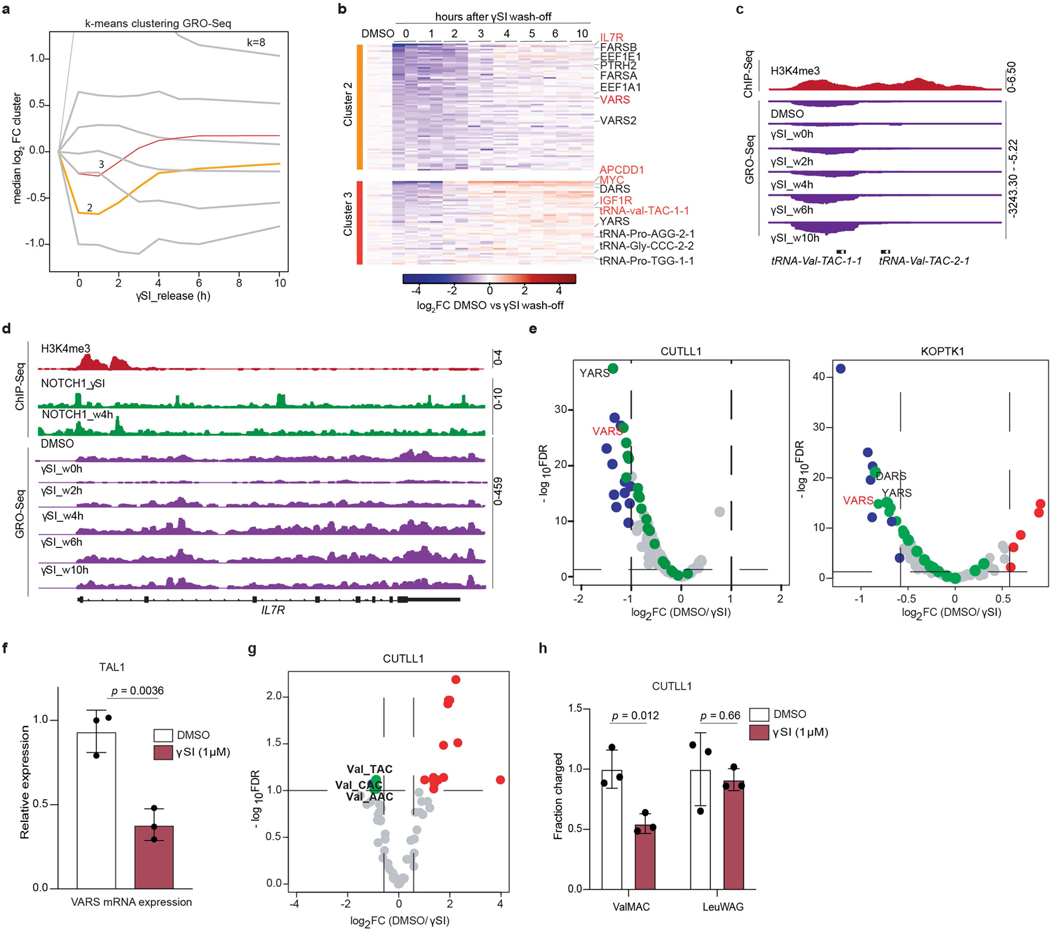
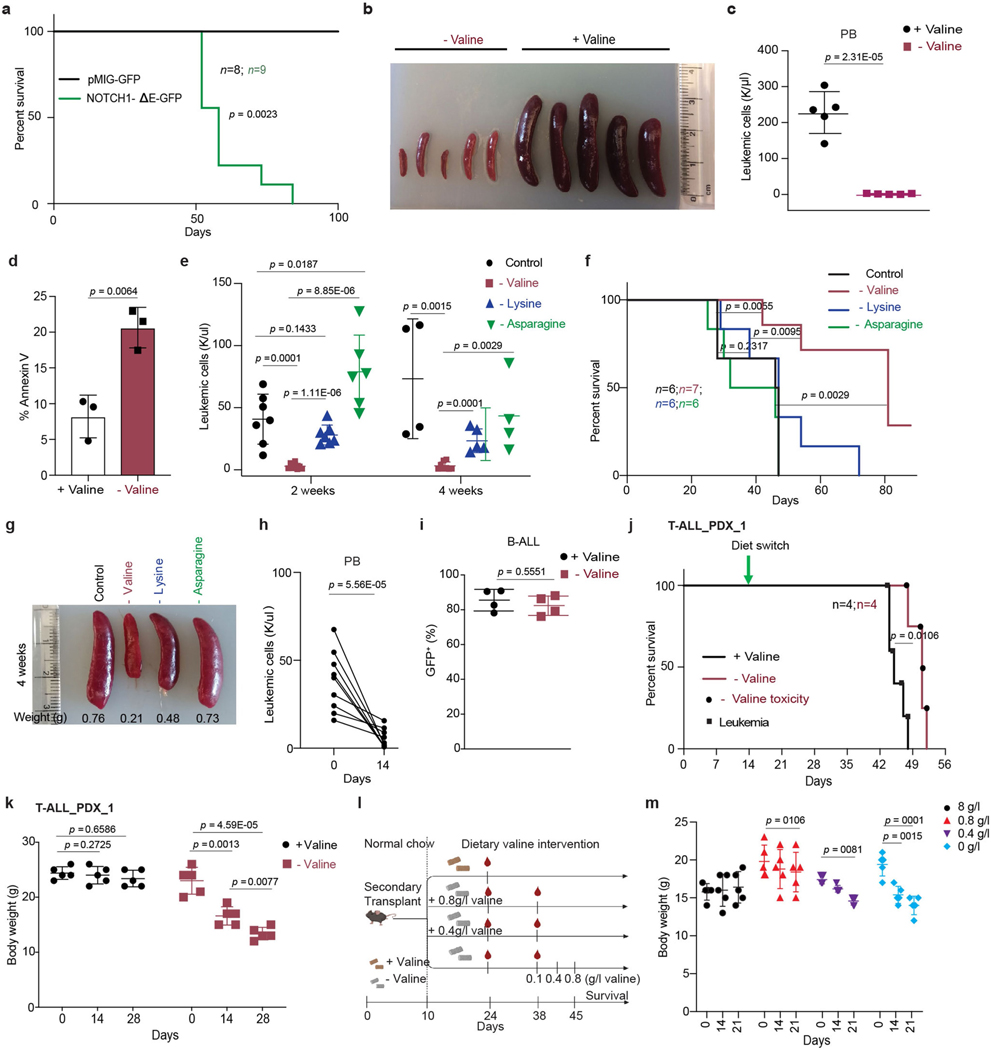
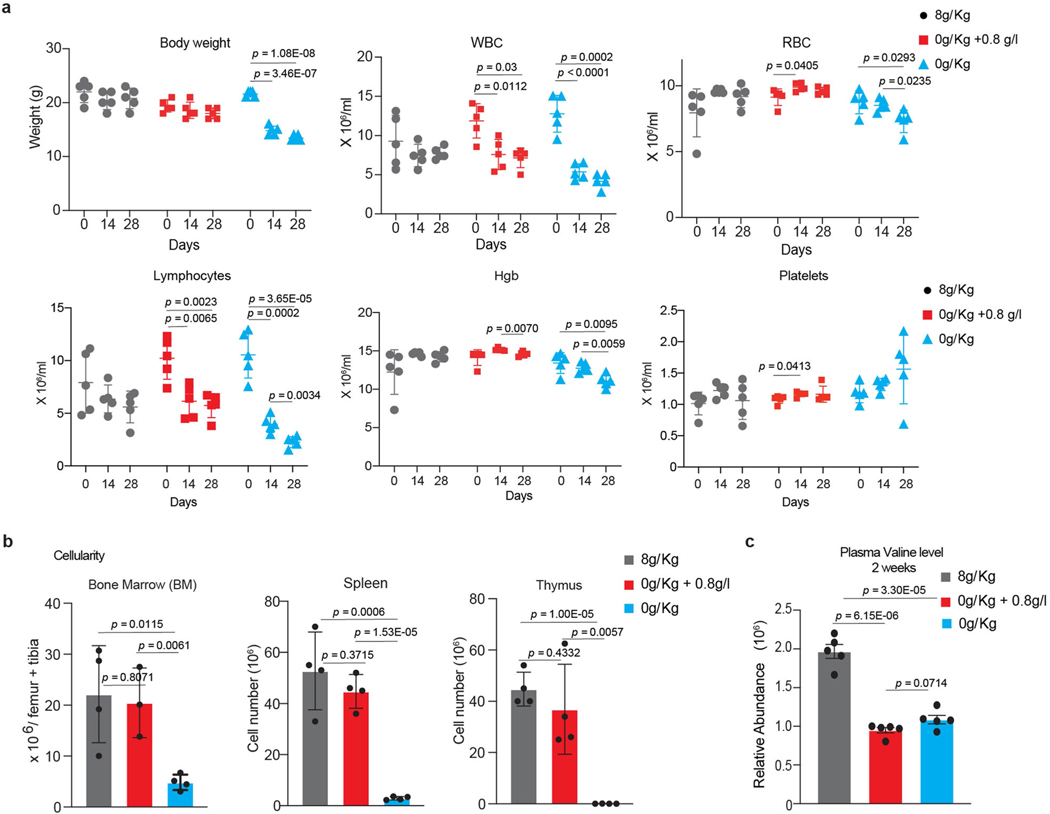
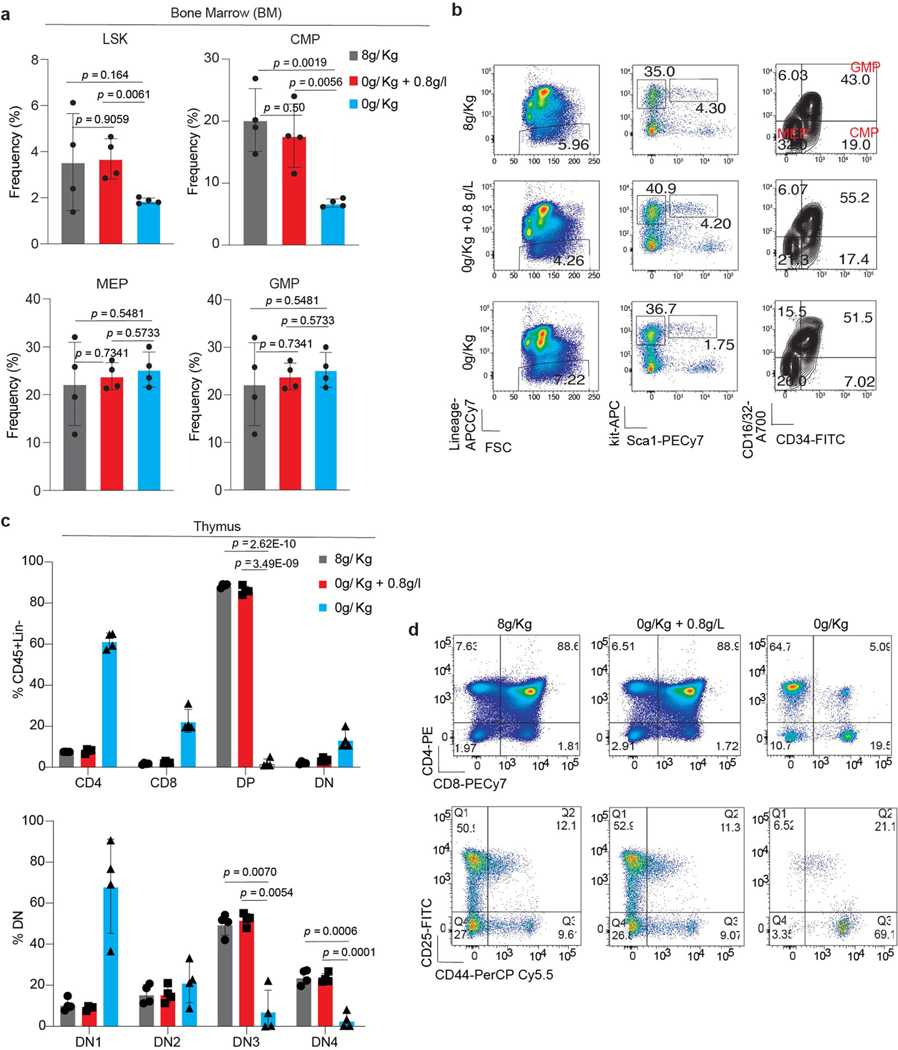
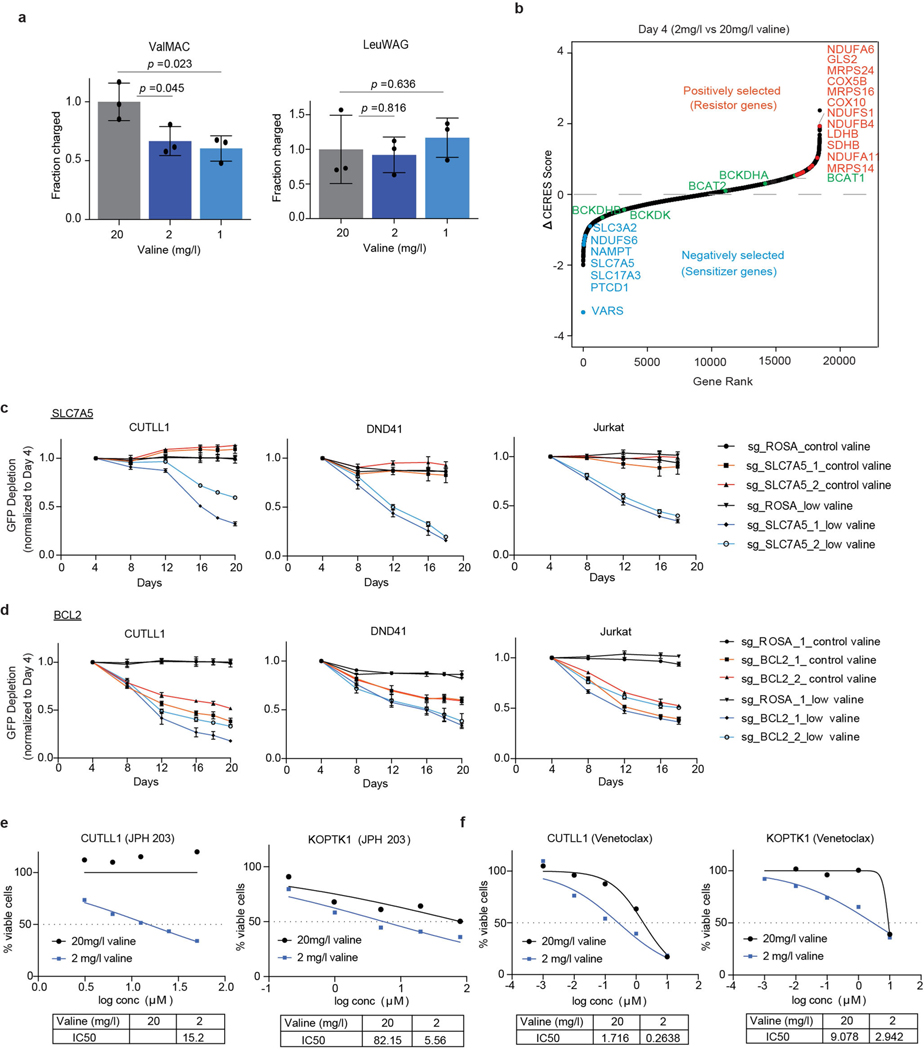
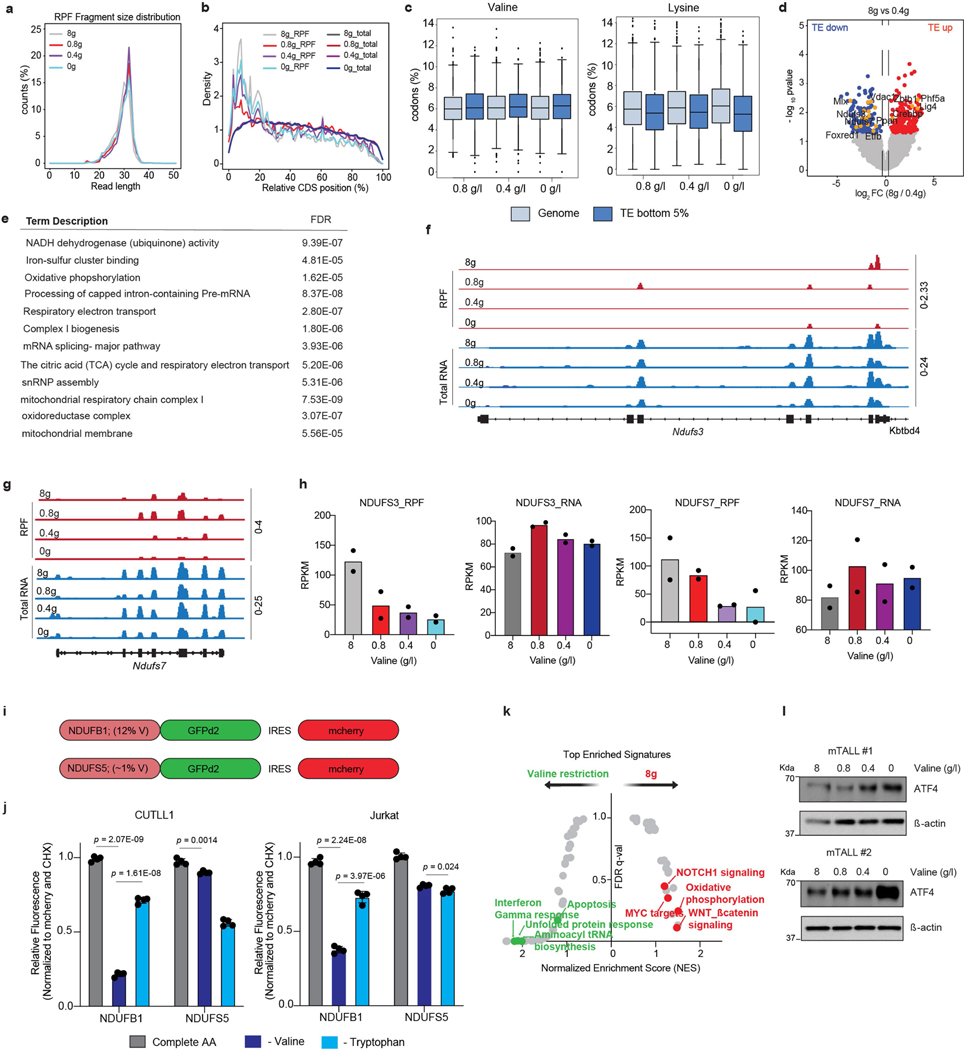
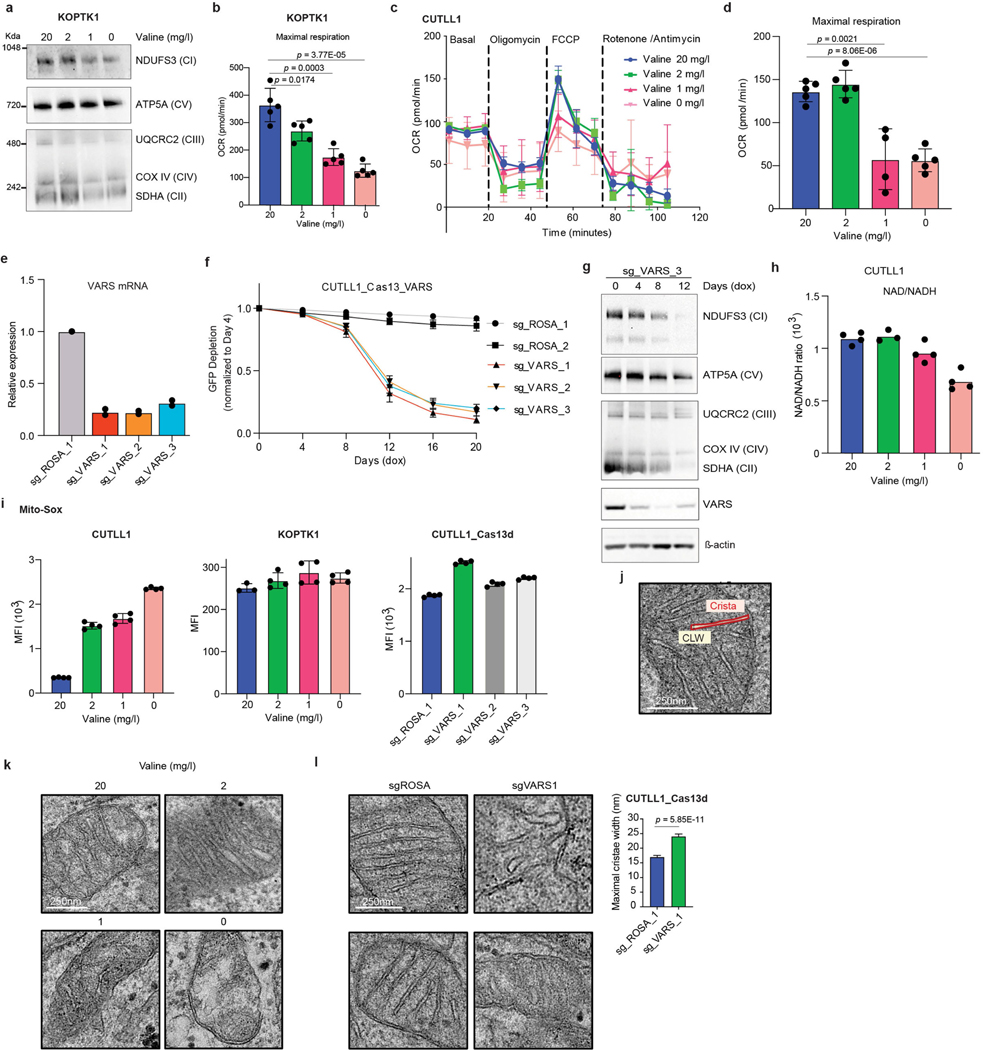
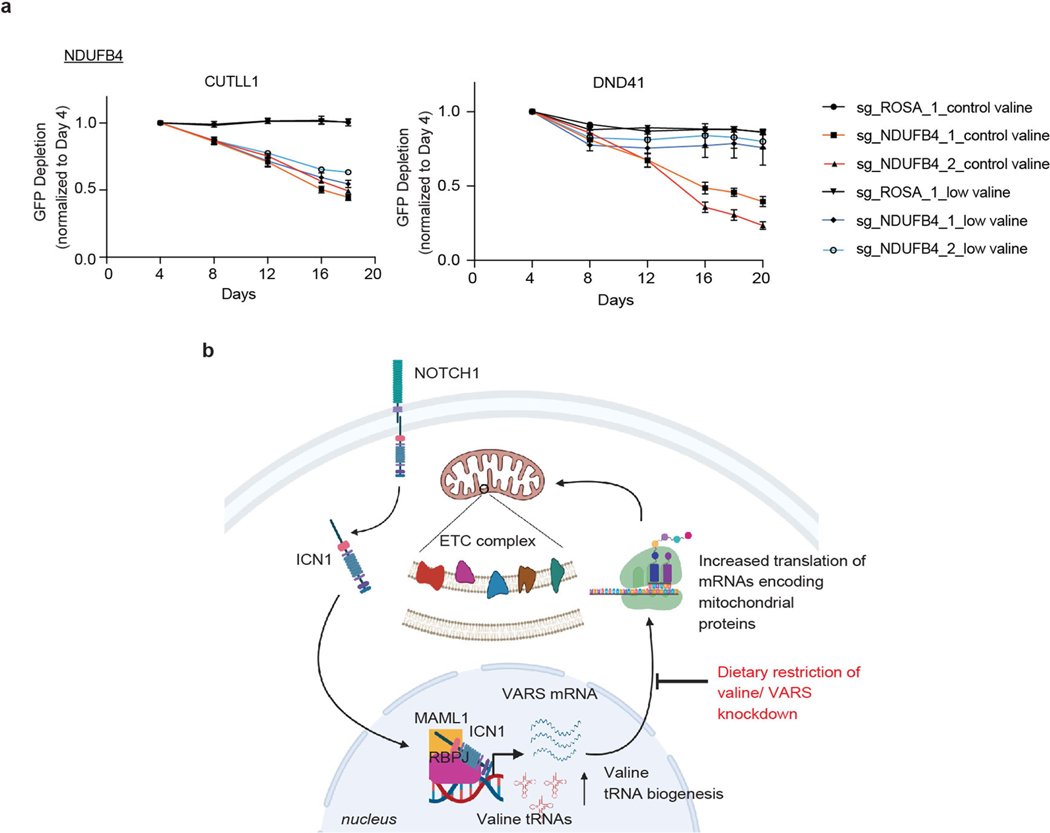
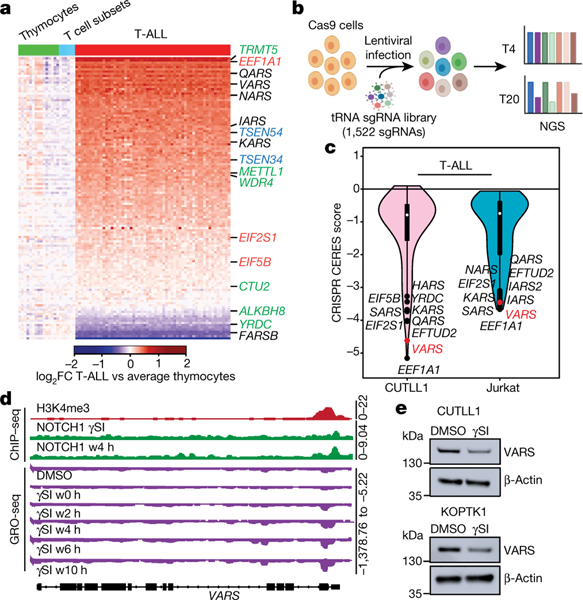
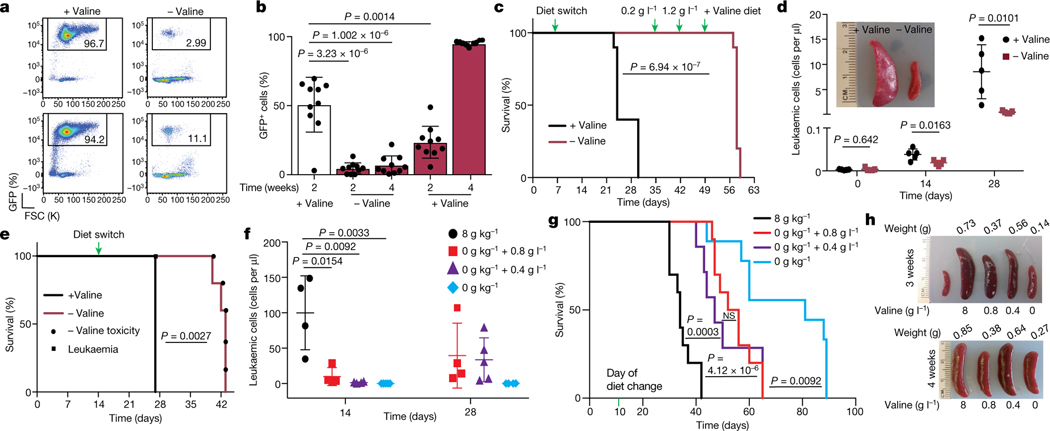
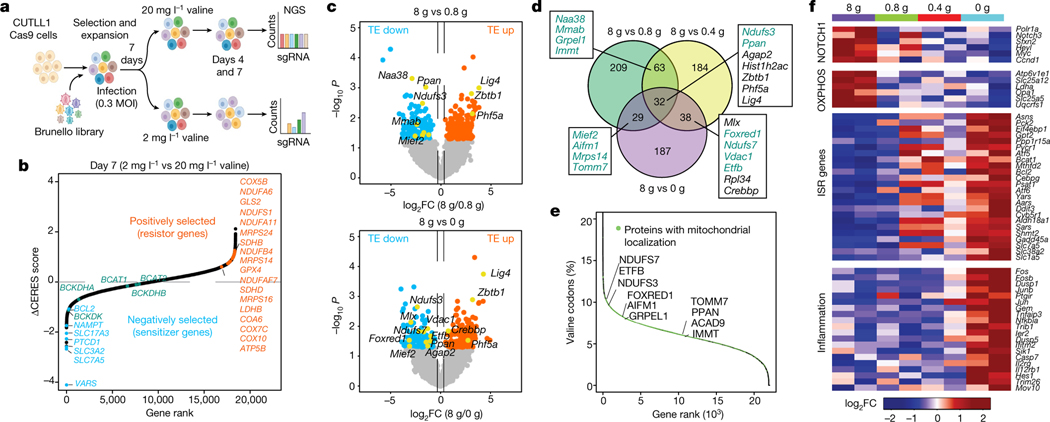
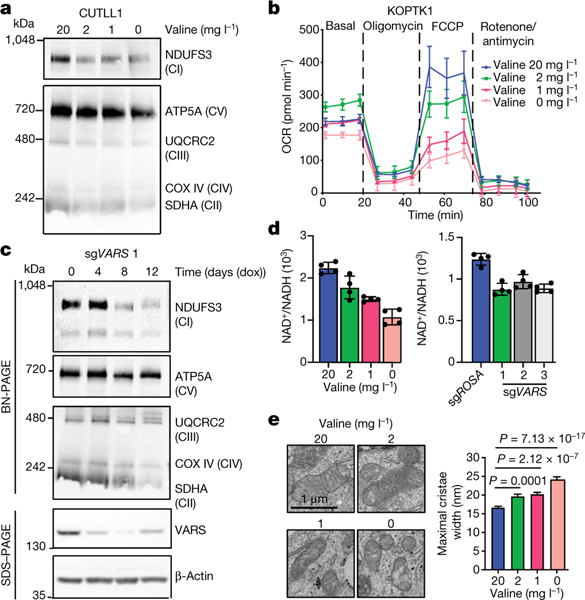
Although deregulation of transfer RNA (tRNA) biogenesis promotes the translation of pro-tumorigenic mRNAs in cancers1,2, the mechanisms and consequences of tRNA deregulation in tumorigenesis are poorly understood. Here we use a CRISPR-Cas9 screen to focus on genes that have been implicated in tRNA biogenesis, and identify a mechanism by which altered valine tRNA biogenesis enhances mitochondrial bioenergetics in T cell acute lymphoblastic leukaemia (T-ALL). Expression of valine aminoacyl tRNA synthetase is transcriptionally upregulated by NOTCH1, a key oncogene in T-ALL, underlining a role for oncogenic transcriptional programs in coordinating tRNA supply and demand. Limiting valine bioavailability through restriction of dietary valine intake disrupted this balance in mice, resulting in decreased leukaemic burden and increased survival in vivo. Mechanistically, valine restriction reduced translation rates of mRNAs that encode subunits of mitochondrial complex I, leading to defective assembly of complex I and impaired oxidative phosphorylation. Finally, a genome-wide CRISPR-Cas9 loss-of-function screen in differential valine conditions identified several genes, including SLC7A5 and BCL2, whose genetic ablation or pharmacological inhibition synergized with valine restriction to reduce T-ALL growth. Our findings identify tRNA deregulation as a critical adaptation in the pathogenesis of T-ALL and provide a molecular basis for the use of dietary approaches to target tRNA biogenesis in blood malignancies.


Figures

Extended Data Fig. 1 |
Extended Data Fig. 1 |. VARS mRNA expression is upregulated in primary T-ALL and is essential in T-ALL.
a, Gene Set Enrichment Analysis (GSEA) of genes involved in tRNA biogenesis in primary T-ALL compared to thymocytes and mature T cells subsets from healthy individuals. b, Screen validation of VARS using a competition-based proliferation assay in Cas9 expressing cell lines CUTLL1, Jurkat and DND41. Plotted are GFP percentages measured during 20 days in culture and normalized to day 4. Negative control sgRosa and three independent sgRNAs targeting VARS are shown in the graphs (n=3; mean ± SD of biological replicates). c, Box plot showing the expression of VARS mRNA in T-ALL patients (n=57 individuals) and thymocyte subsets (7 thymocyte and mature T-cell subsets derived from (n=3) independent donors) (quantile-normalized microarray results downloaded from GSE33469 and GSE33470). Boxes represent first and third quartiles and the line represent the median. Statistical evaluation between groups was performed using unpaired two-sided t-test followed by multiple testing correction (FDR) (Box plot values for CD34+CD1a: min=6.93, max=6.99, q25%=6.94, q50%=6.96, q75%=6.97; for CD34+CD1a+: min=7.05, max=7.46, q25%=7.07, q50%=7.10, q75%=7.23; for CD4ISP: min=7.79, max=7.92, q25%=7.82, q50%=7.86, q75%=7.89; for DPCD3: min=7.07, max=7.13, q25%=7.09, q50%=7.10, q75%=7.12; for DPCD3+: min=6.70, max=7.29, q25%=6.84, q50%=6.97, q75%=7.13; for CD3+CD4+: min=7.02, max=7.46, q25%=7.14, q50%=7.26, q75%=7.36; for CD3+CD8+: min=6.91, max=7.22, q25%=6.94, q50%=6.96, q75%=7.09; for T-ALL: min=8.98, max=11.28, q25%=10.29, q50%=10.47, q75%=10.63). d, Heatmap representation of changes in gene expression of all the amino acyl tRNA synthetases (RNA-seq) between primary T-ALL and naïve CD4 T cells. Heatmap shows log2 fold-change (FC) of FPKM of T-ALL against average CD4 T cells.
Extended Data Fig. 2 |
Extended Data Fig. 2 |. tRNA-Val-TAC expression is upregulated in primary T-ALL and is strongly essential for T-ALL survival.
a, Scatter plot showing the total expression of tRNAs in primary T-ALL samples (n=5 biological replicates) in the x-axis with differential expression of each tRNA species relative to mature CD4 T cell subset (n=2 biological replicates) in y-axis. b, Scatter plot showing the total expression of tRNAs in T-ALL cell lines (n=4 independent cell lines) in the x-axis with differential expression of each tRNA species relative to mature CD4 T cell subset (n=2 biological replicates) in y-axis. c, Schematic depicting the CRISPR Cas9 targeting of the anti-codon loop of tRNA-Val-TAC family genes. d, Sanger sequencing trace file of tRNA-Val-TAC genomic region in sgROSA and sgVal-TAC transduced CUTLL1 Cas9 cells. e, Size of indels along with their frequencies observed as quantified by the Synthego ICE program. f, Competition based proliferation assay in Cas9 expressing T-ALL cell lines CUTLL1, Jurkat and DND41. Plotted are GFP+ percentages measured during 16 days in culture and normalized to day 4. Negative control sgRosa and sgRNA targeting Val-TAC tRNA family are shown in the graphs (mean ± SD of n=3 independent experiments).
Extended Data Fig. 3 |
Extended Data Fig. 3 |. Oncogenic NOTCH1 signaling upregulates valine tRNA biogenesis.
a, GRO-Seq cluster analysis was performed by applying dimensional reduction with a manifold approximation and projection (UMAP) followed by k-means clustering with k=8. Clusters 2 (n = 2105 genes) and 3 (n = 2177 genes) are highlighted in orange and red respectively. b, Heatmap representation of mRNA expression changes measured by GRO-Seq within k-means clusters 2 and 3. The clusters define γSI responding genes with fast re-establishment of expression post inhibitor wash-off (see Extended Data Fig. 3a for median expression levels of all k-means clusters). Heatmap shows log2 FC of FPKM of individual GRO-Seq replicates against average DMSO signal of the respective genes. c, Snapshots of H3K4me3 ChIP-Seq on tRNA-Val-TAC 1–1 promoter and d, IL7R promoter as fold-enrichment over input. Below GRO-Seq in CUTLL1 cells upon DMSO, γSI treatment and release after drug washout as counts-per-million (cpm). e, Volcano plot showing differential expression of tRNA pathway genes (153 genes) in CUTLL1 (left) and KOPTK1 (right) upon treatment with DMSO or γSI for 72h. (n=2; FDR < 0.05 and log2FC > 0.58 or < −0.58), cytoplasmic aminoacyl tRNA synthetases are highlighted in green. Statistical evaluation was performed using two-sided edgeR analysis (function glmQLFTest) followed by multiple testing correction (FDR). f, Relative expression of VARS mRNA by qPCR analysis in human T-ALL cell line TAL1 following treatment with γSI for 72h. (mean ± SD of n=3 independent replicates, two-sided unpaired t-test). g, Volcano plot of differential expression of tRNA genes in CUTLL1 upon treatment with DMSO or γSI for 4 days. Valine tRNA genes are highlighted in green (n=2; FDR < 0.1 and log2FC > 0.58 or < −0.58). Statistical evaluation was performed using two-sided edgeR analysis (function glmQLFTest) followed by multiple testing correction (FDR). h, Val-tRNA and control Leu-tRNA aminoacylation analysis of CUTLL1 cells treated with either DMSO or γSI (mean ± SD of n=3 independent replicates, two-sided unpaired t-test).
Extended Data Fig. 4 |
Extended Data Fig. 4 |. Dietary valine deprivation/restriction reduce leukemic burden and increases survival in mice.
a, Kaplan-Meier curve representing morbidity of recipient mice transplanted with ckit+ cells transduced with either pMIG (n=8) or NOTCH1-ΔE-IRES-GFP (n=9) (Log-rank test, two-sided). b, Representative image of spleen from mice secondary transplanted with NOTCH-ΔE-GFP+ tumors and fed either control diet or valine-deficient diet for 3 weeks. c, Absolute leukemic burden in peripheral blood from mice fed either control diet or valine deficient diet for 3 weeks (mean ± SD of n=5 animals; two-sided unpaired t-test). d, Percentage annexin V positive cells (mean ± SD of n=3 animals; two-sided unpaired t-test). e, Absolute leukemic burden in peripheral blood from the mice transplanted with NOTCH-ΔE-GFP+ tumors and fed complete amino acid diet (n=7) or diets deficient in either valine (n=7), lysine (n=6) or asparagine (n=6); (mean ± SD of individual animals; two-sided unpaired t-test). f, Kaplan–Meier survival graph of mice represented in (e) (Log-rank test, two-sided). g, Representative image of spleen from mice fed different diets in (e) and (f). h, Peripheral tumor burden in mice fed valine deficient diet for 2 weeks at late stages of tumor development (n=10; two-sided unpaired t-test). i, Percentage GFP+ cells in peripheral blood of mice transplanted with (BCR-ABL-GFP+) tumors and fed either control diet or valine-deficient diet for 2 weeks (mean ± SD of n = 4 animals; two-sided unpaired t-test). j, Kaplan–Meier survival graph of NSG mice transplanted with patient derived xenograft T-ALL PDX_1 and fed either control diet (n=5) or valine deficient diet (n=5) (Log-rank test, two-sided). Death owing to leukemia or toxicity of valine deprivation is highlighted. k, Body weights of NSG mice transplanted with T-ALL PDX_1 and fed either control valine proficient diet or valine deficient diet (mean ± SD of n=5 animals; two-sided unpaired t-test). l, Schematic representation of secondary transplant experiment to test sensitivity of T-ALL to decreasing levels of dietary valine (created with Biorender.com). m, Body weights of C57BL/6 mice secondary transplanted with NOTCH-ΔE GFP+ tumors and fed either control valine proficient diet (n=5) or valine deficient diet (n=5) or valine deficient diet substituted with 0.8g/l valine (n=4) or 0.4g/l in drinking water (n=5) (mean ± SD of individual animals; two-sided unpaired t-test).
Extended Data Fig. 5 |
Extended Data Fig. 5 |. Dietary valine restriction does not affect hematopoiesis.
a, Body weight, White blood cell (WBC), red blood cell (RBC), lymphocyte, hemoglobin (Hgb) and Platelet counts in mice fed either control valine proficient diet (8g/Kg valine), valine deficient diet (0g/Kg valine) or valine deficient diet (0g/Kg valine) substituted with 0.8g/l valine in drinking water (mean ± SD of n=5 animals each condition; two-sided unpaired t-test) for 4 weeks. b, Total cell numbers of bone marrow (tibia+femur), spleen and thymus from mice fed either a control valine proficient diet (8g/Kg valine), valine deficient diet (0g/Kg valine) or valine deficient diet (0g/Kg valine) substituted with 0.8g/l valine in drinking water for 4 weeks (mean ± SD of n=4 animals each condition; two-sided unpaired t-test). c, Plasma valine levels in peripheral blood serum of mice fed either control valine proficient diet (8g/Kg valine), valine deficient diet (0g/Kg valine) or valine deficient diet (0g/Kg valine) substituted with 0.8g/l valine (mean ± SD of n=5 animals each condition; two-sided unpaired t-test).
Extended Data Fig. 6 |
Extended Data Fig. 6 |. Dietary valine restriction does not affect LSK and thymocytes.
a, Frequency of LSK and different progenitors (GMP, CMP and MEP) from mice fed either a complete valine proficient diet (8g/Kg valine), valine deficient diet (0g/Kg valine) or valine deficient (0g/Kg valine) diet substituted with 0.8g/l valine in drinking water (right) (mean ± SD of n=4 animals each condition; two-sided unpaired t-test). b, Representative flow cytometry plots of the different hematopoietic compartments highlighted in (a). c, Frequency of intra-thymic T-cell population represented as percentage of CD45+ cells from mice fed either a valine proficient diet (8g/Kg valine), valine deficient diet (0g/Kg valine) or valine deficient diet (0g/Kg valine) substituted with 0.8g/l valine in drinking water for 4 weeks (mean ± SD of n=4 animals each condition; Two-way Anova analysis with Tukey multiple test correction). d, Representative flow cytometry plots of the different thymocyte subsets from (c).
Extended Data Fig. 7 |
Extended Data Fig. 7 |. Genome-wide CRISPR maps positive and negative genetic interactions with valine restriction.
a, Val-tRNA and control Leu-tRNA aminoacylation analysis of CUTLL1 cells cultured in either standard valine media (20mg/l) or low valine media (2mg/l and 1mg/l) (mean ± SD of n=3 independent replicates, two-sided unpaired t-test). b, Gene ranks plotted based on Δ CERES dependency score between low valine media and standard valine media conditions for 4 days. The top negatively and positively selected genes in low valine media are highlighted in blue and red respectively. Genes involved in Branched chain amino acid metabolism are highlighted in green.c, Validation of SLC7A5 dependency and d, BCL2 in low valine media relative to standard valine media using a competition-based survival assay in Cas9 expressing T-ALL cell lines. Plotted are GFP percentages measured during 20 days in culture and normalized to day 4. Negative control sgRosa and two independent sgRNAs targeting SLC7A5 and BCL2 are shown in the graphs (mean ± SD of n=3 independent experiments). e, IC50 curve of SLC7A5 inhibitor JPH 203 and f, BCL2 inhibitor venetoclax of T-ALL cell lines in either standard valine and low valine media. Representative of (n=2 of independent experiments).
Extended Data Fig. 8 |
Extended Data Fig. 8 |. Valine restriction reduces translation of mitochondrial electron transport chain proteins.
a, Ribosome protected fragment (RPF) length distribution of the Ribo-Seq datasets (n=2 biological replicates each condition). b, Relative CDS distribution of the RPF fragments (n=2 biological replicates each condition). c, Percentage valine (left) and lysine (right) codons between mRNAs with lowest translational efficiency (TE; bottom 5%) and mRNAs with no significant changes in translational efficiency (log2FC > −0.1375 and < 0.1375) between leukemic cells isolated from mice fed control diet and valine restricted diet (n=2 biological replicates each condition) (Box plot values for valine: for genome 0.8g/l: min=1.42, max=13.73, q25%=4.99, q50%=5.99, q75%=7.09; for bottom 5% 0.8g/l: min=0.00, max=11.84, q25%=5.03, q50%=6.10, q75%=7.42; for genome 0.4g/l: min=0.00, max=17.07, q25%=5.04, q50%=6.09, q75%=7.20; for bottom 5% 0.4g/l: min=0.00, max=11.75, q25%=5.21, q50%=6.18, q75%=7.39; for genome 0g/l: min=0.00, max=15.79, q25%=5.02, q50%=6.9, q75%=7.19; for bottom 5% 0g/l: min=0.00, max=17.07, q25%=5.08, q50%=6.29, q75%=7.36) (Box plot values for lysine: for genome 0.8g/l: min=0.00, max=29.02, q25%=4.28, q50%=5.75, q75%=7.41; for bottom 5% 0.8g/l: min=0.00, max=14.85, q25%=3.77, q50%=5.36, q75%=7.14; for genome 0.4g/l: min=0.34, max=27.93, q25%=4.36, q50%=5.87, q75%=7.43; for bottom 5% 0.4g/l: min=0.47, max=14.85, q25%=3.92, q50%=5.45, q75%=7.11; for genome 0g/l: min=0.47, max=27.92, q25%=4.43, q50%=6.05, q75%=7.67; for bottom 5% 0g/l: min=0.00, max=15.76, q25%=3.63, q50%=5.26, q75%=6.96). d, Volcano plots of Δ translational efficiency in NOTCH-ΔE-GFP+ cells isolated from mice fed different levels of dietary valine (n=2 of biological replicates each condition). (p-value < 0.05 and log2FC > 0.58 or < −0.58). e, STRING Network Pathway enrichment analysis of the 162 mRNAs with reduced translational efficiencies in mice fed valine restricted diet relative to mice fed control valine proficient diet. f, Snapshot of Ribosome protected fragment (RPF) and total RNA tracks for gene Ndufs7 and g, Ndufs3. h, RPKM values of total RNA and RPF read counts for Ndufs3 and Ndufs7 (n=2 of biological replicates each condition). i, Schematic of the reporter constructs expressing GFPd2 in fusion with either NDUFB1 (high valine content) or NDUFS5 (low valine content). mCherry serves as an internal control. j, CUTLL1 and Jurkat cells infected with the reporter constructs were cultured in either complete RPMI media or media lacking either valine or tryptophan for 8h. Quantification of GFPd2 fluorescence normalized to mCherry signal and cycloheximide treatment are plotted. (mean ± SD of n=4 independent replicates; two-sided unpaired t-test.). k, Gene signatures upregulated in control diet (8g/Kg valine) is shown in red whereas gene signatures upregulated in mice fed reduced valine is highlighted in green. l, Immunoblots for ATF4 and actin (same gel) from NOTCH-ΔE-GFP+ cellular lysates isolated from mice fed different levels of dietary valine (n=2 biological replicates). For gel source data, see Supplementary Fig. 1. RPKM, reads per kilobase transcript per million mapped reads.
Extended Data Fig. 9 |
Extended Data Fig. 9 |. Valine tRNA biogenesis and bioavailability regulates levels of mitochondrial complex I.
a, Blue Native (BN)-PAGE analysis (same gel, for gel source data, see Supplementary Fig. 1) and b, maximal respiration of KOPTK1 cells cultured in different levels of valine for 72 h. c, Oxygen consumption rate (OCR) and d, Maximal respiration of CUTLL1 cells cultured in different levels of valine for 72 h (mean ± SD of n=5 independent replicates; two-sided unpaired t-test). e, Relative expression of VARS mRNA by qPCR analysis following 4 days of doxycycline treatment to induce Cas13d expression. (n=2 independent replicates). f, Competition based proliferation assay to validate loss of fitness following VARS knockdown in CUTLL1 Cas13d cells. Plotted are GFP percentages measured during 20 days in culture and normalized to day 0 of doxycycline treatment. Negative control sgRosa and three independent sgRNAs targeting VARS are shown in the graphs (mean ± SD of n=3 independent replicates). g, BN-PAGE (top) analysis of CUTLL1 cells expressing inducible Cas13d and sgRNA_1 targeting VARS transcript. SDS-PAGE and immunoblots confirming VARS knockdown (same gel, for gel source data, see Supplementary Fig. 1). h, NAD+/NADH ratio of CUTLL1 cells cultured in RPMI with different levels of valine for 72 h. Representative of (n=2) independent experiments. i, MitoSox staining of CUTLL1, KOPTK1 cells cultured in RPMI with different levels of valine for 72 h and analyzed by flow cytometry (left, middle). CUTLL1 Cas13d cells transduced with three independent sgRNAs targeting VARS transcript was treated with doxycycline to induce Cas13 expression. Day 8 of doxycycline treatment, cells were stained with MitoSOX and analyzed by flow cytometry (right). Graphs show Mito-SOX mean fluorescence intensity (MFI). Representative of (n=3) independent experiments (mean ± SD of n=4 technical replicates). j, Electron micrograph from CUTLL1 cells illustrating the mitochondrial cristae structure. Arrow denotes the parameter of maximal Cristae Lumen Width (CLW) quantified in this study. k, Representative electron micrographs of CUTLL1 cells cultured in RPMI with different levels of valine for 72 h. l, Representative electron micrographs of CUTLL1-Cas13d cells transduced with either sgROSA or sgRNA targeting VARS and doxycycline treated for 8 days to induce Cas13d expression (left). Quantification of maximal cristae width in 10 randomly selected mitochondria from 15 cells (right) (n=110 cristae; mean ± SD; two-sided unpaired t-test).
Extended Data Fig. 10 |
Extended Data Fig. 10 |. Loss of pathway intrinsic ETC proteins promotes resistance to valine restriction.
a, Validation of NDUFB4 as a positively selected gene in low valine media relative to standard valine media using a competition-based proliferation assay in Cas9 expressing cell lines CUTLL1 and DND41. Plotted are GFP percentages measured during 20 days in culture and normalized to day 4. Negative control sgRosa and two independent sgRNAs targeting NDUFB4 are shown in the graphs (mean ± SD of n=3 independent replicates). b, Schematic depicting how upregulated valine tRNA biogenesis regulates mitochondrial bio-energetics in T-ALL (created with Biorender.com).
Fig. 1 |
Fig. 1 |. Valine tRNA biogenesis is upregulated by NOTCH1 in T-ALL.
a, Heatmap of changes in mRNA expression of genes involved in Trna biogenesis between cells from patients with T-ALL (n = 57) and thymocyte subsets (n = 21; 7 thymocyte and mature T cell subsets derived from 3 donors) (green, tRNA-modifying genes; black, aminoacyl tRNA synthetases; red, translational factors that bind to tRNAs; blue, genes that regulate tRNA splicing). log2fold-change (FC) expression between T-ALL and average thymocytes. b, Schematic of the CRISPR–Cas9 screen for genes involved in tRNA biogenesis (created with Biorender.com). NGS, next-generation sequencing. c, Violin plot of CERES dependency scores of the CRISPR–Cas9 screen (the box plot values for the CUTLL1 cell line: minimum −5.16, maximum 0.10, 25% quartile −1.57, 50% quartile −0.79, 75% quartile −0.47; for the Jurkat cell line: minimum −3.66, maximum −0.06, 25% quartile −1.99, 50% quartile −0.74, 75% quartile −0.38). The top ten depleted genes in each cell line are highlighted. d, Snapshots of H3K4me3 and NOTCH1 chromatin immunoprecipitation followed by sequencing (ChIP–seq) on the VARS promoter. GRO-seq (below; negative strand) upon DMSO, γSI treatment and release after drug wash out as counts per million. w0 h, wash out after 0 h. e, Protein levels of VARS and actin (same gel) after treatment with DMSO or γSI for 72 h (representative of n = 2 independent experiments).
Fig. 2 |
Fig. 2 |. Dietary valine restriction reduces leukaemic burden and increases survival.
a, Representative FACS plots of GFP+ frequency in peripheral blood of mice transplanted with NOTCH-ΔE–GFP+ cells and fed either a control diet (+valine) or a valine-deficient diet (−valine). b, Percentage of GFP+ cells in peripheral blood of transplanted mice fed either a control diet (n = 10) or a valine-deficient diet (n = 10) followed by gradual valine reintroduction (mean ± s.d.; two-sided unpaired t-test). c, Kaplan–Meier survival graph of mice represented in b (log-rank test; two-sided). d, Leukaemic burden in peripheral blood in mice transplanted with patient-derived xenograft model 1 of T-ALL fed either a control diet or a valine-deficient diet (n = 5; mean ± s.d.; two-sided unpaired t-test) along with representative spleen images. e, Kaplan–Meier survival graph of mice transplanted with patient-derived xenograft 2 and fed a control diet or a valine-deficient diet (n = 5 each condition) (log-rank test; two-sided). Death owing to leukaemia or toxicity of valine deprivation is highlighted. f, Absolute leukaemic burden in peripheral blood from mice fed different dietary valine diets: 8 g kg−1 valine (n = 4), 0 g kg−1 valine (n = 5), 0 g kg−1 valine substituted with either 0.8 g l−1 valine (n = 5) or 0.4 g l−1 valine (n = 5) (mean ± s.d.; two-sided unpaired t-test). g, Kaplan–Meier survival graph of mice fed different levels of dietary valine (8 g kg−1 (n = 10); 0 g kg−1 (n = 10); 0 g kg−1 substituted with 0.8 g l−1 valine (n = 7) or 0.4 g l−1 valine (n = 9) (log-rank test; two-sided). NS, not significant. h, Representative images of the spleen from mice fed different levels of dietary valine.
Fig. 3 |
Fig. 3 |. Dietary valine restriction reduces translation of mRNAs involved in the mitochondrial ETC.
a, Schematic of the genome-wide CRISPR–Cas9 loss-of-function screen in different valine media (created with Biorender.com). MOI, multiplicity of infection. b, Gene ranks plotted on the basis of the ΔCERES dependency score between low and standard valine. Negatively selected genes (blue), positively selected genes (red) and BCAA metabolism genes (green) are highlighted. c, Volcano plots of Δ translational efficiency (TE) in NOTCH-ΔE–GFP+ cells isolated from mice fed different levels of dietary valine (n = 2 for each condition) (P < 0.05 and log2FC > 0.58 or log2FC < −0.58). d, Venn diagram showing overlap of the differentially translated mRNAs across different valine diets (green, proteins with reported mitochondrial localization based on MitoCarta 2.0; black, proteins with no reported mitochondrial localization). e, Occurrence of valine codons (%) in the human genome sorted high to low. Mitochondrial genes are indicated in green. f, Heatmap representing changes in total RNA expression of NOTCH-ΔE–GFP+ cells from mice fed different levels of dietary valine (n = 2 for each condition). log2FC of FPKM of mRNAs from mice fed reduced levels of valine relative to mice fed a control diet. ISR, integrated stress response; OXPHOS, oxidative phosphorylation; FPKM, fragments per kilobase of transcript per million mapped reads.
Fig. 4 |
Fig. 4 |. Valine tRNA biogenesis and bioavailability regulate mitochondrial complex I assembly.
a, Blue native (BN)-PAGE analysis (same gel). b, Oxygen consumption rate (OCR) of cells cultured in different levels of valine (FCCP, carbonyl cyanide-p-trifluoromethoxyphenylhydrazone) for 72 h. c, BN-PAGE (top), SDS–PAGE (bottom) and immunoblot analysis of CUTLL1 cells expressing doxycycline (dox)-inducible Cas13d and sgRNA 1 targeting the VARS transcript (same gel). CI to CV refer to complexes I to V, respectively. d, NAD+/NADH ratio in KOPTK1 cells cultured in different levels of valine for 72 h (left) or after inducible knockdown of VARS with three independent sgRNAs (right) (mean ± s.d. from technical replicates). Representative of n = 3 independent experiments. e, Representative electron micrographs of CUTLL1 cells cultured in different valine levels for 72 h (left). Quantification of the maximal width of cristae in 10 randomly selected mitochondria from 15 cells (right) (n = 110 cristae; mean ± s.d.; two-sided unpaired t-test).

Comment in

  • tRNA supply and demand.
    Seton-Rogers S. Seton-Rogers S. Nat Rev Cancer. 2022 Mar;22(3):129. doi: 10.1038/s41568-022-00448-3. Nat Rev Cancer. 2022. PMID: 35091697 No abstract available.

References

    1. Rapino F. et al. Codon-specific translation reprogramming promotes resistance to targeted therapy. Nature 558, 605–609 (2018). - PubMed
    1. Goodarzi H. et al. Modulated expression of specific tRNAs drives gene expression and cancer progression. Cell 165, 1416–1427 (2016). - PMC - PubMed
    1. Wolfe AL et al. RNA G-quadruplexes cause eIF4A-dependent oncogene translation in cancer. Nature 513, 65–70 (2014). - PMC - PubMed
    1. Truitt ML et al. Differential requirements for eIF4E dose in normal development and cancer. Cell 162, 59–71 (2015). - PMC - PubMed
    1. Loayza-Puch F. et al. Tumour-specific proline vulnerability uncovered by differential ribosome codon reading. Nature 530, 490–494 (2016). - PubMed

Publication types