. 2021 Dec 1:12:752782.
doi: 10.3389/fimmu.2021.752782. eCollection 2021.

Rapid Emergence of T Follicular Helper and Germinal Center B Cells Following Antiretroviral Therapy in Advanced HIV Disease

Affiliations

Rapid Emergence of T Follicular Helper and Germinal Center B Cells Following Antiretroviral Therapy in Advanced HIV Disease

Chun-Shu Wong et al. Front Immunol. .

Abstract

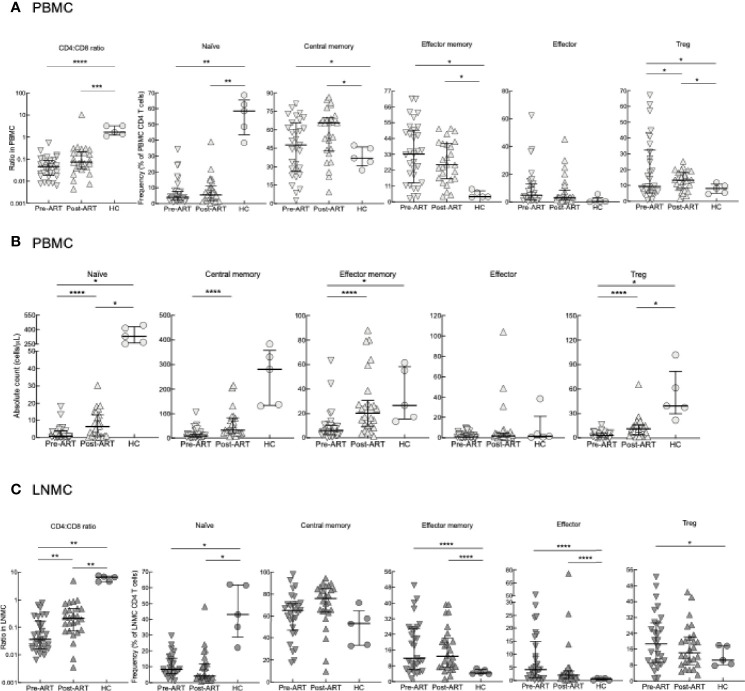
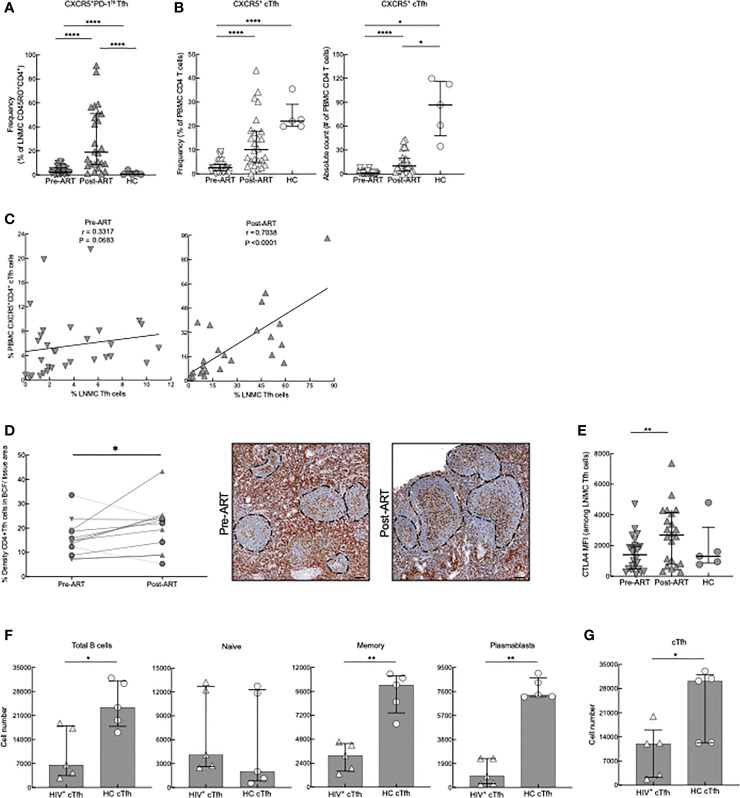
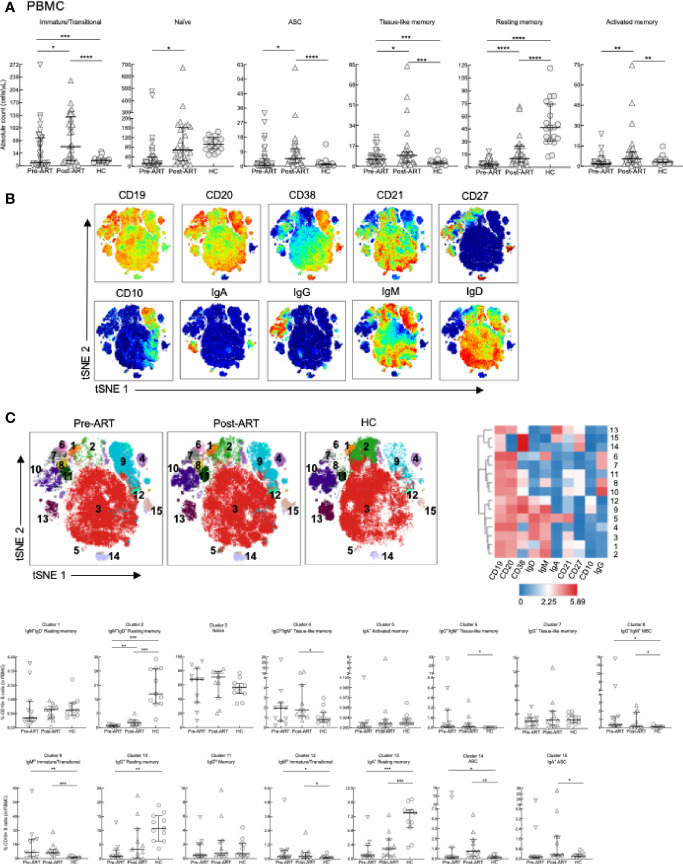
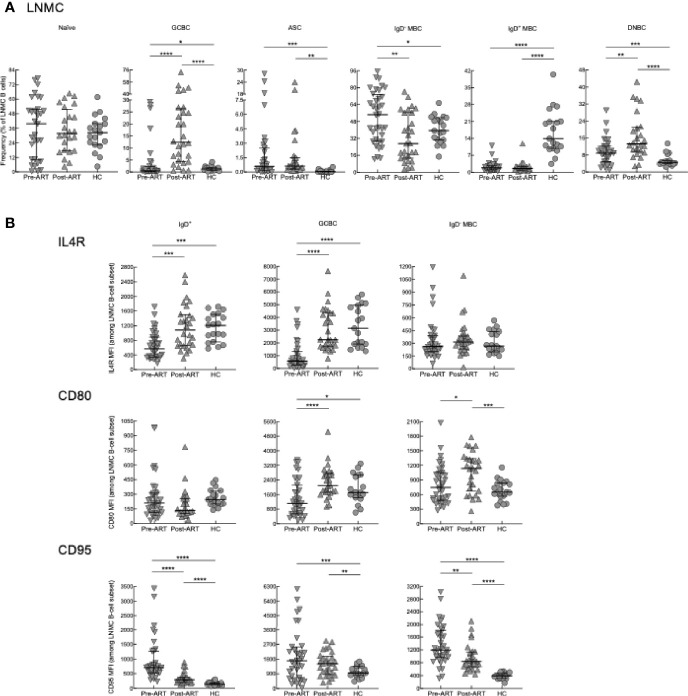
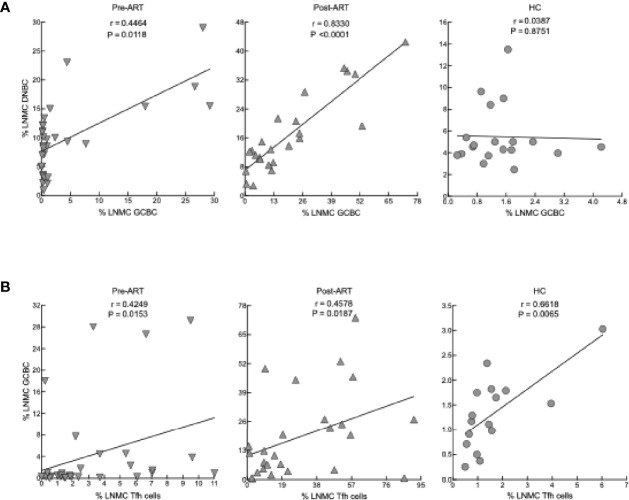
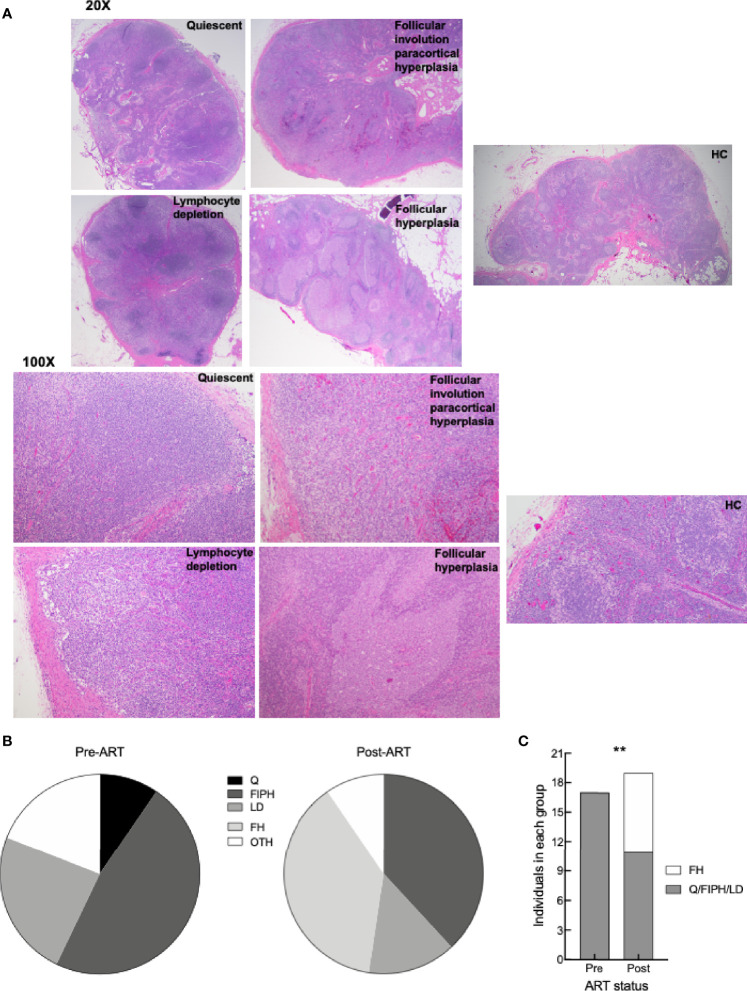
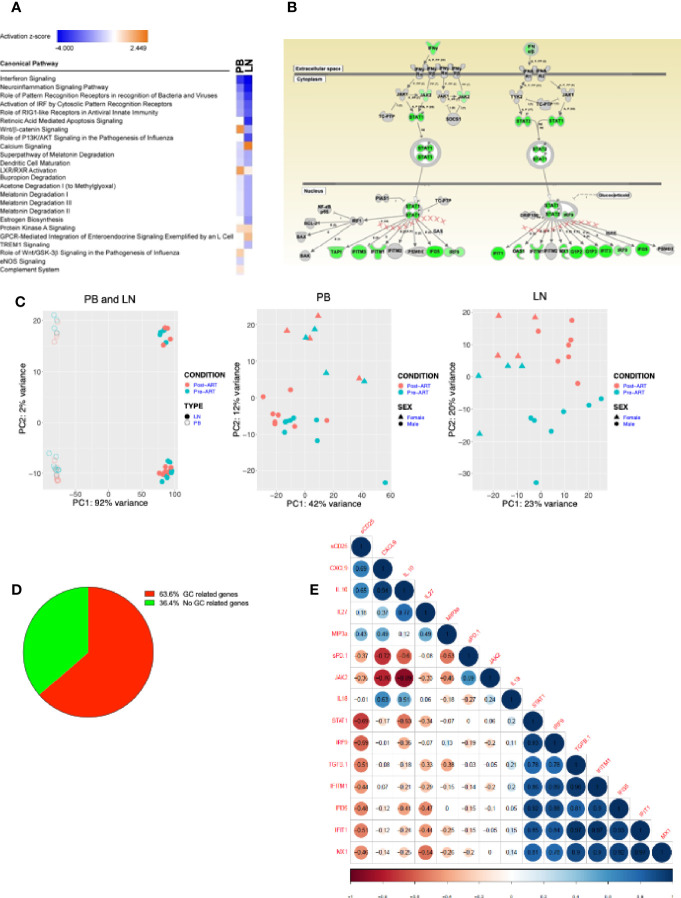
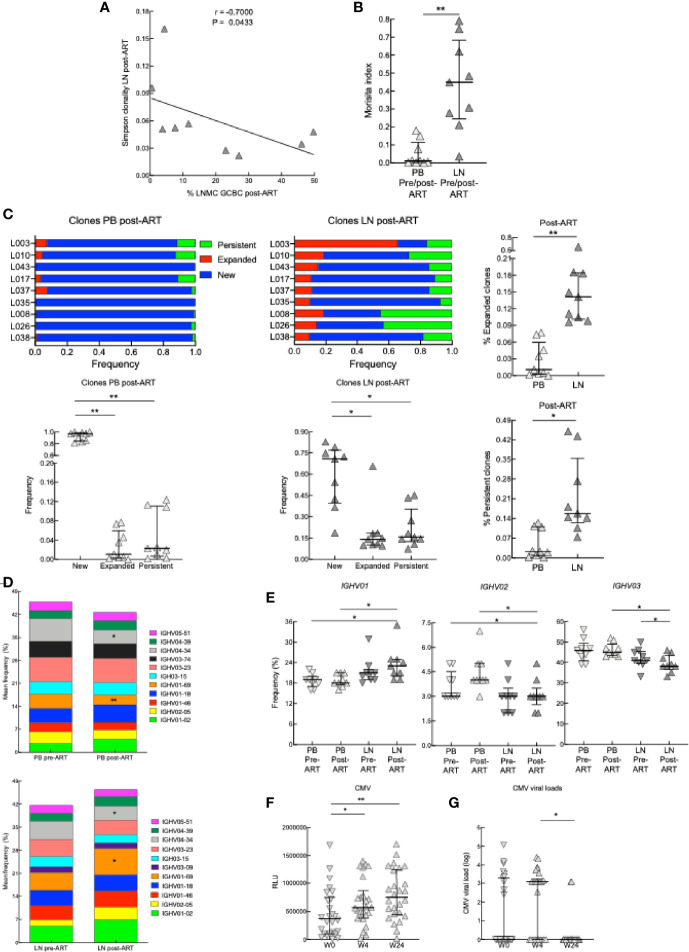
Low nadir CD4 T-cell counts in HIV+ patients are associated with high morbidity and mortality and lasting immune dysfunction, even after antiretroviral therapy (ART). The early events of immune recovery of T cells and B cells in severely lymphopenic HIV+ patients have not been fully characterized. In a cohort of lymphopenic (CD4 T-cell count < 100/µL) HIV+ patients, we studied mononuclear cells isolated from peripheral blood (PB) and lymph nodes (LN) pre-ART (n = 40) and 6-8 weeks post-ART (n = 30) with evaluation of cellular immunophenotypes; histology on LN sections; functionality of circulating T follicular helper (cTfh) cells; transcriptional and B-cell receptor profile on unfractionated LN and PB samples; and plasma biomarker measurements. A group of 19 healthy controls (HC, n = 19) was used as a comparator. T-cell and B-cell lymphopenia was present in PB pre-ART in HIV+ patients. CD4:CD8 and CD4 T- and B-cell PB subsets partly normalized compared to HC post-ART as viral load decreased. Strikingly in LN, ART led to a rapid decrease in interferon signaling pathways and an increase in Tfh, germinal center and IgD-CD27- B cells, consistent with histological findings of post-ART follicular hyperplasia. However, there was evidence of cTfh cells with decreased helper capacity and of limited B-cell receptor diversification post-ART. In conclusion, we found early signs of immune reconstitution, evidenced by a surge in LN germinal center cells, albeit limited in functionality, in HIV+ patients who initiate ART late in disease.

Keywords: HIV; T follicular helper cells; germinal centers; interferon; reconstitution.


Conflict of interest statement

Author AR was employed by company Leidos Biomedical Research Inc. The remaining authors declare that the research was conducted in the absence of any commercial or financial relationships that could be construed as a potential conflict of interest.

Figures

Figure 1
Figure 1
CD4 T-cell subset phenotyping. (A) Frequencies of CD4 T-cell subsets in PBMC of pre-ART HIV+ (n = 31), 6-8 weeks post-ART (n = 26) and HC (n = 5) participants. (B) Absolute counts of T-cell subsets in PBMC of HIV+ (n = 31), 6-8 weeks post-ART (n = 26) and HC (n = 5) participants. (C) Frequencies of CD4 T-cell subsets in LNMC of pre-ART (n = 29), post-ART (n = 26), or HC (n = 5) participants. *p < 0.05, **p < 0.01, ***p < 0.001, ****p < 0.0001 by bootstrapped Welch Two Sample t-test with 10,000 iterations on full set; data are not statistically significant unless noted.
Figure 2
Figure 2
Tfh- and cTfh cell phenotyping and in vitro function. (A) Frequencies of CXCR5+PD-1hi Tfh cells of pre-ART (n = 33), post-ART (n = 26) and HC (n = 5) participants. ****p < 0.0001 by bootstrapped Welch Two Sample t-test with 10,000 iterations on full set; data are not statistically significant unless noted. (B) Frequencies and absolute counts of CXCR5+ CD45RO+ cTfh cells pre-ART (n = 33), post-ART (n = 26), and HC (n = 5) participants. *p <0.05, ****p < 0.0001 by bootstrapped Welch Two Sample t-test with 10,000 iterations on full set; data are not statistically significant unless noted. (C) Correlation between pre-ART PBMC cTfh and pre-ART LNMC Tfh cells (left panel) and between post-ART PBMC cTfh versus post-ART LNMC Tfh cells (right panel). Spearman’s rank correlation; data are not significant unless noted. (D) Quantification of Tfh cells in situ performed pre-ART (n = 11) and post-ART (n = 12) using double IHC staining for CD4 (brown) and myeloid cells (red) to determine density of CD4+ T cells within B-cell follicles (BCF); IRIS indicated by circles. Representative images are shown pre- and post-ART for one patient showing increase of CD4+ T cells within BCF. *p < 0.05 by one sample t test and Wilcoxon test. Scale bars are 200um. (E) CTLA4 expression on LNMC CXCR5+PD-1hi Tfh cells pre-ART (n = 26), post-ART (n = 22), and HC (n = 5) participants. **p < 0.01 by bootstrapped Welch Two Sample t-test with 10,000 iterations on full set; data are not significant unless noted. (F) cTfh cells from HC (n = 5) or post-ART HIV+ (n = 5) participants cocultured with unrelated HC CD19+ B cells. Absolute cell numbers of total B cells and B-cell subsets after 7 days in coculture. (G) Absolute numbers of cTfh cells at day 7. *p < 0.05, **p < 0.01 by Mann-Whitney U test.
Figure 3
Figure 3
B-cell subset phenotyping in PBMC. (A) Absolute counts of B-cell subsets in PBMC of HIV+ (n = 39), 6-8 weeks post-ART (n = 29) and HC (n = 19) participants. (B) Opt-SNE projections of expression of the indicated markers on CD19+ B cells pooled from a subset of participants, pre-ART (n = 11), post-ART (n = 11), and HC (n = 11). (C) Opt-SNE projection of pooled CD19+ B-cell clusters identified by FlowSOM clustering. Fifteen clusters from FlowSOM analysis were visualized as a heatmap of mean fluorescence intensity, each row as a different cluster, while columns represent analyzed markers, and frequency of B cells from each group in FlowSOM clusters indicated. *p < 0.05, **p < 0.01, ***p < 0.001, ****p < 0.0001 by bootstrapped Welch Two Sample t-test with 10,000 iterations on full set; data are not statistically significant unless noted.
Figure 4
Figure 4
B-cell subset phenotyping and surface marker expression in LN. (A) Frequencies of B-cell subsets in LNMC of pre-ART (n = 36), post-ART (n = 28), and HC (n = 19) participants. (B) Mean fluorescence intensity (MFI) evaluated for IL4R, CD80 and CD95 on LNMC B-cell subsets of pre-ART (n = 36), post-ART (n = 28), and HC (n = 19) participants. *p < 0.05, **p < 0.01, ***p < 0.001, ****p < 0.0001 by bootstrapped Welch Two Sample t-test with 10,000 iterations on full set; data are not statistically significant unless noted.
Figure 5
Figure 5
Correlation between cellular phenotypes in LNMC. (A) Correlation between frequency of GCBC and DNBC in LNMC of pre-ART (n = 31), post-ART (n = 24) and HC (n = 19) participants. (B) Correlation between frequency of Tfh cells and GCBC in LNMC of pre-ART (n = 31), post-ART (n = 25) and HC (n = 16) participants. Spearman’s rank correlation; data are not statistically significant unless noted.
Figure 6
Figure 6
LN histologic characterization. (A) Representative images of H&E staining of LN from HC, HIV+ pre- and post-ART participants (identifiers in S1 Table ) depicting the four groups: quiescent (L017 pre-ART), follicular involution with paracortical hyperplasia (L090 pre-ART and HC6), lymphocyte depletion (L061 pre-ART), and follicular hyperplasia (L003 post-ART); 20X and 100X magnification. (B) Pie charts depicting proportion of LN pre-ART (n = 21) and post-ART (n = 21) characterized as quiescent (Q), follicular involution with paracortical hyperplasia (FIPH), lymphocyte depletion (LD), follicular hyperplasia (FH), and other (OTH). s(C) Proportion of LN pre-ART (n = 17) and post-ART (n = 19) that were grouped as FH or non-FH. **p < 0.01 by Fisher’s exact test.
Figure 7
Figure 7
Transcriptional profiling on samples from PB and LN. (A) RNAseq of HIV+ participant longitudinal samples from PB (n = 12) and LN (n = 11). Differentially expressed genes pre/post ART filtered by a fold change of 1.3, then analyzed by Ingenuity pathway analysis (IPA). Listed are the most significantly enriched pathways. (B) Depiction of Type I/II interferon signaling pathway, the most enriched pathway in both PB and LN; green indicates genes significantly downregulated post-ART. (C) Principal component analysis (PCA) distinguishing PB (open) and LN (closed) compartments and pre- (green) and post- (red) ART time-points (left panel); PB (middle) and LN (right) panels distinguishing pre- (green) and post- (red) ART time-points and gender: female (triangle) and male (circle). (D) Pie chart of LN samples showing percentage of HIV+ participant samples with GC-related and non-GC-related genes that underwent a 1.3-fold or more change post-versus pre- ART. (E) Correlation matrix of fold changes of plasma biomarkers versus normalized transcripts of interferon related genes (n = 10).
Figure 8
Figure 8
BCR sequencing on samples from PB and LN. (A) Correlation between Simpson clonality in LN post-ART and the frequency of GCBC post-ART of nine HIV+ pre- and post-ART participants. *p < 0.05 by Spearman’s rank correlation. (B) Morisita index determined for PB and LN samples of nine HIV+ pre- and post-ART participants. (C) Ig heavy chain clone frequencies for nine HIV+ participants, depicted and compared at post-ART by categories defined relative to pre-ART: new for clones not previously present, expanded for clones that increased 2-fold and persistent for clones that did not change in frequency. (D) Stacked bar graphs showing the average frequency of the top 11 IGVH gene families present in PB and LN of nine HIV+ pre- and post-ART participants. (E) Frequencies of IGHV01, IGHV02 and IGHV03 families in the PB and LN of nine HIV+ pre- and post-ART participants. (F) Serum CMV antibody titers at week 0, week 4, or week 24 (n = 26). (G) CMV viral loads of 26 HIV+ at week 0, 4 or 24. *p < 0.05, **p < 0.01 by Wilcoxon signed rank test after obtaining significance by Friedman test on full set (C, E); data are not statistically significant unless noted.

References

    1. Trickey A, May M, Vehreschild JJ, Obel N, Gill J, Crane H, et al. . Survival of HIV-Positive Patients Starting Antiretroviral Therapy Between 1996 and 2013: A Collaborative Analysis of Cohort Studies. Lancet HIV (2017) 4(8):e349–56. doi: 10.1016/S2352-3018(17)30066-8 - DOI - PMC - PubMed
    1. Nakagawa F, Lodwick RK, Smith CJ, Smith R, Cambiano V, Lundgren JD, et al. . Projected Life Expectancy of People With HIV According to Timing of Diagnosis. AIDS (2012) 26(3):335–43. doi: 10.1097/QAD.0b013e32834dcec9 - DOI - PubMed
    1. Boulle A, Schomaker M, May MT, Hogg RS, Shepherd BE, Monge S, et al. . Mortality in Patients With HIV-1 Infection Starting Antiretroviral Therapy in South Africa, Europe, or North America: A Collaborative Analysis of Prospective Studies. PloS Med (2014) 11(9):e1001718. doi: 10.1371/journal.pmed.1001718 - DOI - PMC - PubMed
    1. Braitstein P, Brinkhof MW, Dabis F, Schechter M, Boulle A, Miotti P, et al. . Mortality of HIV-1-Infected Patients in the First Year of Antiretroviral Therapy: Comparison Between Low-Income and High-Income Countries. Lancet (2006) 367(9513):817–24. doi: 10.1016/S0140-6736(06)68337-2 - DOI - PubMed
    1. The Late Presentation Working Groups in Euro S . Cohere. Estimating the Burden of HIV Late Presentation and its Attributable Morbidity and Mortality Across Europe 2010–2016. BMC Infect Dis (2020) 20(1):728. doi: 10.1186/s12879-020-05261-7 - DOI - PMC - PubMed

Publication types

MeSH terms