. 2021 Dec 6:12:789748.
doi: 10.3389/fimmu.2021.789748. eCollection 2021.

A Direct MS-Based Approach to Profile Human Milk Secretory Immunoglobulin A (IgA1) Reveals Donor-Specific Clonal Repertoires With High Longitudinal Stability

Affiliations

A Direct MS-Based Approach to Profile Human Milk Secretory Immunoglobulin A (IgA1) Reveals Donor-Specific Clonal Repertoires With High Longitudinal Stability

Albert Bondt et al. Front Immunol. .

Abstract

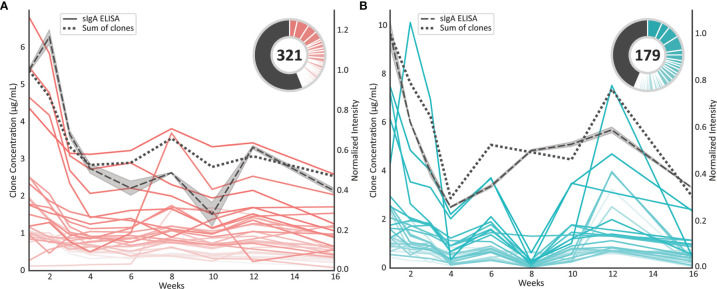
Recently, a mass spectrometry-based approach was introduced to directly assess the IgG1 immunoglobulin clonal repertoires in plasma. Here we expanded upon this approach by describing a mass spectrometry-based technique to assess specifically the clonal repertoire of another important class of immunoglobulin molecules, IgA1, and show it is efficiently and robustly applicable to either milk or plasma samples. Focusing on two individual healthy donors, whose milk was sampled longitudinally during the first 16 weeks of lactation, we demonstrate that the total repertoire of milk sIgA1 is dominated by only 50-500 clones, even though the human body theoretically can generate several orders of magnitude more clones. We show that in each donor the sIgA1 repertoire only changes marginally and quite gradually over the monitored 16-week period of lactation. Furthermore, the observed overlap in clonal repertoires between the two individual donors is close to non-existent. Mothers provide protection to their newborn infants directly by the transfer of antibodies via breastfeeding. The approach introduced here, can be used to visualize the clonal repertoire transferred from mother to infant and to detect changes in-time in that repertoire adapting to changes in maternal physiology.

Keywords: antibody response; antigen binding fragment; clonal repertoire; human milk; mass spectrometry; secretory immunoglobulin A.


Conflict of interest statement

KD was enrolled as PhD student at Utrecht University during this study and received financial support from Danone Nutricia Research. The authors declare that the research was conducted in the absence of any commercial or financial relationships that could be constructed as a potential conflict of interest.

Figures

Figure 1
Figure 1
Personalized human milk sIgA1 Fab clonal profiling. Longitudinal human milk samples were obtained, with consent, from two healthy donors across weeks 1-16 of lactation (left panel). Following efficient capture of sIgA1, using CaptureSelect IgA affinity matrix beads, we relied on the O-glycopeptidase from Akkermansia muciniphila (OgpA), cleaving N-terminally of the O-glycans that are exclusively present in the IgA1’s hinge region (top panel), to dissect and collect their Fab fragments. The protocol works equally well, for capture and digestion, for human milk sIgA1 and plasma-derived or recombinant monomeric IgA1 (middle panel). The eluted Fab molecules were subsequently mass analyzed by reversed phase LC-MS, and masses were retrieved from the generated RAW files using BioPharmaFinder with additional data analysis performed using Python (bottom panel).
Figure 2
Figure 2
Digestion by OgpA of recombinant mIgA1 and human milk sIgA1 results in highly specific cleavage and formation of Fab fragments. (A) Cartoon of an IgA1 molecule highlighting the preferred cleavage site of O-glycopeptidase from Akkermansia muciniphila (OgpA). The large yellow scalpel indicates the preferred Thr106 site, the smaller black scalpel shows the observed missed cleavage site (digestion at Thr109) adding Thr106Pro107Pro108 to the Fab sequence. (B) The boxplots show the fractional abundance of the Fab fragments resulting from the Thr109 missed cleavage as compared to the corresponding Thr106 base peak. When observed, the Thr109 missed cleavage is generally lower than 20% in abundance compared to the Thr106 peak, and almost exclusively non-glycosylated at Thr106. (C) Overnight incubation of monoclonal mIgA1 with OgpA resulted in highly selective digestion at the O-glycosylation site Thr106, as determined by the detection of the calculated mass of the Fab. Minor satellite signals were detected, originating from the missed cleavage at Thr109, carrying one HexNAc, HexNAc+Hex, or 2(HexNAc+Hex). (D) Extracted ion chromatograms of three selected Fab clones in Donor 1 week 1 that display highly selective digestion at O-glycosylation site Thr106, only one additional signal can be observed, digestion at Thr109 carrying no O-glycan at Thr106 position.
Figure 3
Figure 3
Accuracy and reproducibility of quantification of individual sIgA clones. The top 50 most intense clones from a human milk colostrum sIgA standard were quantified relative to a monoclonal mIgA1 of known quantity. The detected quantities of each clone in all samples were compared to the levels in one sample with 40 µg sIgA, and the fold-change was plotted. Replicates of the same injection amount (40 µg) showed no significant fold-change. Clone intensities in the 20 µg replicates are detected at half the abundance (-1 log2 fold change), and clone intensity in the 80 µg replicates were detected at double the abundance. Boxplots indicate the median, 25th and 75th percentile, whiskers range to 1.5 times IQR. Values inside this range are depicted as black dots. Outliers (> 1.5 times IQR) are indicated as black diamonds. Supplemental Figure S2 depicts similar boxplots, considering all clones detected in all replicates (n=128) instead of the top50 most intense clones shown here.
Figure 4
Figure 4
Human milk sIgA1 clonal profiles are stable over time, and highly unique for every donor. (A) Illustrative deconvoluted Fab mass profiles with the top two originating from donor 1 with milk obtained at weeks 1 and 2, and the bottom two originating from donor 2 with milk obtained at weeks 1 and 2. Each peak represents a unique Fab (based on unique RT/mass pair) and the peak height represents the concentration of that clone in the milk. The sIgA1 profiles obtained at all other time points are provided in Supplemental Figure S5 . Clearly, just a limited number of distinct clones dominate the sIgA1 repertoire in each of the two donors. (B) Observed overlap in clonal sIgA1 repertoires within and in between donors. The persistence of repertoires is given as a percentage of the total sIgA1 clone abundance. Each small square depicts a percentage, as indicated by the color bar, of overlap between the samples. The inset depicts a zoom-in of the data for the profiles shown in (A), annotated with the overlap values. The overlap in the sIgA1 repertoire is ~80% when comparing samples of the same donor, even when samples were collected as much as 16 weeks apart. Between donors hardly any overlap in the repertoires is observed (below ~10%), whereby even each clone seems to be uniquely detected in just one of the donors.
Figure 5
Figure 5
Concentration profiles of individual sIgA1 clones compared to the total sIgA concentration profile. (A) Longitudinal individual sIgA1 concentration profiles observed for donor 1. Each pink line represents a unique sIgA1 clone. The dotted black line represents the summed concentrations over all detected sIgA1 clones, whereas the dashed black line represents the total sIgA concentration as evaluated by an independent sandwich ELISA. The relative abundance of the top 30 clones at week 1 are shown in the pie charts, where the number in the center indicates the total number of clones that could be monitored longitudinally. For these analyses clones were included when present in at least 7 of the 9 time points. The top 30 clones each have a slice in the pie chart and the remainder of the clones are depicted as black pie slice. (B) As in A) individual sIgA1 concentration profiles observed for donor 2. Each blue line represents a unique sIgA1 clone.

References

    1. Kumar N, Arthur CP, Ciferri C, Matsumoto ML. Structure of the Secretory Immunoglobulin A Core. Science (2020) 367(6481):1008–14. doi: 10.1126/science.aaz5807 - DOI - PubMed
    1. Khan SR, Chaker L, Ikram MA, Peeters RP, van Hagen PM, Dalm V. Determinants and Reference Ranges of Serum Immunoglobulins in Middle-Aged and Elderly Individuals: A Population-Based Study. J Clin Immunol (2021) 41:1902–14. doi: 10.1007/s10875-021-01120-5 - DOI - PMC - PubMed
    1. Lonnerdal B, Erdmann P, Thakkar SK, Sauser J, Destaillats F. Longitudinal Evolution of True Protein, Amino Acids and Bioactive Proteins in Breast Milk: A Developmental Perspective. J Nutr Biochem (2017) 41:1–11. doi: 10.1016/j.jnutbio.2016.06.001 - DOI - PubMed
    1. Czosnykowska-Łukacka M, Lis-Kuberka J, Królak-Olejnik B, Orczyk-Pawiłowicz M. Changes in Human Milk Immunoglobulin Profile During Prolonged Lactation. Front Pediatr (2020) 8:428. doi: 10.3389/fped.2020.00428 - DOI - PMC - PubMed
    1. de Sousa-Pereira P, Woof JM. IgA: Structure, Function, and Developability. Antibodies (Basel) (2019) 8(4):57. doi: 10.3390/antib8040057 - DOI - PMC - PubMed

Publication types

LinkOut - more resources