. 2021 Sep 12;3(12):1020-1033.
doi: 10.1096/fba.2021-00030. eCollection 2021 Dec.

KDM4B promotes acute myeloid leukemia associated with AML1-ETO by regulating chromatin accessibility

Affiliations

KDM4B promotes acute myeloid leukemia associated with AML1-ETO by regulating chromatin accessibility

Takeshi Ueda et al. FASEB Bioadv. .

Abstract

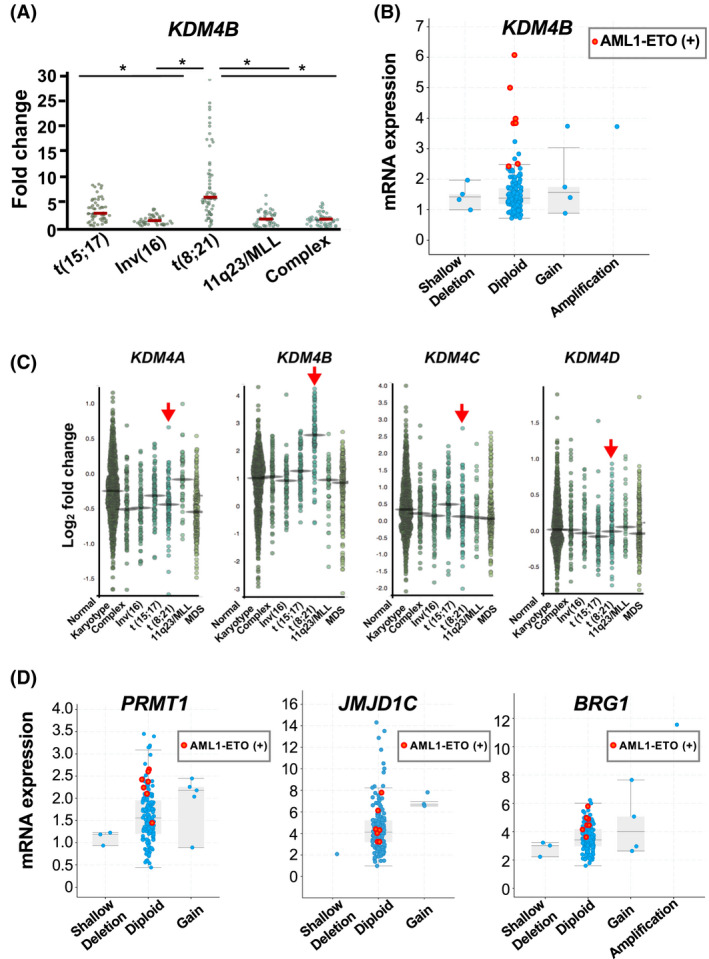
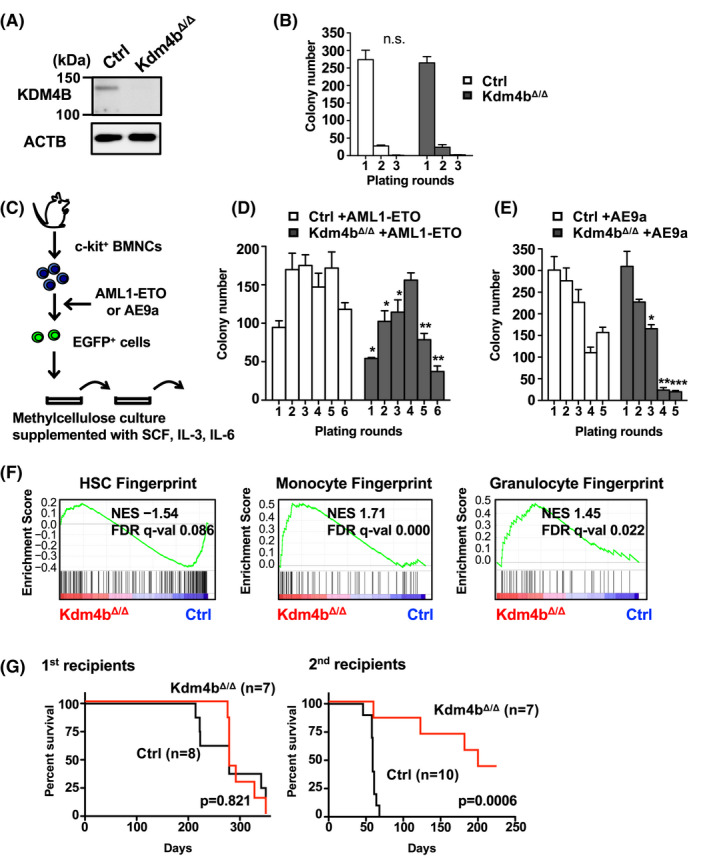
Epigenetic alterations of chromatin structure affect chromatin accessibility and collaborate with genetic alterations in the development of cancer. Lysine demethylase 4B (KDM4B) has been identified as a JmjC domain-containing epigenetic modifier that possesses histone demethylase activity. Although recent studies have demonstrated that KDM4B positively regulates the pathogenesis of multiple types of solid tumors, the tissue specificity and context dependency have not been fully elucidated. In this study, we investigated gene expression profiles established from clinical samples and found that KDM4B is elevated specifically in acute myeloid leukemia (AML) associated with chromosomal translocation 8;21 [t(8;21)], which results in a fusion of the AML1 and the eight-twenty-one (ETO) genes to generate a leukemia oncogene, AML1-ETO fusion transcription factor. Short hairpin RNA-mediated KDM4B silencing significantly reduced cell proliferation in t(8;21)-positive AML cell lines. Meanwhile, KDM4B silencing suppressed the expression of AML1-ETO-inducible genes, and consistently perturbed chromatin accessibility of AML1-ETO-binding sites involving altered active enhancer marks and functional cis-regulatory elements. Notably, transduction of murine KDM4B orthologue mutants followed by KDM4B silencing demonstrated a requirement of methylated-histone binding modules for a proliferative surge. To address the role of KDM4B in leukemia development, we further generated and analyzed Kdm4b conditional knockout mice. As a result, Kdm4b deficiency attenuated clonogenic potential mediated by AML1-ETO and delayed leukemia progression in vivo. Thus, our results highlight a tumor-promoting role of KDM4B in AML associated with t(8;21).

Keywords: acute myeloid leukemia; chromatin accessibility; gene expression analysis; gene targeting.


Conflict of interest statement

The authors declare no competing financial interests.

Figures

FIGURE 1
FIGURE 1
KDM4B is elevated specifically in AML associated with t(8;21). (A, B) Elevated KDM4B expression in human t(8;21) AML. Gene expression data from GSE6891 (A) and TCGA‐AML (B) were analyzed using BloodSpot (A) and cBioPortal (B), respectively. The red horizontal bars in (A) indicate the median values (*p < 0.001). The cases with AML1ETO fusion gene are indicated as orange dots in (B). The horizontal axis in (B) indicates putative copy‐number alterations from GISTIC. (C) KDM4A–KDM4D expression in different cytogenetic groups of human AML and MDS. Red arrows indicate t(8;21) AML. The data from GSE13159, GSE15434, GSE61804, GSE14468, and TCGA‐AML were analyzed using BloodSpot. MDS, myelodysplastic syndromes. (D) PRMT1, JMJD1C, and BRG1 (SMARCA4) expression in human AML. The data were analyzed using cBioPortal. The AML1ETO‐positive cases were indicated as orange dots. Neither significant co‐occurrence nor mutual exclusivity was detected (Fisher's exact test with p > 0.05) [Colour figure can be viewed at wileyonlinelibrary.com]
FIGURE 2
FIGURE 2
KDM4B silencing reduces cell proliferation in t(8;21)‐positive AML cell lines, coupled with impaired AML‐ETO‐mediated gene regulation and HSC gene signature. (A) Immunoblot showing KDM4B protein expression in AML cell lines using an anti‐KDM4B antibody. ACTB (β‐actin) was used as a loading control. (B) Immunoblot showing decreased KDM4B protein levels in SKNO‐1 cells stably infected with either of the two different shKDM4B (sh#1, sh#2) lentiviruses (top) and Wright–Giemsa‐stained cytospins of SKNO‐1 (bottom). (C) Anti‐proliferative effect of KDM4B silencing in t(8;21)‐positive and KDM4B‐high SKNO‐1 cells. Control shRNA (SCR), KDM4B sh#1‐, or sh#2‐transduced cells were seeded, and the cell number was counted on the indicated days. Error bars indicate SD. *p < 0.001. (D) Growth curves of t(8;21)‐positive and KDM4B‐low Kasumi‐1 cell line upon KDM4B and BRG1 silencing, respectively. Error bars indicate SD. *p < 0.005. (E) Immunoblot showing KDM4B protein expression in KG‐1a and U937 cells. ACTB (β‐actin) was used as a loading control. (F) Growth curves showing no significant growth suppressive effect of KDM4B silencing on t(8;21)‐negative KG‐1a and U937 cells. (G) GSEA plot showing a significantly increased expression of AML1‐ETO‐downregulated genes of human HSC (Genes downregulated by AML1‐ETO_HSC) in KDM4B‐silenced SKNO‐1 (left) and Kasumi‐1 (right). FDR, false discovery rate; NES, normalized enrichment score; SCR, control shRNA; shKDM4B, KDM4B sh#1 and sh#2. (H) GSEA plot showing a significant upregulation of human HSC under‐expressed genes (Hematopoietic stem cell_Down) in KDM4B‐silenced SKNO‐1 (left) and Kasumi‐1 (right). (I) GSEA plot for SKNO‐1 showing a decreased expression of AE‐upregulated genes of human HSCs (Genes upregulated by AML1‐ETO_HSC) (left) and an increased expression of AE‐downregulated genes of human monocytes (Genes downregulated by AML1‐ETO_MONOCYTE) (right) by KDM4B silencing. (J) GSEA plot showing comparable expression of MYC‐targets (MYC1_Q2 from MSigDB) in KDM4B‐silenced SKNO‐1 and SCR‐transduced control cells. GSEA, gene set enrichment analysis; HSC, hematopoietic stem cell; SD, standard deviation [Colour figure can be viewed at wileyonlinelibrary.com]
FIGURE 3
FIGURE 3
KDM4B preferentially regulates the chromatin accessibility of AML1‐ETO‐binding sites including enhancer histone mark deposition and functional gene regulatory regions. (A) Representative accessible chromatin sites identified using MACS2 peak caller following ATAC‐seq (I, II, and III, indicated by rectangles). I, SCR‐specific accessible chromatin sites (named abolished OCRs); II, accessible chromatin sites shared by SCR and KDM4B silencing (sh#1 and sh#2) (named unaltered OCRs); III, KDM4B silencing (sh#1 and sh#2)‐specific accessible chromatin sites (named gained OCRs). (B) Venn diagram showing the distribution of accessible chromatin sites of the three groups as indicated in (A). (C) ChIP signal distribution for AML1‐ETO (left) and AML1 (right) on the indicated accessible chromatin sites in SKNO‐1. (D) Box plot showing the “averaged read count per million mapped reads” values of the ChIP signal across the 5′ to 3′ ends of the accessible chromatin sites in (C), calculated using ngs.plot (line at median, Wilcoxon matched‐pairs signed‐rank test). *p < 0.0001. (E) ChIP signal distribution for enhancer histone marks H3K4me1 (left) and H3K27Ac (right) on the indicated accessible chromatin sites in SKNO‐1. (F) Box plot showing the “averaged read count per million mapped reads” values of the ChIP signal from −3000 to +3000 bp of the accessible chromatin sites in (E), calculated using ngs.plot (line at median, Wilcoxon matched‐pairs signed‐rank test). *p < 0.0001. (G) Bar graph showing the enrichment score (−log10[p value]) of significantly enriched annotations of GO biological processes (left) and MSigDB pathway (right) in accessible chromatin sites that were abolished and gained by KDM4B silencing. ChIP, chromatin immunoprecipitation; GO, gene ontology; OCR, open chromatin region [Colour figure can be viewed at wileyonlinelibrary.com]
FIGURE 4
FIGURE 4
Murine KDM4B mutants lacking double PHD or Tudor domain do not confer a proliferative surge on the human KDM4B silencing in SKNO‐1 cells. (A) Domain structure of murine KDM4B proteins encoded by the wild‐type (WT) and mutant Kdm4b cDNA used in this study. The WT murine KDM4B protein (NCBI RefSeq: NP_742144) consists of 1086 amino acids. A triple FLAG tag sequence (3xFLAG) was introduced after the ATG starting codon. The regions indicated by dotted lines were deleted. The position of His189Ala is indicated by an asterisk. aa, amino acids; CM, catalytic mutant; Pro‐rich, proline‐rich region; PHD, plant homeodomain. (B) Immunoblot showing KDM4B silencing (sh#2) upon the expression of the triple FLAG (3xFLAG)‐tagged murine wild‐type or a series of mutated KDM4B proteins in SKNO‐1 cells. Asterisks indicate bands derived from the transduced murine proteins. Red arrowheads indicate positions of the transduced 3xFLAG‐tagged proteins as shown in (A). EV, empty vector. (C) Growth curves of the indicated transduced SKNO‐1 cells. SKNO‐1 cells were transduced with empty vector or a series of mutated Kdm4b cDNA in (A), followed by KDM4B knockdown using shRNA #2 against human KDM4B. Error bars indicate SD. *p < 0.05 (vs. EV/ sh#2, ΔTudor/sh#2, ΔPHD/sh#2 and WT/sh#2, respectively); **p < 0.005 (vs. WT/ sh#2). SD, standard deviation [Colour figure can be viewed at wileyonlinelibrary.com]
FIGURE 5
FIGURE 5
Kdm4b deficiency in mice reduces colony‐replating capacity and delays leukemia development associated with t(8;21) fusion genes. (A) Immunoblot showing decreased amounts of KDM4B protein in bone marrow mononucleated cells in Kdm4b Δ/Δ mice. (B) Comparable colony‐forming ability of c‐Kit+ HSC/progenitor cells from Ctrl or Kdm4bΔ / Δ mice in methylcellulose culture (MethoCult GF M3534). c‐Kit+ cells were plated initially at 1 × 104 cells per plate. Colonies were counted 7 days post‐plating and then replated at 1 × 104 cells every 7 days. Error bars indicate SD. n.s., not significant. (C) Schematic illustration of the colony‐replating assay procedure for (D, E). (D, E) Reduced colony‐replating capacity of Kdm4bΔ / Δ c‐Kit+ HSC/progenitor cells transduced with AML1‐ETO (D) and AE9a (E). The cells were initially plated at 1 × 104. Colonies were then counted 7 days post‐plating and then replated at 2 × 104 cells every 7 days. Error bars indicate SD. *p < 0.05; **p < 0.005; ***p < 0.0005. n.s., not significant. (F) GSEA plot showing significant downregulation of HSC‐fingerprint genes and upregulation of differentiated genes in AML1‐ETO‐transduced Kdm4bΔ / Δ colony‐forming cells. The plots for hematopoietic fingerprint genes of mouse HSC (HSC Fingerprint) (left), monocyte (Monocyte Fingerprint) (middle), and granulocyte (Granulocyte Fingerprint) (right) populations are shown. NES, normalized enrichment score; FDR, false discovery rate. (G) Impaired leukemia progression in the Kdm4b deficiency model. Kaplan–Meier survival curves of mice transplanted with AE9a‐transduced Ctrl or Kdm4bΔ / Δ cells in primary (left) [median survival: Ctrl = 279 days (n = 8), Kdm4bΔ / Δ  = 279 days (n = 7); p = 0.821 (log‐rank test)] and secondary (right) [median survival: Ctrl = 59 days (n = 10), Kdm4bΔ / Δ  = 200 days (n = 7); p = 0.0006 (log‐rank test)] transplantation assays. HSC, hematopoietic stem cell; SD, standard deviation [Colour figure can be viewed at wileyonlinelibrary.com]

Similar articles

Cited by

References

    1. Berdasco M, Esteller M. Aberrant epigenetic landscape in cancer: how cellular identity goes awry. Dev Cell. 2010;19:698‐711. - PubMed
    1. Zentner GE, Henikoff S. Regulation of nucleosome dynamics by histone modifications. Nat Struct Mol Biol. 2013;20:259‐266. - PubMed
    1. Berry WL, Janknecht R. KDM4/JMJD2 histone demethylases: epigenetic regulators in cancer cells. Cancer Res. 2013;73:2936‐2942. - PMC - PubMed
    1. Kawazu M, Saso K, Tong KI, et al. Histone demethylase JMJD2B functions as a co‐factor of estrogen receptor in breast cancer proliferation and mammary gland development. PLoS One. 2011;6:e17830. - PMC - PubMed
    1. Greenblatt SM, Nimer SD. Chromatin modifiers and the promise of epigenetic therapy in acute leukemia. Leukemia. 2014;28:1396‐1406. - PMC - PubMed