. 2022 Mar 19;32(2):136-147.
doi: 10.1093/glycob/cwab111.

Antigen presenting cell response to polysaccharide A is characterized by the generation of anti-inflammatory macrophages

Affiliations

Antigen presenting cell response to polysaccharide A is characterized by the generation of anti-inflammatory macrophages

Julie Y Zhou et al. Glycobiology. .

Abstract

Polysaccharide A (PSA) is the immunodominant capsular carbohydrate from the gram negative commensal microbe Bacteroides fragilis that has shown remarkable potency in ameliorating many rodent models of inflammatory disease by eliciting downstream suppressive CD4+ T cells. PSA is composed of a zwitterionic repeating unit that allows it to be processed by antigen presenting cells (APCs) and presented by MHCII in a glycosylation-dependent manner. While previous work has uncovered much about the interactions between MHCII and PSA, as well as the downstream T cell response, little is known about how PSA affects the phenotype of MHCII+ APCs, including macrophages. Here, we utilized an unbiased systems approach consisting of RNAseq transcriptomics, high-throughput flow cytometry, Luminex analysis and targeted validation experiments to characterize the impact of PSA-mediated stimulation of splenic MHCII+ cells. The data revealed that PSA potently elicited the upregulation of an alternatively activated M2 macrophage transcriptomic and cell surface signature. Cell-type-specific validation experiments further demonstrated that PSA-exposed bone marrow-derived macrophages (BMDMs) induced cell surface and intracellular markers associated with M2 macrophages compared with conventional peptide ovalbumin (ova)-exposed BMDMs. In contrast to macrophages, we also found that CD11c+ dendritic cells (DCs) upregulated the pro-T cell activation costimulatory molecule CD86 following PSA stimulation. Consistent with the divergent BMDM and DC changes, PSA-exposed DCs elicited an antigen-experienced T cell phenotype in co-cultures, whereas macrophages did not. These findings collectively demonstrate that the PSA-induced immune response is characterized by both T cell stimulation via presentation by DCs, and a previously unrecognized anti-inflammatory polarization of macrophages.

Keywords: RNAseq; immune regulation; macrophage; polysaccharide; transcriptomics.


Figures

Fig. 1
Fig. 1
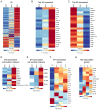
PSA-exposure shows transcriptomic and proteomic changes consistent with antigen presentation. (A) GSEA of PSA-stimulated MHCII+ cells associated with antigen processing and presentation of peptide or polysaccharide antigen via MHCII. (B) PCA of 255 surface proteins on MHCII+ cells after 0, 1 and 7 days of co-culture with CD4+ T cells and PSA supplementation. (C) Cell surface expression of I-A/I-E on MHCII+ cells after no culture or 7 days of culture with CD4+ T cells and PSA supplementation.
Fig. 2
Fig. 2
Unbiased analyses of RNAseq identifie that PSA alters M1- and M2-associated pathways. (A) GO analysis of genes with increased expression following PSA exposure in MHCII+ cells. GO terms of biological processes significantly increased were plotted as −log10. (B) Volcano plot of genes after MHCII+ cells was cultured with PSA for 24 h highlights the downregulation of genes associated macrophage activation. (C) GSEA of PSA stimulated cells according to genes that are associated with M2 macrophage polarization and (D) enriched in M1 macrophage polarization.
Fig. 3
Fig. 3
Gene set enrichment analyses suggest skewing toward M2-associated cellular processes. GSEA showing (A) enrichment of mTORC1 signaling, PI3K-AKT–mTOR signaling, peroxisome pathway and reactive oxygen species pathway, (B) downregulation of TGFβ signaling and angiogenesis and (C) upregulation in TNFα signaling.
Fig. 4
Fig. 4
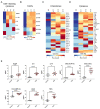
Cell surface proteomic analyses show a mosaic response. (A) Cell surface marker expression of PSA-exposed MHCII+ cells identified immunomodulatory markers. High-throughput flow cytometry of MHCII+ cells co-cultured with CD4+ T cells and PSA collected at days 0, 1 and 7. Data shown are M(edian)FI from MHCII+ cells. (A) Heatmap of all 255 cell surface markers at D0, D1 and D7. (B) Top 20 increased and (C) decreased on day 7 compared with day 0. (D) M2- and (E) M1-associated cell surface markers. (F) RNA expression of M1- and (G) M2-associated genes in MHCII+ cells cultured with PSA.
Fig. 5
Fig. 5
PSA upregulates factors that recruit T cells and induce Tregs, Th1 and Th17. (A) Heatmaps of RNAseq RPKM values of MHCII+ cells cultured with PSA showing CD4+ skewing cytokines, (B) STAT signaling molecules, (C) chemokines and (D) cytokines. (E) Profile of significantly different soluble factors secreted by PSA-exposed MHCII+ cells as determined by Mouse Cytokine/Chemokine 32-plex Luminex analysis after 24 hours of culture.
Fig. 6
Fig. 6
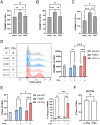
PSA elicits an M2-like phenotype in BMDMs compared with conventional peptide antigen. BMDMs were cultured with or without PSA, ova peptide, M1- (LPS + IFNγ) or M2- (IL-4) polarizing factors for 24 hours, then analyzed by flow cytometry. After gating F4/80+ cells, the histograms and statistical analyses for (A) CD86, (B) PDL2, (C) CD301 and (D) CD206 are shown. (E) Relative expression levels of M2-associated genes of BMDMs cultured with PSA or ova peptide for 24 hours.
Fig. 7
Fig. 7
The effect of PSA differs by MHCII+ cell type. F4/80+ and F4/80 cells from freshly harvested spleens were purified, and MHCII+ cells were further sorted from the F4/80 fraction and cultured with or without ova or PSA. After 24 hours, flow cytometric analysis of CD86 expression was determined for (A) F4/80+ macrophages, (B) CD19+ B cells and (C) CD11c+ DCs. (D) Splenic F4/80+ macrophages and CD11c+ DCs were purified and co-cultured with splenic CD4+ T cells with or without PSA as indicated. CD44 MFI (and percentage change of CD44 MFI from T cells cultured without APCs and PSA) or (E) frequency of CD62CD44+ T cells (Tem) of CD4+ cells were analyzed by flow cytometry. (E) BMDMs were co-cultured with purified splenic CD4+ T cells with or without PSA and the frequency of Tem cells was quantified by flow cytometry.

References

    1. Alvarez CA, Cobb BA. 2019. Purification of capsular polysaccharide complex from gram-negative bacteria. Methods Mol Biol. 1954:25–35. - PubMed
    1. Alvarez CA, Jones MB, Hambor J, Cobb BA. 2020. Characterization of polysaccharide a response reveals interferon responsive gene signature and immunomodulatory marker expression. Front Immunol. 11:556813. - PMC - PubMed
    1. Amend SR, Valkenburg KC, Pienta KJ. 2016. Murine hind limb long bone dissection and bone marrow isolation. J Vis Exp. (110):53936. 10.3791/53936. - DOI - PMC - PubMed
    1. Bieniasz-Krzywiec P, Martín-Pérez R, Ehling M, García-Caballero M, Pinioti S, Pretto S, Kroes R, Aldeni C, di Matteo M, Prenen H et al. 2019. Podoplanin-expressing macrophages promote lymphangiogenesis and lymphoinvasion in breast cancer. Cell Metab. 30(5):917–936.e10. - PMC - PubMed
    1. Cobb BA, Kasper DL. 2005. Zwitterionic capsular polysaccharides: The new MHCII-dependent antigens. Cell Microbiol. 7(10):1398–1403. - PubMed

Publication types