. 2021 Dec 23:10:e73080.
doi: 10.7554/eLife.73080.

Anopheles salivary antigens as serological biomarkers of vector exposure and malaria transmission: A systematic review with multilevel modelling

Affiliations

Anopheles salivary antigens as serological biomarkers of vector exposure and malaria transmission: A systematic review with multilevel modelling

Ellen A Kearney et al. Elife. .

Abstract

Background: Entomological surveillance for malaria is inherently resource-intensive and produces crude population-level measures of vector exposure which are insensitive in low-transmission settings. Antibodies against Anopheles salivary proteins measured at the individual level may serve as proxy biomarkers for vector exposure and malaria transmission, but their relationship is yet to be quantified.

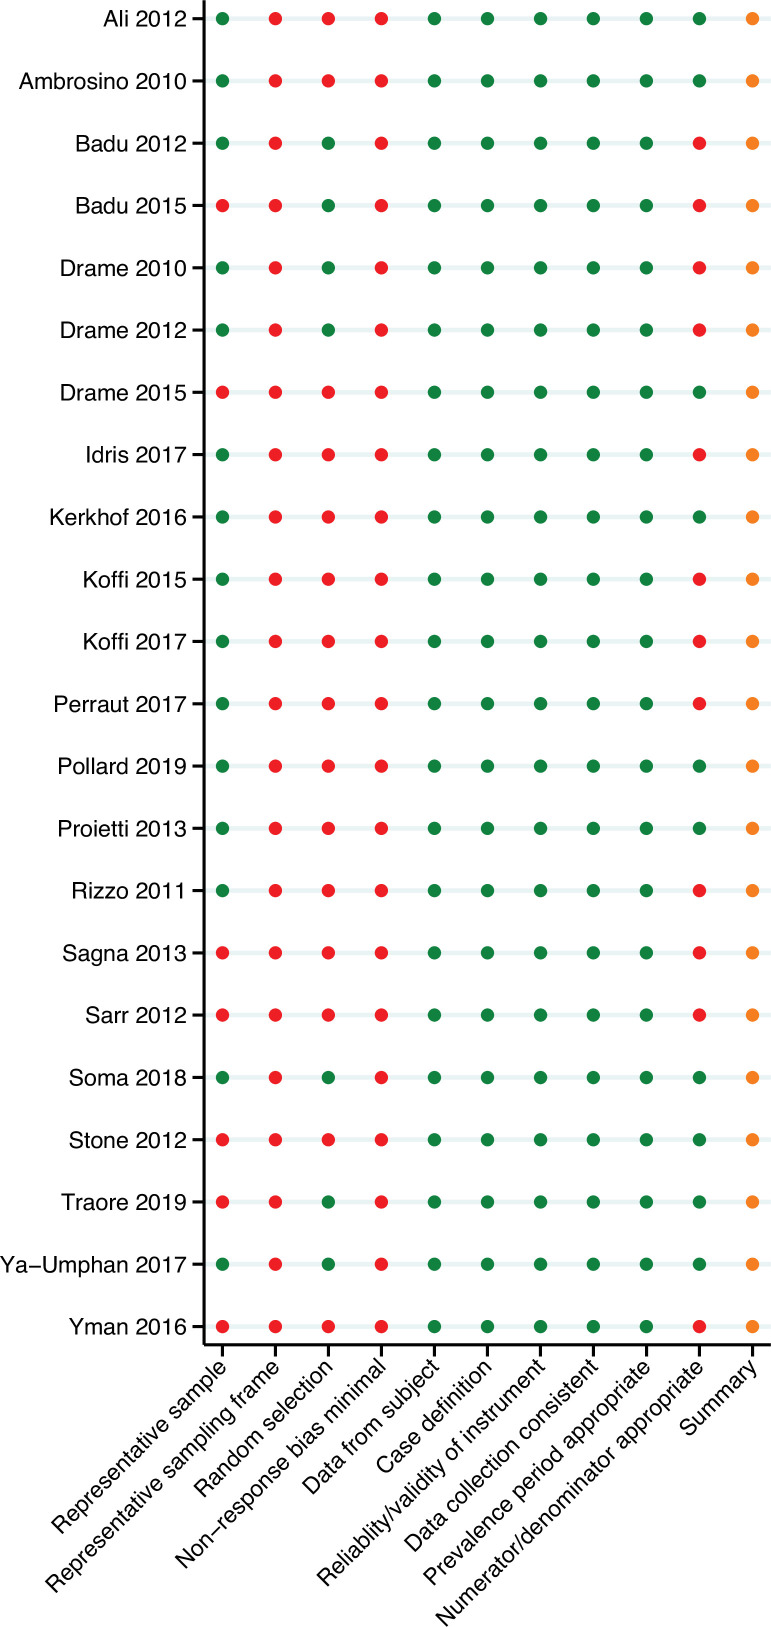
Methods: A systematic review of studies measuring antibodies against Anopheles salivary antigens (PROSPERO: CRD42020185449). Multilevel modelling (to account for multiple study-specific observations [level 1], nested within study [level 2], and study nested within country [level 3]) estimated associations between seroprevalence with Anopheles human biting rate (HBR) and malaria transmission measures.

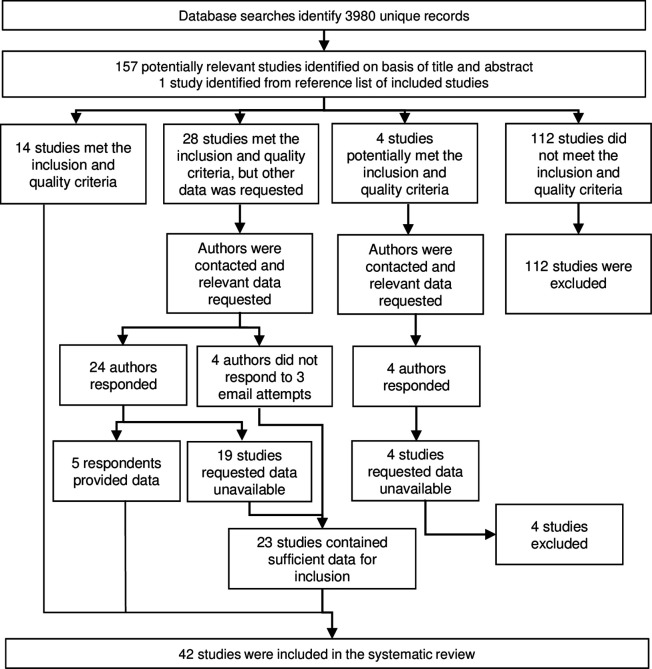
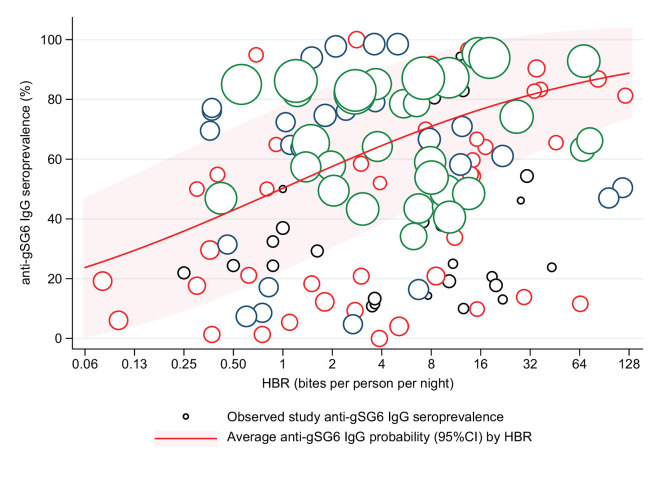
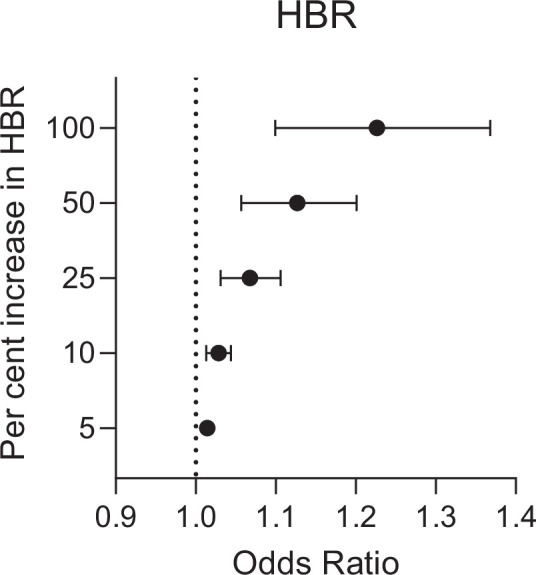
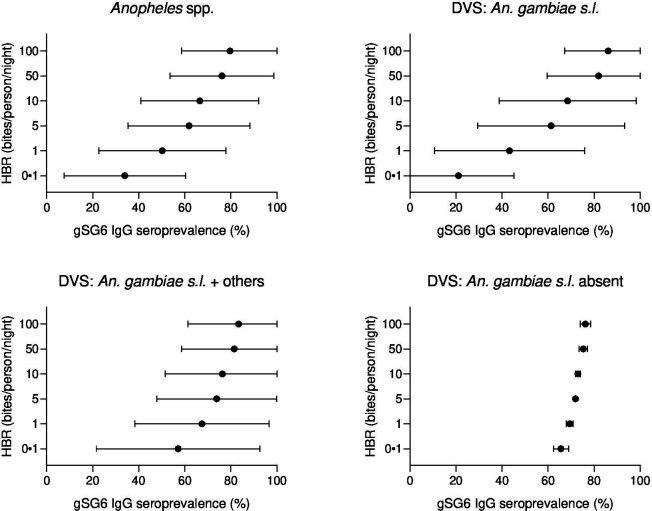
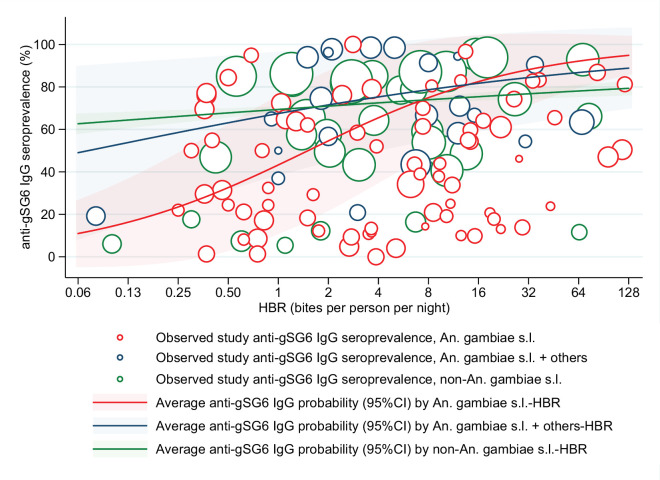
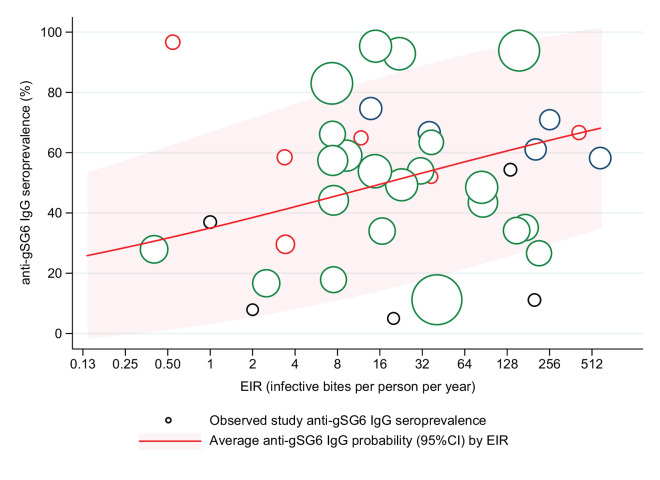
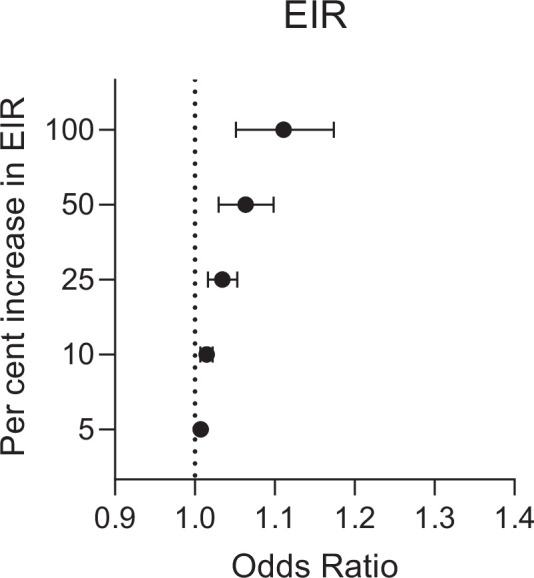
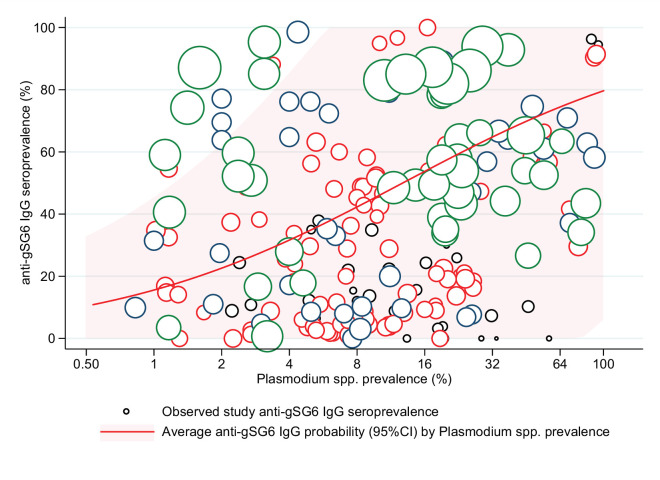
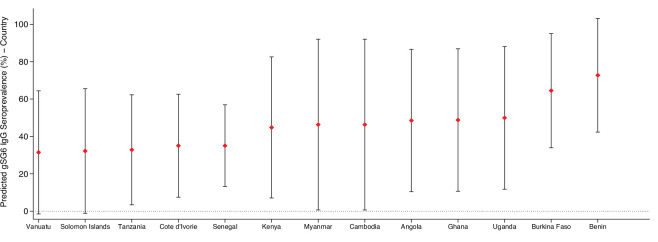
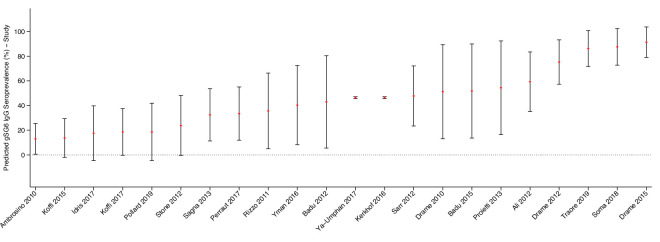
Results: From 3981 studies identified in literature searches, 42 studies across 16 countries were included contributing 393 study-specific observations of anti-Anopheles salivary antibodies determined in 42,764 samples. A positive association between HBR (log transformed) and seroprevalence was found; overall a twofold (100% relative) increase in HBR was associated with a 23% increase in odds of seropositivity (OR: 1.23, 95% CI: 1.10-1.37; p<0.001). The association between HBR and Anopheles salivary antibodies was strongest with concordant, rather than discordant, Anopheles species. Seroprevalence was also significantly positively associated with established epidemiological measures of malaria transmission: entomological inoculation rate, Plasmodium spp. prevalence, and malarial endemicity class.

Conclusions: Anopheles salivary antibody biomarkers can serve as a proxy measure for HBR and malaria transmission, and could monitor malaria receptivity of a population to sustain malaria transmission. Validation of Anopheles species-specific biomarkers is important given the global heterogeneity in the distribution of Anopheles species. Salivary biomarkers have the potential to transform surveillance by replacing impractical, inaccurate entomological investigations, especially in areas progressing towards malaria elimination.

Funding: Australian National Health and Medical Research Council, Wellcome Trust.

Keywords: Anopheles; P. falciparum; SG6; epidemiology; global health; salivary antigens; salivary biomarkers; systematic review.


Conflict of interest statement

EK, PA, VC, JC, JS, FF No competing interests declared

Figures

Figure 1.
Figure 1.. Flow diagram of study identification.
Excluded studies are detailed in Appendix 3.
Figure 2.
Figure 2.. Association between anti-gSG6 IgG seroprevalence and log2 human biting rate (HBR).
Figure shows the observed anti-gSG6 (either recombinant or peptide form) IgG seroprevalence (%) and HBR for each study-specific observation, as well as the predicted average anti-gSG6 IgG seroprevalence (predicted probability for the average study and country) with 95% confidence intervals (95% CI). Circles are proportional to the size of the sample for each study-specific observation, with colours indicating sample size: black (<50), red (50–100), navy (100–150), and green (>150). Association estimated using generalised linear multilevel modelling (mixed effects, logistic) to account for the hierarchical nature of the data, where study-specific anti-gSG6 IgG observations are nested within study and study is nested within country (model output shown in Appendix 4; p<0.001).
Figure 2—figure supplement 1.
Figure 2—figure supplement 1.. Estimated relative change in odds of anti-gSG6 IgG seropositivity (95% confidence interval) for given relative percent increases in human biting rate (HBR) (bites/person/night).
HBR has been log transformed to account for the non-linear relationship between HBR and log odds of gSG6 IgG seropositivity, where a 100% relative increase in HBR corresponds to a twofold increase in HBR. Estimated using generalised linear multilevel modelling (mixed effects, logistic) of the association between anti-gSG6 IgG seropositivity and log HBR, with random effects for country-specific and study-specific heterogeneity in gSG6 IgG seroprevalence and study-specific heterogeneity in effect of HBR (see Appendix 4).
Figure 3.
Figure 3.. Forest plots of predicted anti-gSG6 IgG seroprevalence (%) and Anopheles species-specific human biting rate (HBR).
Panels show the predicted average anti-gSG6 IgG seroprevalence (predicted probability for the average study and country) with 95% confidence intervals for given HBR, for all Anopheles spp. (using model output from Appendix 4) and for specific-dominant vector species (DVS): where An. gambiae s.l. is the only DVS, where other DVS were present in addition to An. gambiae s.l. and where An. gambiae s.l. was absent (using model output from Appendix 5).
Figure 3—figure supplement 1.
Figure 3—figure supplement 1.. Association between anti-gSG6 IgG seroprevalence and Anopheles species-specific log2 human biting rate (HBR).
Figure shows the observed anti-gSG6 (either recombinant or peptide form) IgG seroprevalence (%) and HBR for each study-specific observation coloured by dominant vector species (DVS), as well as the predicted average anti-gSG6 IgG seroprevalence (predicted probability for the average study and country) with 95% confidence intervals (95% CI). Coloured circles and lines denote DVS, with red indicating where An. gambiae s.l. is the only DVS, navy where other DVS were present in addition to An. gambiae s.l., and green where An. gambiae s.l. was absent. Circles are proportional to the size of the sample for each study-specific estimate. Association estimated using generalised linear multilevel modelling (mixed effects, logistic) to account for the hierarchical nature of the data, where study-specific anti-gSG6 IgG observations, are nested within study, and study is nested within country.
Figure 4.
Figure 4.. Association between anti-gSG6 IgG seroprevalence and log2 entomological inoculation rate (EIR).
Figure shows the observed anti-gSG6 (either recombinant or peptide form) IgG seroprevalence (%) and EIR for each study-specific observation, as well as the predicted average anti-gSG6 IgG seroprevalence (predicted probability for the average study and country) with 95% confidence intervals (95% CI). Circles are proportional to the size of the sample for each study-specific estimate, with colours indicating sample size: black (<50), red (50–100), navy (100–150), and green (>150). Association estimated using generalised linear multilevel modelling (mixed effects, logistic) to account for the hierarchical nature of the data, where study-specific anti-gSG6 IgG observations are nested within study and study is nested within country (model output shown in Appendix 6; p<0.001).
Figure 4—figure supplement 1.
Figure 4—figure supplement 1.. Estimated change in odds of anti-gSG6 IgG seropositivity (95% confidence interval) for given relative percent increases in entomological inoculation rate (EIR) (infective bites/person/night).
EIR has been log transformed to account for the non-linear relationship between EIR and log odds of gSG6 IgG seropositivity, where a 100% relative increase in EIR corresponds to a twofold increase in EIR. Estimated using generalised linear multilevel modelling (mixed effects, logistic) of the association between anti-gSG6 IgG seropositivity and log EIR, with random effects for country-specific and study-specific heterogeneity in gSG6 IgG seroprevalence and study-specific heterogeneity in effect of EIR (see Appendix 6).
Figure 5.
Figure 5.. The association between anti-gSG6 IgG seroprevalence (%) and log2 Plasmodium spp. prevalence (%).
Figure shows the observed anti-gSG6 (either recombinant or peptide form) IgG seroprevalence (%) and prevalence of any Plasmodium spp. infection (%) for each study-specific observation, as well as the predicted average anti-gSG6 IgG seroprevalence (predicted probability for average study) with 95% confidence intervals (95% CI). Circles are proportional to the size of the sample for each study-specific observation, with colours indicating sample size: black (<50), red (50–100), navy (100–150), and green (>150). Association estimated using generalised linear multilevel modelling (mixed effects, logistic) to account for the hierarchical nature of the data, where study-specific anti-gSG6 IgG observations are nested within study. See Appendix 7 for model output.
Appendix 2—figure 1.
Appendix 2—figure 1.. Risk of bias assessment.
Red, high risk; orange, moderate risk; green, low risk.
Appendix 9—figure 1.
Appendix 9—figure 1.. Predicted gSG6 IgG seroprevalence by country.
Predicted probabilities of gSG6 IgG seropositivity including country-specific random effects with 95% confidence intervals. Estimated from intercept-only three-level random-effects logistic regression to account for the hierarchical nature of the data, with study-specific anti-gSG6 IgG observation nested within study nested within country. Based upon n = 301 study-specific observations from 22 studies. Of note, nine studies that measured IgG antibodies to gSG6 were excluded from this analysis as eight only reported gSG6 IgG levels and one was a case–control study.
Appendix 9—figure 2.
Appendix 9—figure 2.. Predicted gSG6 IgG seroprevalence by study.
Predicted probabilities of gSG6 IgG seropositivity including study-specific random effects with 95% confidence intervals. Estimated from intercept-only three-level random-effects logistic regression to account for the hierarchical nature of the data, with study-specific anti-gSG6 IgG observation nested within study nested within country. Based upon n = 301 study-specific observations from 22 studies. Of note, nine studies that measured IgG antibodies to gSG6 were excluded from this analysis as eight only reported gSG6 IgG levels and one was a case–control study.

References

    1. Abonuusum A, Owusu-Daako K, Tannich E, May J, Garms R, Kruppa T. Malaria transmission in two rural communities in the forest zone of Ghana. Parasitology Research. 2011;108:1465–1471. doi: 10.1007/s00436-010-2195-1. - DOI - PubMed
    1. Aka KG, Traoré DF, Sagna AB, Zoh DD, Assi SB, Tchiekoi BN, Adja AM, Remoue F, Poinsignon A. Pattern of antibody responses to Plasmodium falciparum antigens in individuals differentially exposed to Anopheles bites. Malaria Journal. 2020;19:83. doi: 10.1186/s12936-020-03160-5. - DOI - PMC - PubMed
    1. Ali ZMI, Bakli M, Fontaine A, Bakkali N, Vu Hai V, Audebert S, Boublik Y, Pagès F, Remoué F, Rogier C, Fraisier C, Almeras L. Assessment of Anopheles salivary antigens as individual exposure biomarkers to species-specific malaria vector bites. Malaria Journal. 2012;11:439. doi: 10.1186/1475-2875-11-439. - DOI - PMC - PubMed
    1. Almeida AP, Billingsley PF. Induced immunity against the mosquito Anopheles stephensi: reactivity characteristics of immune sera. Medical and Veterinary Entomology. 1999;13:53–64. doi: 10.1046/j.1365-2915.1999.00143.x. - DOI - PubMed
    1. Alvarenga PH, Francischetti IMB, Calvo E, Sá-Nunes A, Ribeiro JMC, Andersen JF. The function and three-dimensional structure of a thromboxane A2/cysteinyl leukotriene-binding protein from the saliva of a mosquito vector of the malaria parasite. PLOS Biology. 2010;8:e1000547. doi: 10.1371/journal.pbio.1000547. - DOI - PMC - PubMed

Publication types