. 2021 Dec 1;28(6):5041-5053.
doi: 10.3390/curroncol28060424.

Changes in Brain Energy and Membrane Metabolism in Glioblastoma following Chemoradiation

Affiliations

Changes in Brain Energy and Membrane Metabolism in Glioblastoma following Chemoradiation

Astrid Ellen Grams et al. Curr Oncol. .

Abstract

Brain parenchyma infiltration with glioblastoma (GB) cannot be entirely visualized by conventional magnetic resonance imaging (MRI). The aim of this study was to investigate changes in the energy and membrane metabolism measured with phosphorous MR spectroscopy (31P-MRS) in the presumably "normal-appearing" brain following chemoradiation therapy (CRT) in GB patients in comparison to healthy controls. Twenty (seven female, thirteen male) GB patients underwent a 31P-MRS scan prior to surgery (baseline) and after three months of standard CRT (follow-up examination. The regions of interest "contrast-enhancing (CE) tumor" (if present), "adjacent to the (former) tumor", "ipsilateral distant" hemisphere, and "contralateral" hemisphere were compared, differentiating between patients with stable (SD) and progressive disease (PD). Metabolite ratios PCr/ATP, Pi/ATP, PCr/Pi, PME/PDE, PME/PCr, and PDE/ATP were investigated. In PD, energy and membrane metabolism in CE tumor areas have a tendency to "normalize" under therapy. In different "normal-appearing" brain areas of GB patients, the energy and membrane metabolism either "normalized" or were "disturbed", in comparison to baseline or controls. Differences were also detected between patients with SD and PD. 31P-MRS might contribute as an additional imaging biomarker for outcome measurement, which remains to be investigated in a larger cohort.

Keywords: ATP; cerebral energy metabolism; chemoradiation; glioblastoma; normal-appearing brain tissue; phosphorous magnetic resonance spectroscopy (31P-MRS); tumor infiltration.


Conflict of interest statement

The authors have no conflict of interests to declare. The funders played no role in the design of the study; collection, analyses, or interpretation of data; the writing of the manuscript, or in the decision to publish the results.

Figures

Figure 1
Figure 1
Flux diagram of patient selection and time flow of the study.
Figure 2
Figure 2
Images of one layer of the 31P-MRS measurement grid, each co-registered on an axial T2 space structural MR image of the same GBM patient, first at baseline (A) and subsequently 3 months after gross tumor resection and completion of chemoradiotherapy (B). Areas of interest are colored for better distinction. The two MRS spectra are exemplarily derived from the voxels highlighted with a blue X and depict the estimated individual metabolites of the MRS signal (red line) superimposed by the corresponding calculated fit (blue line).
Figure 3
Figure 3
Different metabolite ratios (af) of energy and membrane metabolism (y-axis representing unit less metabolite ratios), measured with 31P-MRS, in the contrast-enhancing areas of patients with glioblastoma at baseline (154 voxels) and after approximately four months of standard therapy (70 voxels), as compared to the results for healthy controls (3030 voxels) (x-axis representing examined patient and control groups). Mean and standard error of mean (SEM) are depicted. Statistically significant differences in metabolite ratios Kruskal–Wallis test with post-hoc Dunn test are marked (* p < 0.05, ** p < 0.01, *** p < 0.001, **** p < 0.0001). Outliers were excluded from the analyses. Details on analyzed individuals, voxels, and outliers are given in Supplementary Table S1.
Figure 4
Figure 4
Different metabolite ratios of the energy and membrane metabolism (y-axis representing unitless metabolite ratios), measured with 31P-MRS, in different “normal-appearing” brain areas (adjacent (af), distant ipsilateral (gl), contralateral (mr)) of patients with glioblastoma at baseline (154 voxels) and after approximately four months of standard therapy (70 voxels), compared to the results for healthy controls (3030 voxels) (x-axis representing examined patient and control groups). Mean and standard error of mean (SEM) are depicted. Statistically significant differences in metabolite ratios assessed with the Kruskal–Wallis test and the post-hoc Dunn test are marked (* p < 0.05, ** p < 0.01, *** p < 0.001, **** p < 0.0001, n.s. not significant). Outliers were excluded from the analyses. Details on analyzed individuals, voxels, and outliers are given in Supplementary Table S2.
Figure 5
Figure 5
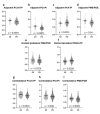
Different metabolite ratios of the energy and membrane metabolism (y-axis representing unit less metabolite ratios), measured with 31P-MRS, in different “normal-appearing” brain areas (adjacent (ad), distant ipsilateral (e,f), contralateral (gi)) of patients with SD (35 voxels) and patients with PD (200 voxels) (x-axis representing examined patient groups). The mean and standard error of mean (SEM) are depicted. Only statistically significant differences in metabolite ratios assessed with the Mann-Whitney U test are shown. Outliers were excluded from the analyses. Details on analysis individuals, voxels, and outliers are given in Supplementary Table S3.

References

    1. Stupp R., Mason W.P., van den Bent M.J., Weller M., Fisher B., Taphoorn M.J., Belanger K., Brandes A.A., Marosi C., Bogdahn U., et al. Radiotherapy plus concomitant and adjuvant temozolomide for glioblastoma. N. Engl. J. Med. 2005;352:987–996. doi: 10.1056/NEJMoa043330. - DOI - PubMed
    1. Giese A., Kluwe L., Laube B., Meissner H., Berens M.E., Westphal M. Migration of human glioma cells on myelin. Neurosurgery. 1996;38:755–764. doi: 10.1227/00006123-199604000-00026. - DOI - PubMed
    1. Cuddapah V.A., Robel S., Watkins S., Sontheimer H. A neurocentric perspective on glioma invasion. Nat. Rev. Neurosci. 2014;15:455–465. doi: 10.1038/nrn3765. - DOI - PMC - PubMed
    1. Scherer H.J. Structural development in gliomas. Am. J. Cancer. 1938;34:333–351.
    1. Sahm F., Capper D., Jeibmann A., Habel A., Paulus W., Troost D., von Deimling A. Addressing diffuse glioma as a systemic brain disease with single-cell analysis. Arch. Neurol. 2012;69:523–526. doi: 10.1001/archneurol.2011.2910. - DOI - PubMed

Publication types