Differential Outcomes Among Survivors of Head and Neck Cancer Belonging to Racial and Ethnic Minority Groups
- PMID: 34940784
- PMCID: PMC8704166
- DOI: 10.1001/jamaoto.2021.3425
Differential Outcomes Among Survivors of Head and Neck Cancer Belonging to Racial and Ethnic Minority Groups
Abstract
Importance: Approximately 1 in 5 new patients with head and neck cancer (HNC) in the US belong to racial and ethnic minority groups, but their survival rates are worse than White individuals. However, because most studies compare Black vs White patients, little is known about survival differences among members of racial and ethnic minority groups.
Objective: To describe differential survival and identify nonclinical factors associated with stage of presentation among patients with HNC belonging to racial and ethnic minority groups.
Design, setting, and participants: This population-based retrospective cohort study used data from the 2007 to 2016 Surveillance, Epidemiology, and End Results (SEER) database and included non-Hispanic Black, Asian Pacific Islander, American Indian/Alaska Native, and Hispanic patients with HNC. The data were analyzed from December 2020 to May 2021.
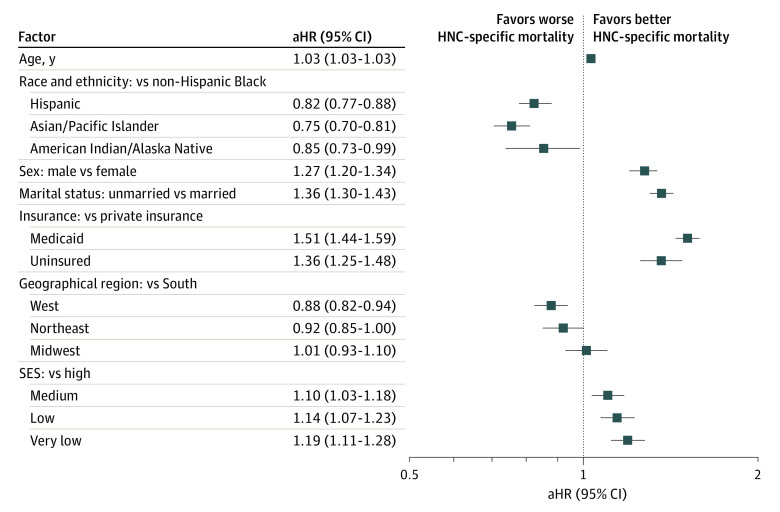
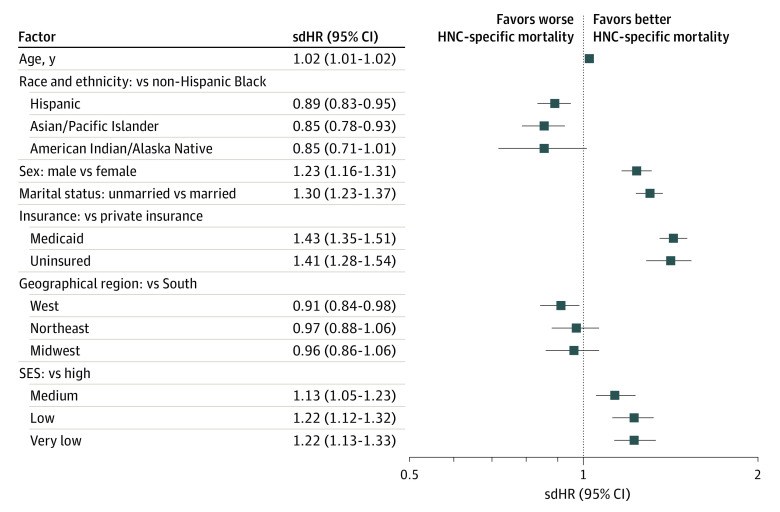
Main outcomes and measures: Outcomes were time to event measures: (HNC-specific and all-cause mortality) and stage of presentation. Covariates included nonclinical (age at diagnosis, sex, race and ethnicity, insurance status, marital status, and a composite socioeconomic status [SES]) and clinical factors (stage, cancer site, chemotherapy, radiation, and surgery). A Cox regression model was used to adjust associations of covariates with the hazard of all-cause death, and a Fine and Gray competing risks proportional hazards model was used to estimate associations of covariates with the hazard of HNC-specific death. A proportional log odds ordinal logistic regression identified which nonclinical factors were associated with stage of presentation.
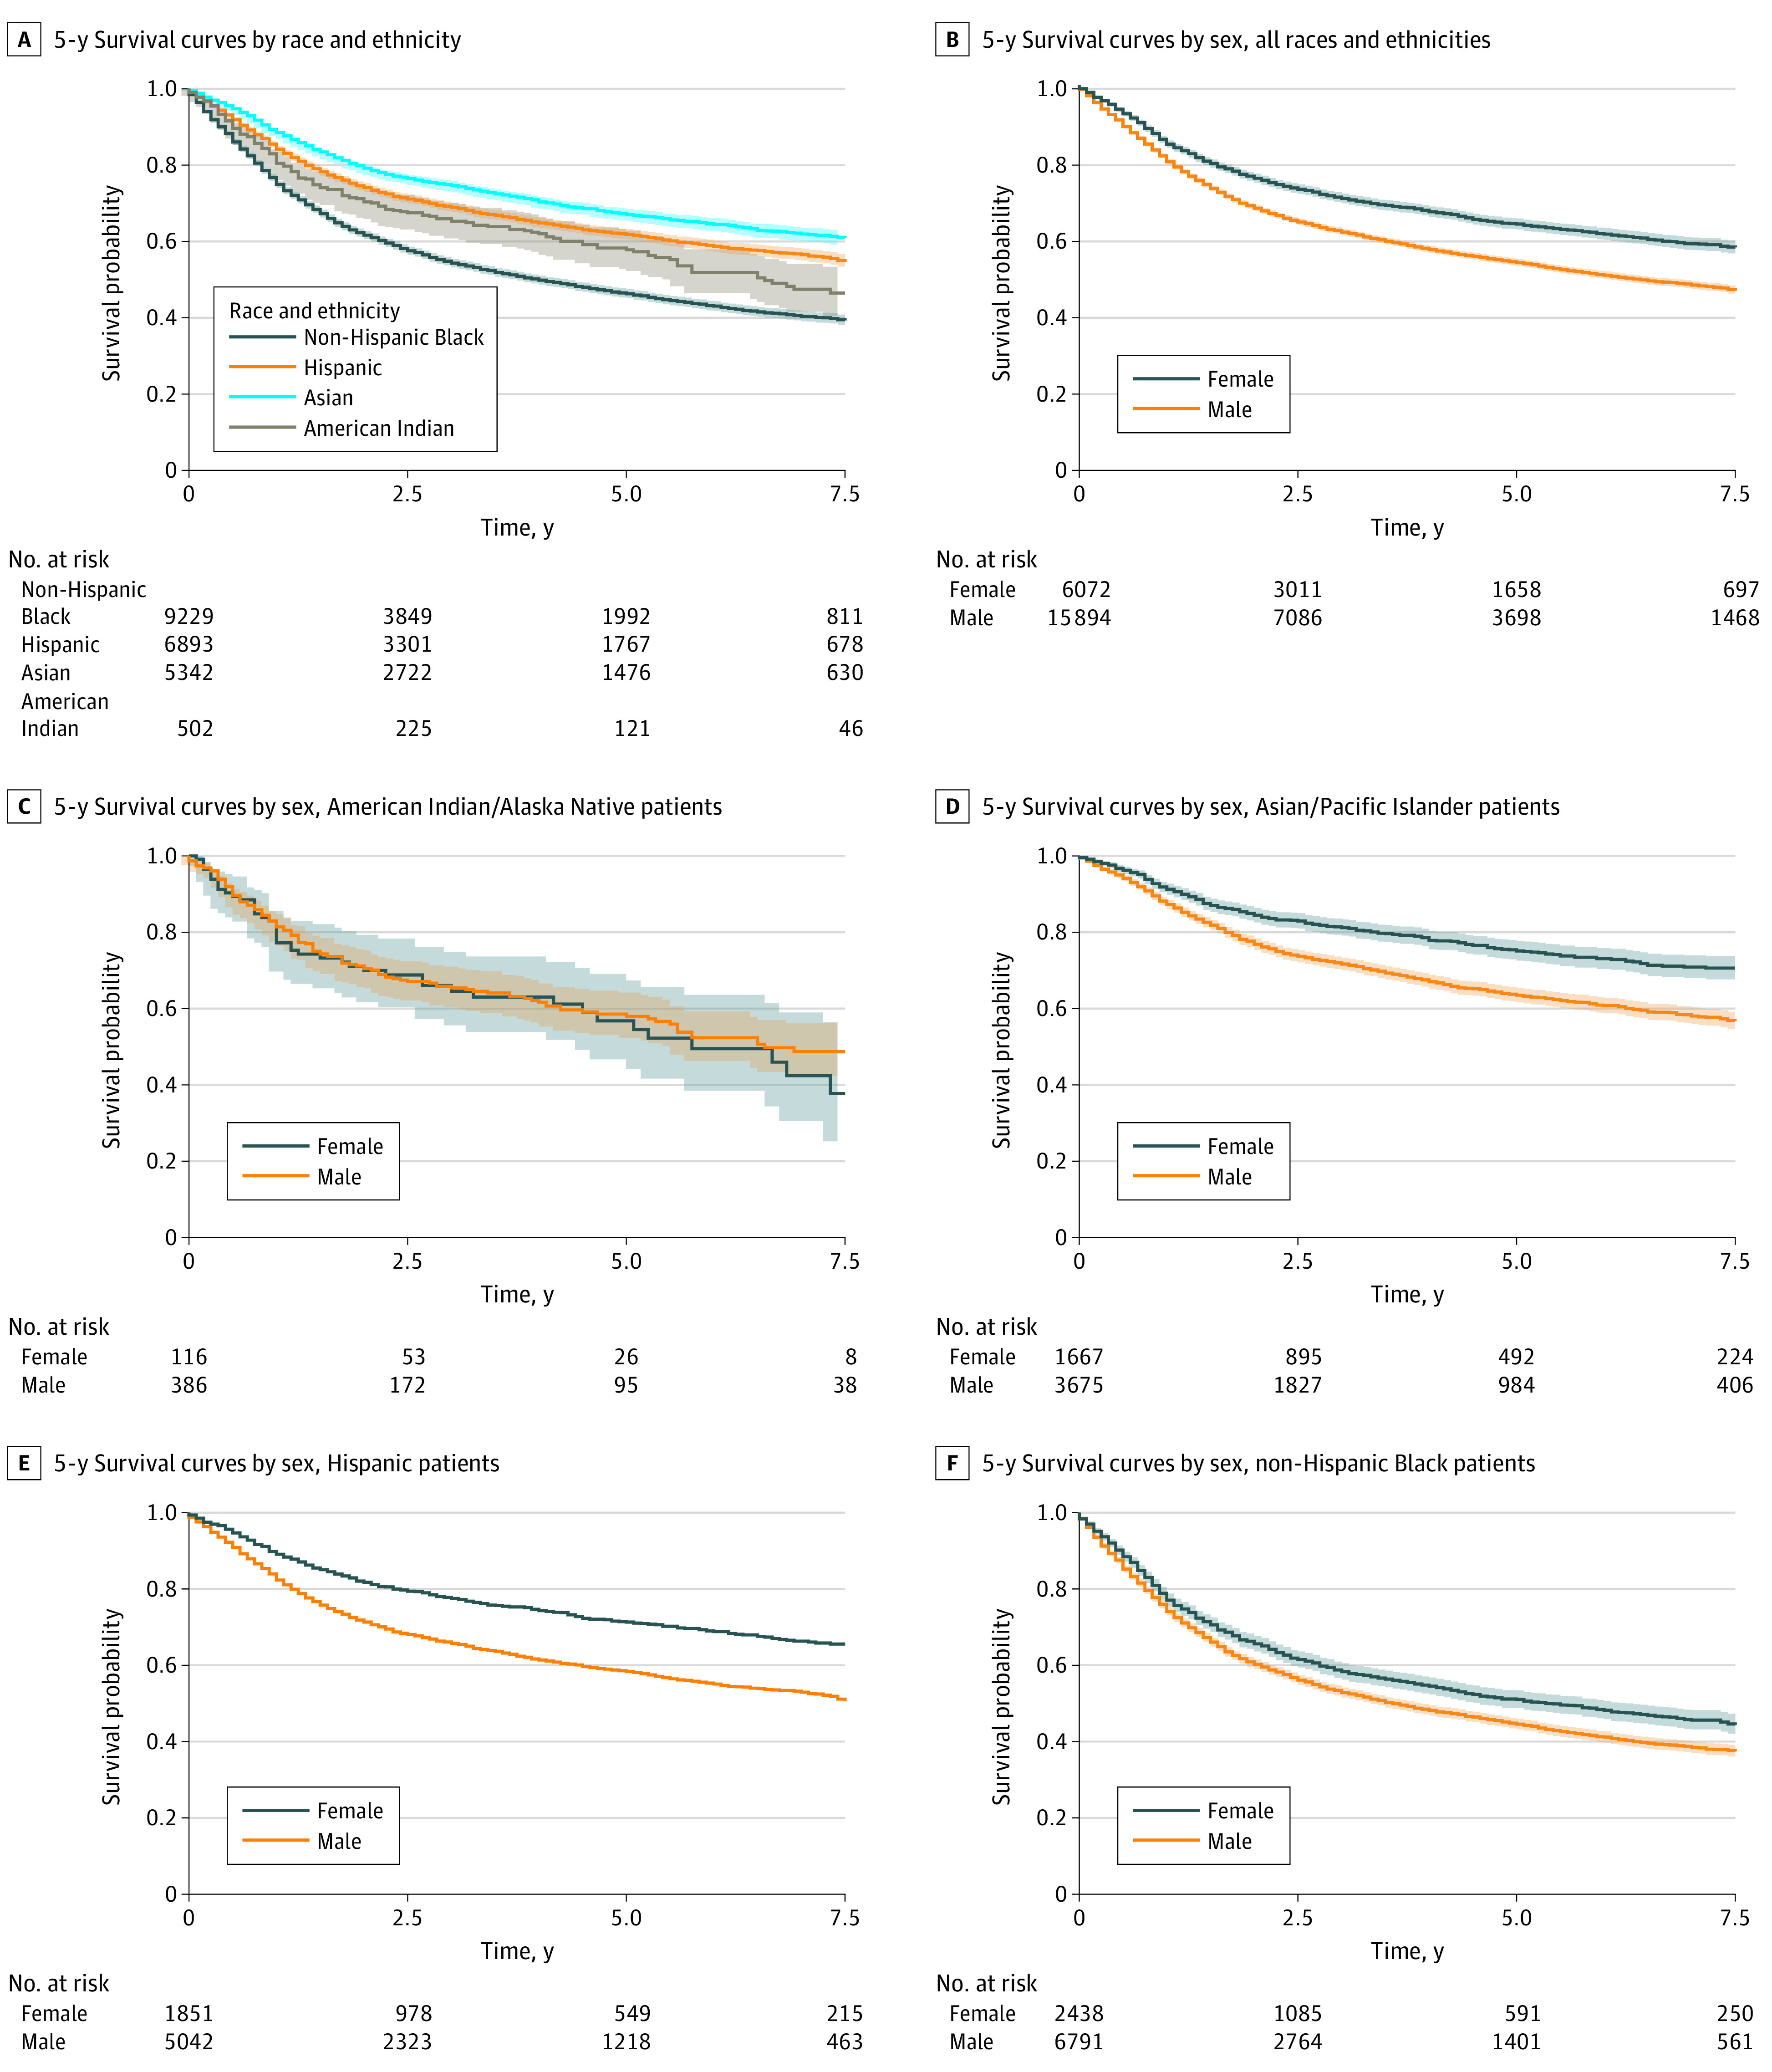
Results: There were 21 966 patients with HNC included in the study (mean [SD] age, 56.02 [11.16] years; 6072 women [27.6%]; 9229 [42.0%] non-Hispanic Black, 6893 [31.4%] Hispanic, 5342 [24.3%] Asian/Pacific Islander, and 502 [2.3%] American Indian/Alaska Native individuals). Black patients had highest proportion with very low SES (3482 [37.7%]) and the lowest crude 5-year overall survival (46%). After adjusting for covariates, Hispanic individuals had an 11% lower subdistribution hazard ratio (sdHR) of HNC-specific mortality (sdHR, 0.89; 95% CI, 0.83-0.95), 15% lower risk for Asian/Pacific Islander individuals (sdHR, 0.85; 95% CI, 0.78-0.93), and a trending lower risk for American Indian/Alaska Native individuals (sdHR, 0.85; 95% CI, 0.71-1.01), compared with non-Hispanic Black individuals. Race, sex, insurance, marital status, and SES were consistently associated with all-cause mortality, HNC-specific mortality, and stage of presentation, with non-Hispanic Black individuals faring worse compared with individuals of other racial and ethnic minority groups.
Conclusions and relevance: In this cohort study that included only patients with HNC who were members of racial and ethnic minority groups, Black patients had significantly worse outcomes that were not completely explained by stage of presentation. There may be unexplored multilevel factors that are associated with social determinants of health and disparities in HNC outcomes.
Conflict of interest statement
Figures
References
MeSH terms
Grants and funding
LinkOut - more resources
Full Text Sources
Medical