. 2021 Dec 1;21(13):11.
doi: 10.1167/jov.21.13.11.

Fixational eye movements following concussion

Affiliations

Fixational eye movements following concussion

Bianca T Leonard et al. J Vis. .

Abstract

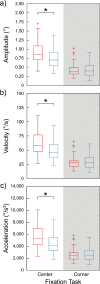
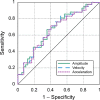
The purpose of this study was to evaluate fixational eye movements (FEMs) with high spatial and temporal resolution following concussion, where oculomotor symptoms and impairments are common. Concussion diagnosis was determined using current consensus guidelines. A retinal eye-tracking device, the tracking scanning laser ophthalmoscope (TSLO), was used to measure FEMs in adolescents and young adults following a concussion and in an unaffected control population. FEMs were quantified in two fixational paradigms: (1) when fixating on the center, or (2) when fixating on the corner of the TSLO imaging raster. Fixational saccade amplitude in recent concussion patients (≤ 21 days) was significantly greater, on average, in the concussion group (mean = 1.03°; SD = 0.36°) compared with the controls (mean = 0.82°; SD = 0.31°), when fixating on the center of the imaging raster (t = 2.87, df = 82, p = 0.005). These fixational saccades followed the main sequence and therefore also had greater peak velocity (t = 2.86, df = 82, p = 0.006) and peak acceleration (t = 2.80, df = 82, p = 0.006). These metrics significantly differentiated concussed from controls (AUC = 0.67-0.68, minimum p = 0.005). No group differences were seen for the drift metrics in either task or for any of the FEMs metrics in the corner-of-raster fixation task. Fixational saccade amplitudes were significantly different in the concussion group, but only when fixating on the center of the raster. This task specificity suggests that task optimization may improve differentiation and warrants further study. FEMs measured in the acute-to-subacute period of concussion recovery may provide a quick (<3 minutes), objective, sensitive, and accurate ocular dysfunction assessment. Future work should assess the impact of age, mechanism of injury, and post-concussion recovery on FEM alterations following concussion.


Figures

Figure 1.
Figure 1.
Task overview and representative TSLO fixational eye motion trace segmented into blinks, saccades, and drifts. Upper section shows an illustration depicting each fixation task; position of the eye denotes the fixation location on raster (denoted as red square on black background). Lower plot shows a 30-second eye trace from a single trial from a control participant (RLAB0185) when fixating on the center of the raster. Dark blue rectangles denote the locations of blinks, light blue sections of the motion traces denote drifts, and orange sections denote saccades.
Figure 2.
Figure 2.
Main sequences and histograms for each task. Saccade main sequence plots for both the concussion (red) and control (blue) groups show a linear relationship between saccade peak velocity and amplitude for both the center-of-raster fixation task (a) and the corner-of-raster fixation task (c). Histograms for both the center (b) and corner (d) fixation tasks show substantial overlap in distributions across the different amplitudes, but in both cases the concussion group saccades show a trend toward a greater proportion of larger amplitude saccades compared with controls. Note that data points in the main sequences have been made partially transparent to allow for color saturation to demonstrate data density but that with the thousands of points shown here many are obscured; the purple regions in the histogram plots denote overlap of the distributions. For clarity across the majority of saccade amplitudes, the amplitude and velocity axes in (a) and (c) are set at a cutoff that excludes a small proportion of larger saccades (>2.5°); these represent only a tiny fraction of the data (center task, 3.5% for concussion and 1.4% for controls; corner task, 0.09% for concussion and 0.21% for controls).
Figure 3.
Figure 3.
Fixational saccade direction histograms for all fixational saccades made in each task. Histograms for both the center (a) and corner (b) fixation tasks for the concussion group (red) and controls (blue) show substantial overlap (purple) across the different directions. Although the pattern of the direction distribution appears similar in both tasks for controls, the concussion group directionality pattern appears to differ between tasks, with a larger proportion of vertical and oblique saccades made in the corner task (b) compared with the center task (a); however, group means were not statistically different.
Figure 4.
Figure 4.
Comparison of fixational saccade parameters between groups and tasks. Box and whisker plots compare the fixational saccade statistics computed for each group. When fixation was on the center of the raster (left; white background) the amplitude (a), velocity (b), and acceleration (c) of fixational saccades were significantly different between groups. No metrics were significantly different between groups when fixation was on the corner of the raster (right side, shaded background). *Statistically significant group means (see Table 2).
Figure 5.
Figure 5.
Receiver operating characteristic curve for accuracy of fixational saccade metrics to identify subjects with concussion. When fixation was on the center of the raster, fixational saccade parameters significantly differentiated concussed from controls (AUC = 0.67–0.68; minimum p = 0.005).
Figure 6.
Figure 6.
Fixational saccade amplitude did not increase across each 30-second trial. Fixational saccade amplitudes were averaged using only the first, second, or third 10 seconds of each eye position trace to evaluate the presence of fatigue that might be rendered as an increase in amplitude across time. Fixational saccade amplitudes were nearly identical across the different temporal epochs evaluated for each group in both the center (upper) and corner (lower) fixation tasks. The concussion group is shown in red and control in blue; error bars are ±SD.

References

    1. Ahissar, E., & Arieli, A. (2001). Figuring space by time. Neuron, 32, 185–201, 10.1016/S0896-6273(01)00466-4. - DOI - PubMed
    1. Bijvank, J. A. N., Petzold, A., Coric, D., Tan, H. S., Uitdehaag, B. M. J., Balk, L. J., & van Rijn, L. J. (2019). Quantification of visual fixation in multiple sclerosis. Investigative Ophthalmology & Visual Science, 60(5), 1372–1383, 10.1167/iovs.18-26096. - DOI - PubMed
    1. Bolger, C., Bojanic, S., Sheahan, N. F., Coakley, D., & Malone, J. F. (1999). Ocular microtremor in patients with idiopathic Parkinson's disease. Journal of Neurology, Neurosurgery and Psychiatry, 66(4), 528–531, 10.1136/jnnp.66.4.528. - DOI - PMC - PubMed
    1. Cochrane, G. D., Gould, S. J., Sheehan, N., Busettini, C., Christy, J. B., Weise, K. K., & Swanson, M. W. (2020). Saccadic intrusions in paediatric concussion. Clinical and Experimental Optometry, 103(6), 929–930, 10.1111/cxo.13045. - DOI - PMC - PubMed
    1. Collins, M. W., Kontos, A. P., Okonkwo, D. O., Almquist, J., Bailes, J., Barisa, M., …, Zafonte, R. (2016). Statements of agreement from the Targeted Evaluation and Active Management (TEAM) Approaches to Treating Concussion Meeting held in Pittsburgh, October 15–16, 2015. Neurosurgery, 79(6), 912–929, 10.1227/NEU.0000000000001447. - DOI - PMC - PubMed

Publication types