. 2021 Dec 24;374(6575):eaba5531.
doi: 10.1126/science.aba5531. Epub 2021 Dec 24.

Cell-by-cell dissection of phloem development links a maturation gradient to cell specialization

Affiliations

Cell-by-cell dissection of phloem development links a maturation gradient to cell specialization

Pawel Roszak et al. Science. .

Abstract

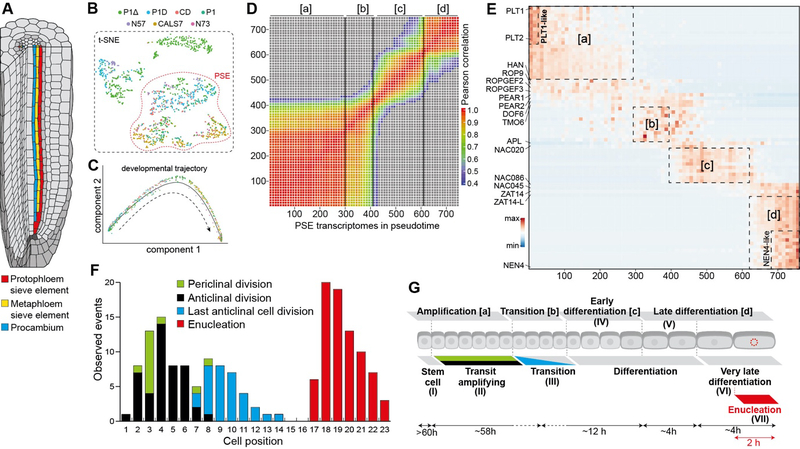
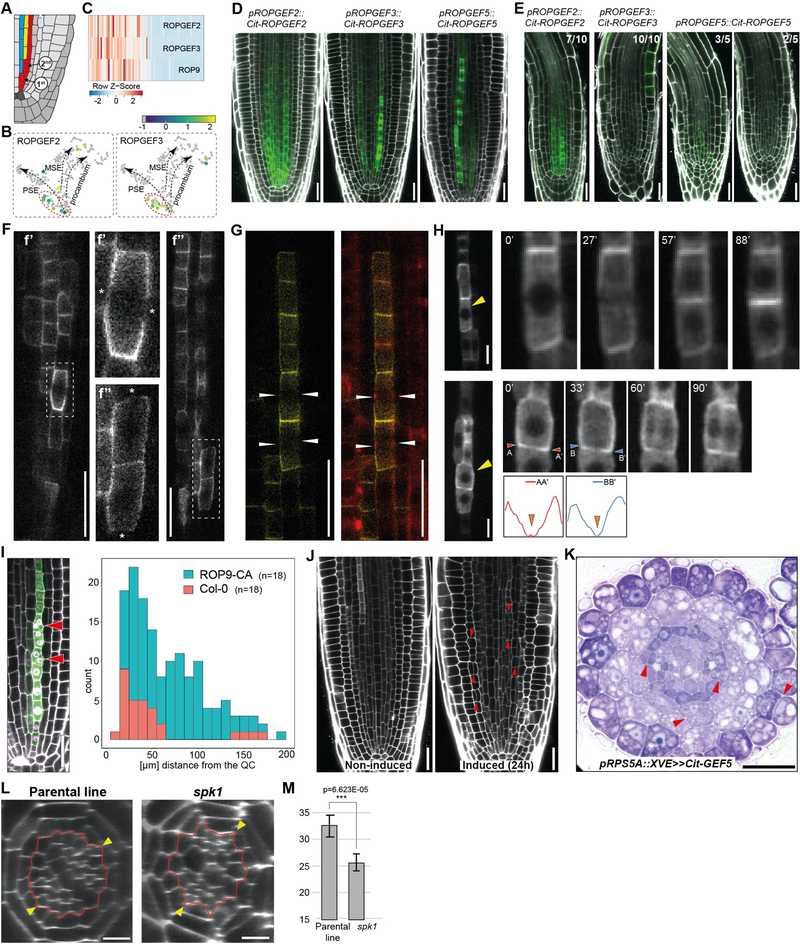
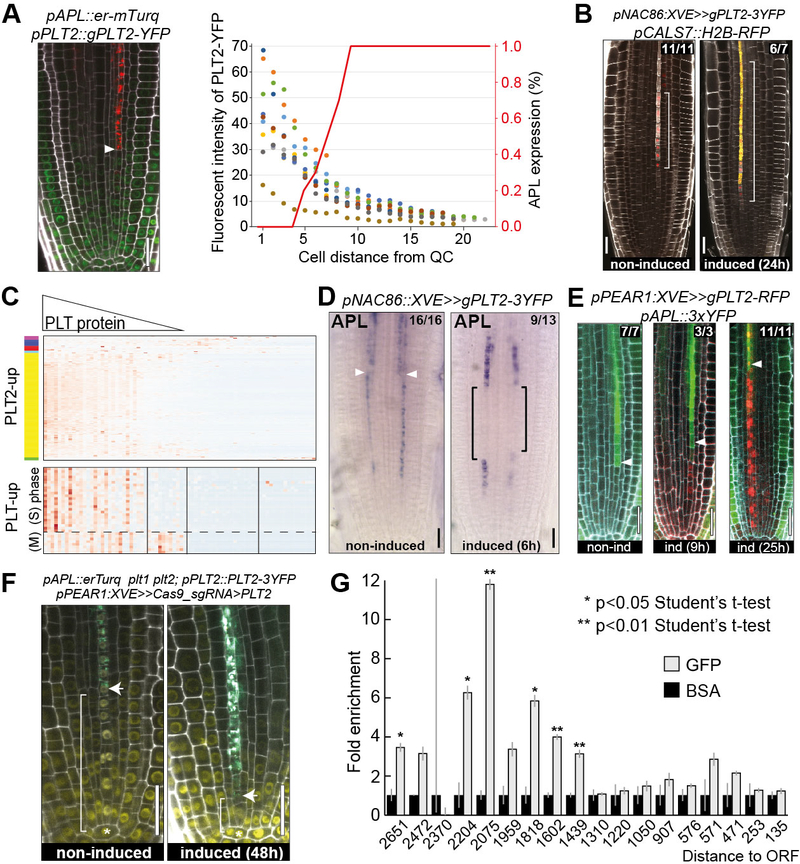
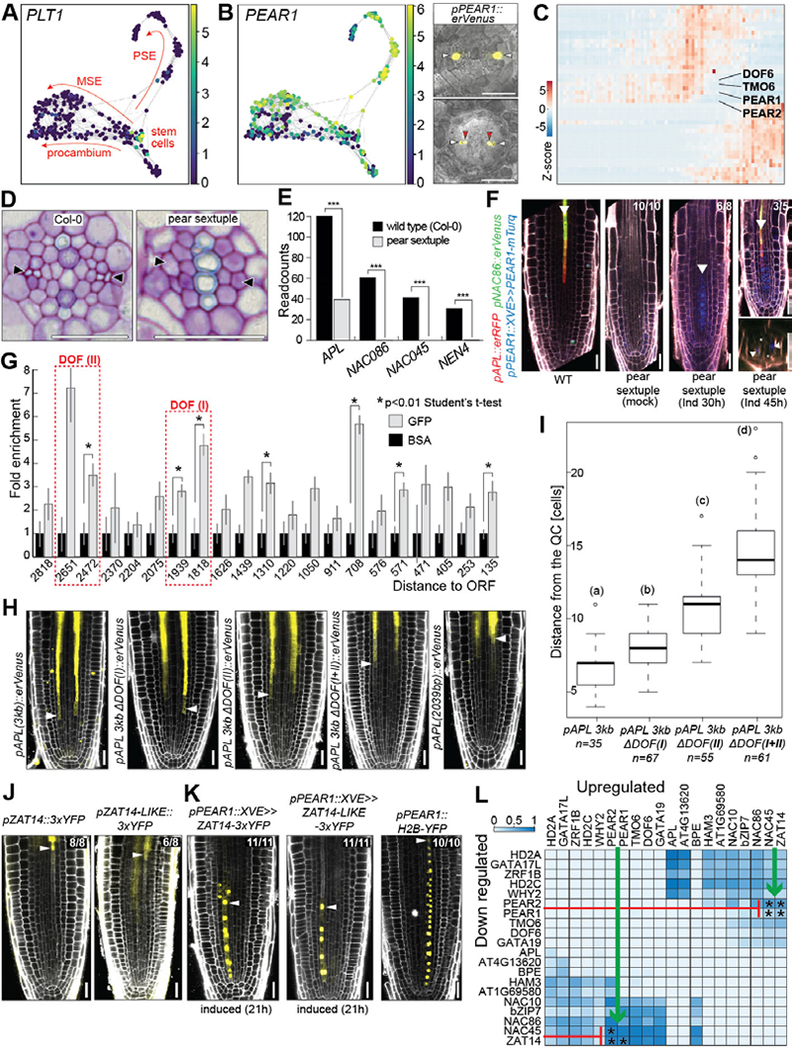
In the plant meristem, tissue-wide maturation gradients are coordinated with specialized cell networks to establish various developmental phases required for indeterminate growth. Here, we used single-cell transcriptomics to reconstruct the protophloem developmental trajectory from the birth of cell progenitors to terminal differentiation in the Arabidopsis thaliana root. PHLOEM EARLY DNA-BINDING-WITH-ONE-FINGER (PEAR) transcription factors mediate lineage bifurcation by activating guanosine triphosphatase signaling and prime a transcriptional differentiation program. This program is initially repressed by a meristem-wide gradient of PLETHORA transcription factors. Only the dissipation of PLETHORA gradient permits activation of the differentiation program that involves mutual inhibition of early versus late meristem regulators. Thus, for phloem development, broad maturation gradients interface with cell-type-specific transcriptional regulators to stage cellular differentiation.


Conflict of interest statement

Competing interests: Authors declare that they have no competing interests.

Figures

Figure 1.
Figure 1.. Phloem development at single-cell resolution.
(A) Schematic of the Arabidopsis root tip depicting position of protophloem sieve element, metaphloem sieve element and procambium cell lineages originating from a single phloem stem cell. (B) t-SNE plot of 1242 transcriptomes of cells sorted with P1Δ, P1D, CD, P1, N57, CALS7 and N73 reporter lines specific to different domains of the developing phloem. Indicated protophloem sieve element cells were used for the pseudotime trajectory analysis (Fig. S2, Supplementary Material). (C) protophloem sieve element transcriptomes ordered along developmental trajectory using Monocle 2. (D) Heatmap of Pearson correlation along the pseudotime trajectory. Vertical lines indicate 3 strongest correlation drops and separate four groups of transcriptomes with higher similarity [a], [b], [c] and [d]. (E) Gene expression heatmap of protophloem sieve element regulators and 10 most specific genes from the 4 groups defined in D) and the nested PLT1 (“PLT1-like”) or NEN4 (“NEN4-like”) expression domains in pseudotime-ordered protophloem sieve element transcriptomes. (F) Histogram of cell behavior based on long-term live imaging. (G) Seven domains and the time cells spend in each position of the developing protophloem sieve element as determined by the transcriptomics (above) and live imaging (below): (I) “stem cell”, position 1 [a], t>60h; (II) “transit amplifying”, position 2–9 [a], t=58h, SD+8.1h, (III) “transitioning”, position 8–11 [b]; (IV) “early differentiating”, position 10–15 [c], t=12h; (V) “late differentiating”, position 16–17 [d], t=4h; (VI) “very late differentiating - NEN4-like”, position 18–19 [d], t=4h; VII “enucleating”, position 19 [d], t= 2h (Movie S1, S2).
Figure 2.
Figure 2.. PEARs control asymmetric divisions by promoting ROP signaling in the phloem pole.
(A) Schematic indicating position of the two periclinal divisions in the phloem cell lineage. (B) Expression of ROPGEF2 and ROPGEF3 at the time of phloem lineage bifurcation. (C) Peak expression of ROPGEF2, 3 and ROP9 in the early phloem cells as detected in the pseudotime-ordered single cell protophloem sieve element transcriptome data. (D) Expression pattern of phloem enriched ROPGEFs. ROPGEF3 and 5 share similar expression domain – enriched in protophloem sieve element and adjacent vascular cell files; ROPGEF2 is expressed in protophloem sieve element but also in other outer procambial cells and pericycle (Fig. S4D). Scale bars: 25 μm. (E) Expression of ROPGEF2, 3 and 5 in the pear sextuple mutant background. Scale bars: 25 μm. (F) Protein localization of pROPGEF5::Cit-ROPGEF5 during anticlinal (f’) and periclinal (f”) cell division. Gaps in ROPGEF5 signal are indicated with an asterisk. Scale bars: 25 μm. (G) Depletion of Cit-ROPGEF5 membrane signal at the cortical division zone (CDZ) during cell division. CDZ is marked by accumulating cortical microtubules (mCherry-TUA5) forming pre-prophase band (white arrowheads). Scale bars: 25 μm. (H) Time course analysis of the dynamic pattern of active ROP signaling in the dividing phloem cells. Depletion of pPEAR1::mScarlet-I-MIDD1ΔN signal at the CDZ in the anticlinally (upper row) and periclinally (lower row) dividing cells (yellow arrowheads). Quantification of fluorescent signal intensity in the periclinally dividing cells. Scale bars: 10 μm. (I) Quantification of asymmetric cell divisions (red arrowheads) in the protophloem sieve element cell lineage after expression of constitutively active ROP9 (Q64L) (pPEAR1::XVE>>ROP9CA). Scale bars: 25 μm. (J) Ectopic asymmetric cell divisions (red arrowheads) 24h after induction of ectopic Cit-GEF5 expression (pRPS5A::XVE>>Cit-GEF5). Scale bars: 25 μm. (K) Toluidine blue stanning of resin sections of Cit-GEF5 overexpressing line (pRPS5A::XVE>>Cit-GEF5) 24h after induction. Red arrowheads indicate ectopic periclinal cell divisions in epidermis, endodermis and pericycle. Scale bars: 25 μm. (L) Identification of spk1 allele in the mutant screen of pRPS5A::PEAR1-GR parental line. Presented are images from non-induced plants. Scale bars: 10 μm. (M) Quantification of vascular cell files in the spk1 mutant and its parental line pRPS5A::PEAR1-GR. Both lines were not induced.
Figure 3.
Figure 3.. PLT2 inhibits phloem differentiation by directly repressing APL expression.
(A) Quantification of fluorescent intensity of PLT2-YFP in protophloem sieve element cells of 9 roots indicated with dots of different colours. Percentage of roots expressing APL in a given protophloem sieve element cell is indicated as a red line (n=9). Onset of APL expression coincides with diminishing level of PLT2 protein. Arrowhead indicates onset of APL expression in protophloem sieve element. (B) Ectopic expression of PLT2 under pNAC86::XVE promoter delays protophloem sieve element enucleation. Square brackets indicate extended expression domain of pCALS7::H2B-RFP, a reporter used for monitoring enucleation. (C) Native expression profile of PLT2 targets in protophloem sieve element cells ordered in pseudotime. Genes upregulated after 6 hours of induction of the line shown in B) are plotted. Upper panel shows gradually diminishing expression of target genes which reflects the PLT2 protein gradient. Lower panel shows PLT2 upregulated cell cycle genes with oscillatory expression pattern. (D) In situ hybridization of APL before and 6h after ectopic expression of PLT2–3xYFP. Arrowheads indicate position of protophloem sieve element enucleation beyond which point APL is expressed in phloem pole pericycle, companion cells and metaphloem sieve element (Fig. S5E). Brackets indicate pNAC086 activity domain. (E) Time course of transcriptional repression of APL in cells ectopically expressing PLT2-RFP under inducible pPEAR1::XVE promoter. (F) Early activation of APL expression 48h after phloem specific knock-out of PLT2. (G) ChIP-qPCR of PLT2–3xYFP on APL promoter revealed PLETHORA binding region −2204 to −1439 bp upstream of APL ORF. All scale bars, 25 μm.
Figure 4.
Figure 4.. PEARs orchestrate phloem differentiation.
(A) Force-directed clustering of 272 single-cell transcriptomes obtained using the pPEAR1Δ::erVenus reporter. Plotted is expression of stem cell abundant PLT1. Arrows: cellular trajectories inferred from known gene expression patterns (Fig. S6). (B) Strong enrichment of PEAR1 expression in protophloem sieve element and metaphloem sieve element trajectories confirmed by pPEAR1::erVenus reporter line. White arrowheads: protophloem sieve element, red arrowheads: metaphloem sieve element. (C) Expression heatmap: PEAR genes among the earliest phloem specific transcription factors. (D) Lack of protophloem sieve element differentiation in the mature part of the pear sextuple mutant root. Arrowheads: protophloem sieve element position. (E) Lack of APL pathway activation in the roots of pear sextuple mutant based on RNASeq analysis. (F) Inducible expression of PEAR1-mTurq is sufficient to activate transcription of APL and NAC86 reporters in pear sextuple mutant background. (G) ChIP-qPCR of PEAR1-YFP shows direct interaction of PEAR1 with APL promoter at multiple positions. Two prominent PEAR1 binding sites are indicated with red dashed rectangles. (H) Expression patterns of modified pAPL reporter lines. Length of “3kb” promoter equals 2962 bp. DOF(I) and DOF(II) correspond to two enhancer elements indicated in panel G. Details of modification are provided in Fig. S7C. (I) Quantification of the onset of pAPL expression after modification of DOF binding motives. Statistically significant differences between groups were tested using Tukey’s HSD test P < 0.05. Different letters indicate significant difference at P < 0.05. (J) Expression of ZAT14 and ZAT14L during late differentiation of protophloem sieve element. Arrowheads: last cell before enucleation. (K) Ectopic expression of ZAT14 and ZAT14L under pPEAR1::XVE results in cell elongation and inhibition of cell division. Arrowheads: last cell before enucleation. pPEAR1::H2B-YFP line shows regular number of protophloem sieve element cells. (L) Heatmap shows significantly overlapping and oppositely regulated target sets of the 20 most important TFs from the GRN model. Color intensity shows a fraction of overlapping target sets. The colormap represents significantly overlapping sets (Fisher Exact Test, if p<0.05, val=1) multiplied by the fraction of overlap. Asterisk indicates experimental validation of up and downregulated sets from TF OE in vivo (Tables S15, S16). All scale bars, 25 μm.

References

    1. Dolan L, Janmaat K, Willemsen V, Linstead P, Poethig S, Roberts K, Scheres B, Cellular organisation of the Arabidopsis thaliana root. Development. 119, 71–84 (1993). - PubMed
    1. Mähönen AP, Bonke M, Kauppinen L, Riikonen M, Benfey PN, Helariutta Y, A novel two-component hybrid molecule regulates vascular morphogenesis of the Arabidopsis root. Genes Dev. 14, 2938–2943 (2000). - PMC - PubMed
    1. Furuta KM, Yadav SR, Lehesranta S, Belevich I, Miyashima S, Heo J, Vatén A, Lindgren O, Rybel BD, Isterdael GV, Somervuo P, Lichtenberger R, Rocha R, Thitamadee S, Tähtiharju S, Auvinen P, Beeckman T, Jokitalo E, Helariutta Y, Arabidopsis NAC45/86 direct sieve element morphogenesis culminating in enucleation. Science. 345, 933–937 (2014). - PubMed
    1. Marhava P, Bassukas AEL, Zourelidou M, Kolb M, Moret B, Fastner A, Schulze WX, Cattaneo P, Hammes UZ, Schwechheimer C, Hardtke CS, A molecular rheostat adjusts auxin flux to promote root protophloem differentiation. Nature. 558, 297–300 (2018). - PubMed
    1. Rahni R, Birnbaum KD, Week-long imaging of cell divisions in the Arabidopsis root meristem. Plant Methods. 15, 30 (2019). - PMC - PubMed

Publication types

MeSH terms