. 2021 Nov 28;13(12):849.
doi: 10.3390/toxins13120849.

Hepatotoxicity of Pyrrolizidine Alkaloid Compound Intermedine: Comparison with Other Pyrrolizidine Alkaloids and Its Toxicological Mechanism

Affiliations

Hepatotoxicity of Pyrrolizidine Alkaloid Compound Intermedine: Comparison with Other Pyrrolizidine Alkaloids and Its Toxicological Mechanism

Ziqi Wang et al. Toxins (Basel). .

Abstract

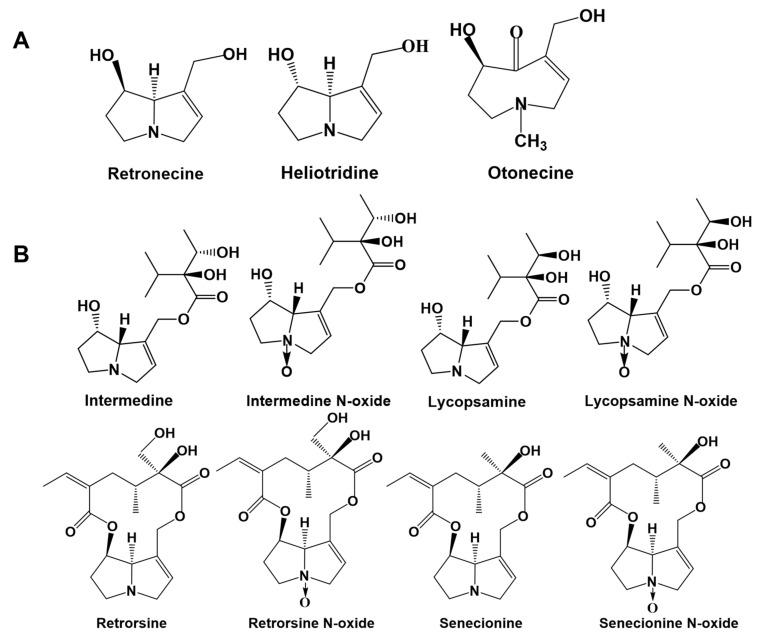
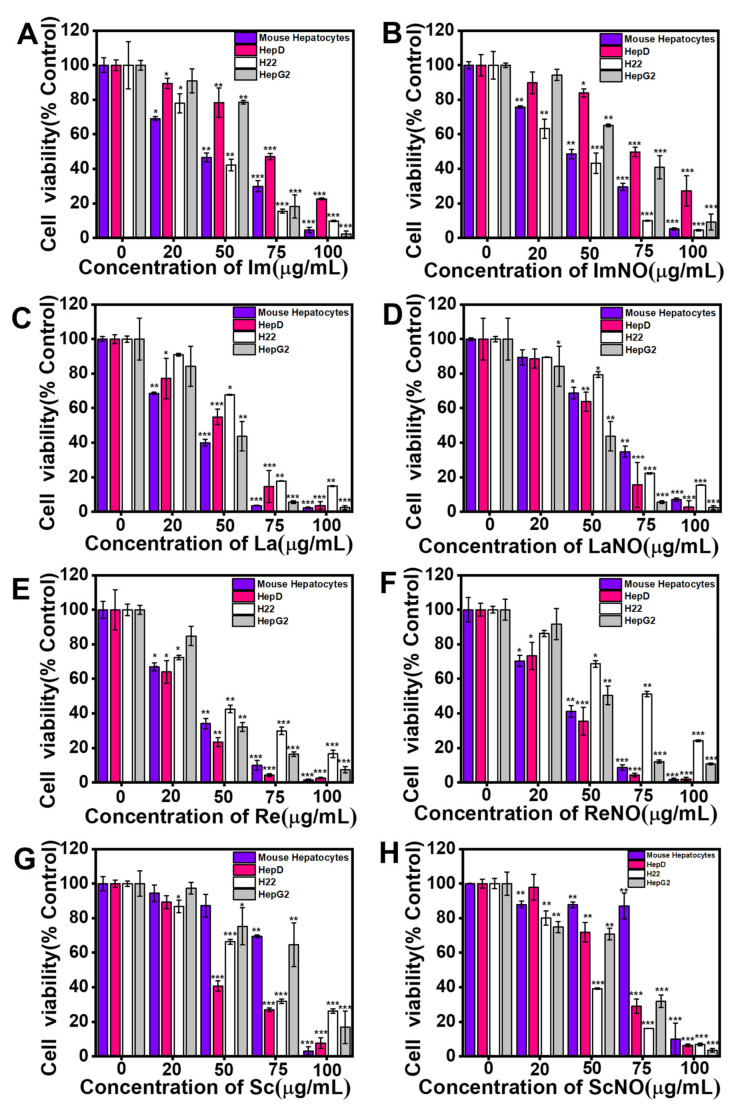
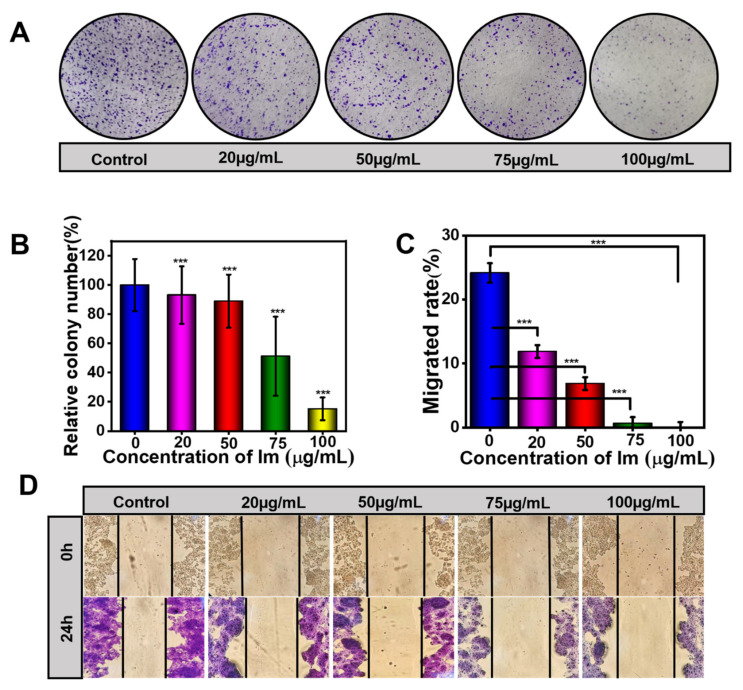
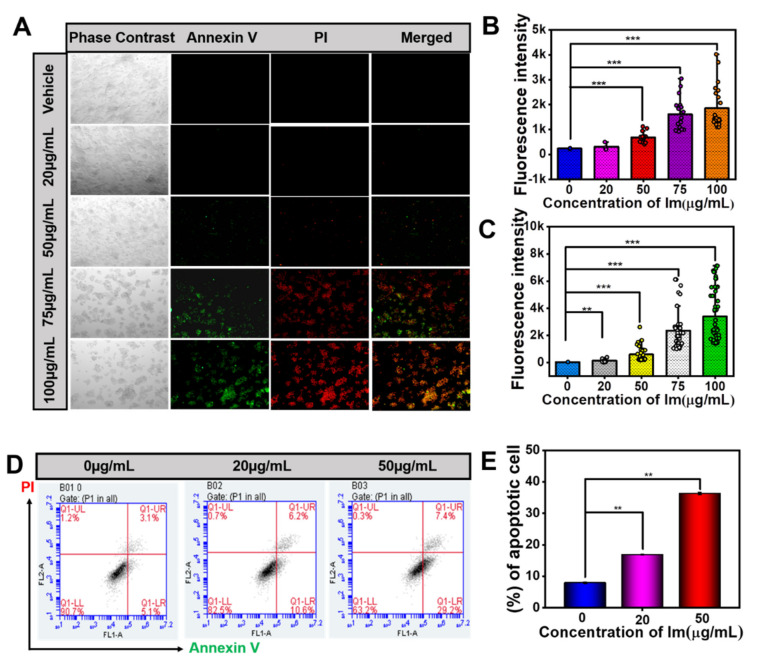
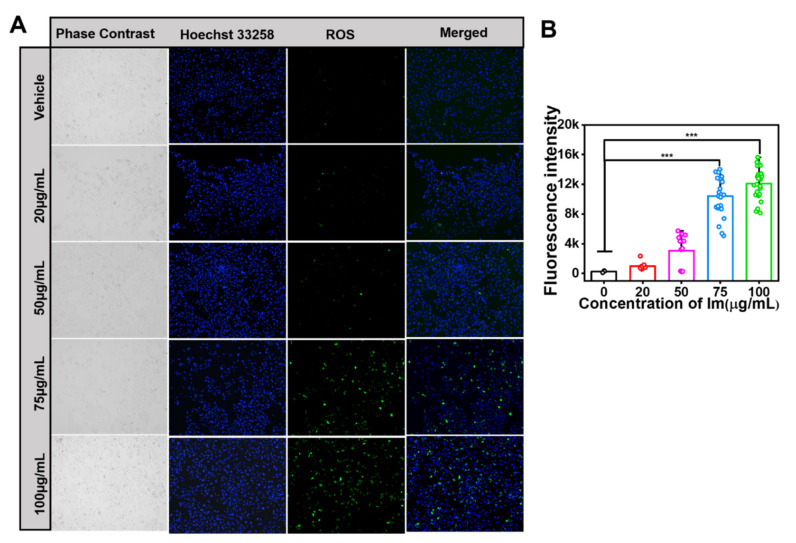
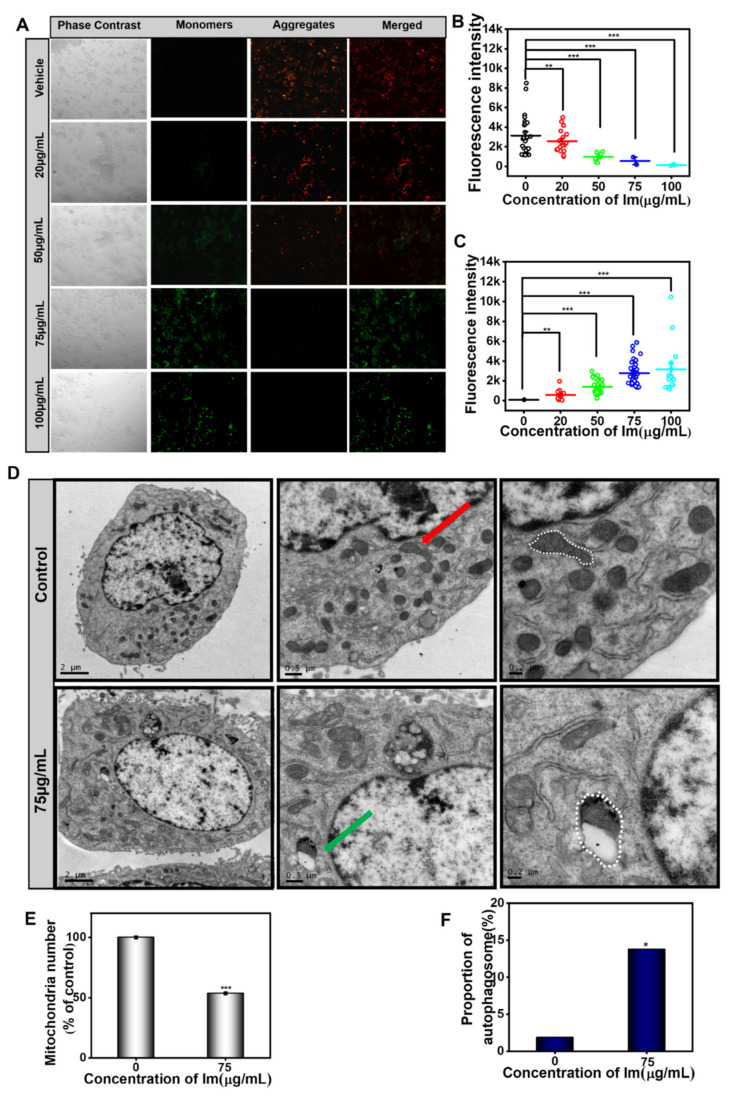
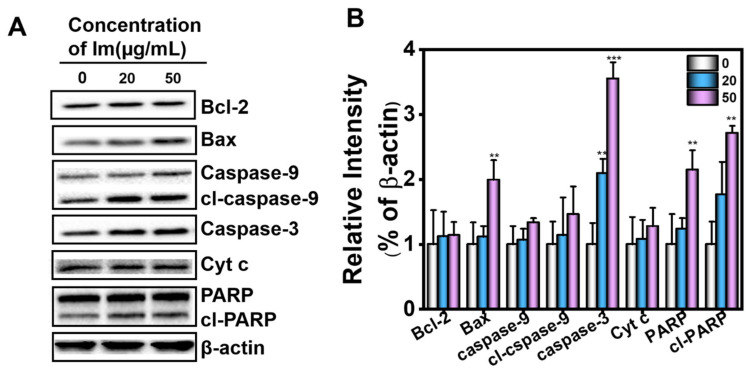
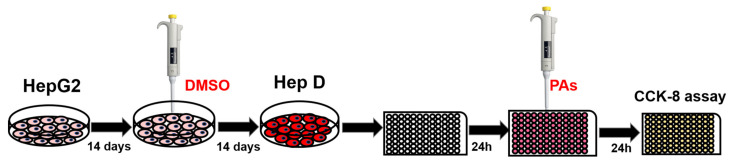
Pyrrolizidine alkaloids (PAs) are common secondary plant compounds with hepatotoxicity. The consumption of herbal medicines and herbal teas containing PAs is one of the main causes of hepatic sinusoidal obstruction syndrome (HSOS), a potentially life-threatening condition. The present study aimed to reveal the mechanism underlying the cytotoxicity of intermedine (Im), the main PA in Comfrey. We evaluated the toxicity of the retronecine-type PAs with different structures to cell lines derived from mammalian tissues, including primary mouse hepatocytes, human hepatocytes (HepD), mouse hepatoma-22 (H22) and human hepatocellular carcinoma (HepG2) cells. The cytotoxicity of Im to hepatocyte was evaluated by using cell counting kit-8 assay, colony formation experiment, wound healing assay and dead/live fluorescence imaging. In vitro characterization showed that these PAs were cytotoxic and induced cell apoptosis in a dose-dependent manner. We also demonstrated that Im induced cell apoptosis by generating excessive reactive oxygen species (ROS), changing the mitochondrial membrane potential and releasing cytochrome c (Cyt c) before activating the caspase-3 pathway. Importantly, we directly observed the destruction of the cell mitochondrial structure after Im treatment through transmission electron microscopy (TEM). This study provided the first direct evidence of Im inducing hepatotoxicity through mitochondria-mediated apoptosis. These results supplemented the basic toxicity data of PAs and facilitated the comprehensive and systematic evaluation of the toxicity caused by PA compounds.

Keywords: cytotoxicity; intermedine; liver injury; pyrrolizidine alkaloids; toxicity mechanism.


Conflict of interest statement

The authors declare no conflict of interest.

Figures

Figure 1
Figure 1
Structures of 1,2-unsaturated pyrrolizidine alkaloids (PAs). (A) Typical structures of retronecine-type, heliotridine-type and otonecine-type. (B) Structures of intermedine (Im), intermedine N-oxide (ImNO), lycopsamine (La), lycopsamine N-oxide (LaNO), retrorsine (Re), retrorsine N-oxide (ReNO), senecionine (Sc) and senecionine N-oxide (ScNO).
Figure 2
Figure 2
Im, ImNO, La, LaNO, Re, ReNO, Sc and ScNO inhibited the growth of primary mouse hepatocytes, human hepatocytes (HepD), mouse hepatoma-22 (H22) and human hepatocellular carcinoma (HepG2) cells. The proliferative ability of primary mouse hepatocytes, HepD cells, H22 cells and HepG2 cells was detected using cell counting kit-8 assays after the cells were treated with Im, ImNO, La, LaNO, Re, ReNO, Sc and ScNO. (A) The viability of four kinds of cells after treated by Im. (B) The viability of four kinds of cells after treated by ImNO. (C) The viability of four kinds of cells after treated by La. (D) The viability of four kinds of cells after treated by LaNO. (E) The viability of four kinds of cells after treated by Re. (F) The viability of four kinds of cells after treated by ReNO. (G) The viability of four kinds of cells after treated by Sc. (H) The viability of four kinds of cells after treated by ScNO. Data represent means ± standard deviation (S.D.) of three independent experiments. *: p < 0.05, **: p < 0.01 and ***: p < 0.001 compared with the control group.
Figure 3
Figure 3
Im inhibited cell colony formation and migration. (A)Typical representative photographs of HepD cells that were subjected to a colony formation assay. HepD cells were exposed to various concentrations of Im (0, 20, 50, 75 and 100 µg/mL) for 24 h, followed by staining with crystal violet. (B) Quantitative statistics of the number of cells corresponding to A. Negative control: 0 µg/mL. (C) Quantitative statistics of the scratch distance of cells corresponding to D. (D) For the wound healing assay, HepD cells were treated with 0, 20, 50, 75 and 100 µg/mL Im. Typical representative photographs of HepD cells migration after treatment with Im for 0 h and 24 h. Data represent means ± S.D. of three independent experiments. ***: p < 0.001 compared with the control. Negative control: the scratch distance of cells at 0 h.
Figure 4
Figure 4
Im-induced HepD cells apoptosis. (A) The Annexin V/PI fluorescent images of cells treated with Im (0, 20, 50, 75 and 100 µg/mL) for 24 h (the early apoptotic cells are in green color, and the late apoptotic cells are in green and red color). (B) Quantitative statistics of the green fluorescence intensity corresponding to A. (C) Quantitative statistics of the red fluorescence intensity corresponding to A. (D) HepD cells were exposed to various concentrations of Im (0, 20 and 50 µg/mL) for 24 h, followed by flow cytometry-based apoptosis assay. (E) Group data analysis of the percentage of apoptotic cells corresponding to D. Data represent means ± S.D. of three independent experiments. **: p < 0.01 and ***: p < 0.001 compared with the control.
Figure 5
Figure 5
Im-induced ROS production in HepD cells. (A) The production of intracellular ROS levels was detected with DCFH-DA (ROS-positive cells are in green) and the nucleus was stained with Hoechst 33258 (nucleus are in blue). HepD cells were incubated with 0, 20, 50, 75 and 100 µg/mL Im for 24 h and the intensity of green fluorescence increased significantly as the concentration of Im increased. (B) Quantitative statistics of ROS fluorescence intensity corresponding to A. Data represent means ± S.D. of three independent experiments. ***: p < 0.001 compared with the control.
Figure 6
Figure 6
Im-induced mitochondrial damage in HepD cells. (A) HepD cells were treated with 0, 20, 50, 75 and 100 µg/mL Im, representative fluorescence images of HepD cells of mitochondrial membrane potential assay. Green fluorescence increased and red fluorescence decreased; Im induced mitochondrial damage and decreased mitochondrial membrane potential. (B) Quantitative statistics red fluorescence intensity statistics graph corresponding to A. (C) Quantitative statistics green fluorescence intensity statistics graph corresponding to A. (D) HepD cells were treated with 0, 75 µg/mL Im and representative images of transmission electron microscope. Red arrows indicated normal mitochondria and green arrows indicated mitochondrial autophagosome. (E) The percentage of mitochondria numbers in 0, 75 µg/mL Im-treated HepD cells. (F) The percentage of mitochondrial autophagy in 0, 75 µg/mL Im-treated HepD cells. *: p < 0.05, **: p < 0.01 and ***: p < 0.001 compared with the control.
Figure 7
Figure 7
HepD cells were treated with 0, 20 and 50 µg/mL Im. (A) Effects of Im on the expression of apoptosis-related proteins B-cell lymphoma-2 (Bcl-2), Bcl-2-Associated X protein (Bax), PARP, cl-PARP, caspase-3, caspase-9, cleaved caspase-9 and Cytochrome c) in HepD cells. HepD cells were treated with 0, 20 and 50 µg/mL Im for 24 h and the expression levels of Bcl-2, Bax, PARP, cl-PARP, caspase-3, caspase-9, cleaved caspase-9 and Cytochrome c (Cyt c) were examined by western blot analysis. (B) The statistics graph shows the expression of these proteins corresponding to A. Data represent means ± S.D. of three independent experiments. **: p < 0.01 and ***: p < 0.001 compared with cells treated with 0 µg/mL Im.
Figure 8
Figure 8
Cultivation and incubation scheme for HepD cells. HepG2 cells were grown in MEM medium supplemented with 10% (v/v) fetal bovine serum, 100 U/mL penicillin and 100 U/mL streptomycin. For HepG2 cell differentiation, a two-step procedure was used to prepare cell proliferation assays by first culturing HepG2 cells in MEM medium for 14 days followed by further culturing in medium with 1.7% DMSO for 14 days and then differentiating HepG2 cells into HepD cells.

References

    1. Xu J., Wang W., Yang X., Xiong A., Yang L., Wang Z. Pyrrolizidine alkaloids: An update on their metabolism and hepatotoxicity mechanism. Liver Res. 2019;3:176–184. doi: 10.1016/j.livres.2019.11.004. - DOI
    1. Yang X.Q., Ye J., Li X., Li Q., Song Y.H. Pyrrolizidine alkaloids-induced hepatic sinusoidal obstruction syndrome: Pathogenesis, clinical manifestations, diagnosis, treatment, and outcomes. World J. Gastroenterol. 2019;25:3753–3763. doi: 10.3748/wjg.v25.i28.3753. - DOI - PMC - PubMed
    1. Helmy A. Review article: Updates in the pathogenesis and therapy of hepatic sinusoidal obstruction syndrome. Aliment. Pharmacol. Ther. 2006;23:11–25. doi: 10.1111/j.1365-2036.2006.02742.x. - DOI - PubMed
    1. Edgar J., Molyneux R.J., Colegate S.M. Pyrrolizidine Alkaloids: Potential Role in the Etiology of Cancers, Pulmonary Hypertension, Congenital Anomalies, and Liver Disease. Chem. Res. Toxicol. 2015;28:4–20. doi: 10.1021/tx500403t. - DOI - PubMed
    1. Gunthardt B.F., Wettstein F.E., Hollender J., Singer H., Harri J., Scheringer M., Hungerbuhler K., Bucheli T.D. Retrospective HRMS Screening and Dedicated Target Analysis Reveal a Wide Exposure to Pyrrolizidine Alkaloids in Small Streams. Environ. Sci. Technol. 2021;55:1036–1044. doi: 10.1021/acs.est.0c06411. - DOI - PubMed

Publication types