. 2022 Jan 10;57(1):80-94.e7.
doi: 10.1016/j.devcel.2021.12.004. Epub 2021 Dec 22.

chinmo-mutant spermatogonial stem cells cause mitotic drive by evicting non-mutant neighbors from the niche

Affiliations

chinmo-mutant spermatogonial stem cells cause mitotic drive by evicting non-mutant neighbors from the niche

Chen-Yuan Tseng et al. Dev Cell. .

Abstract

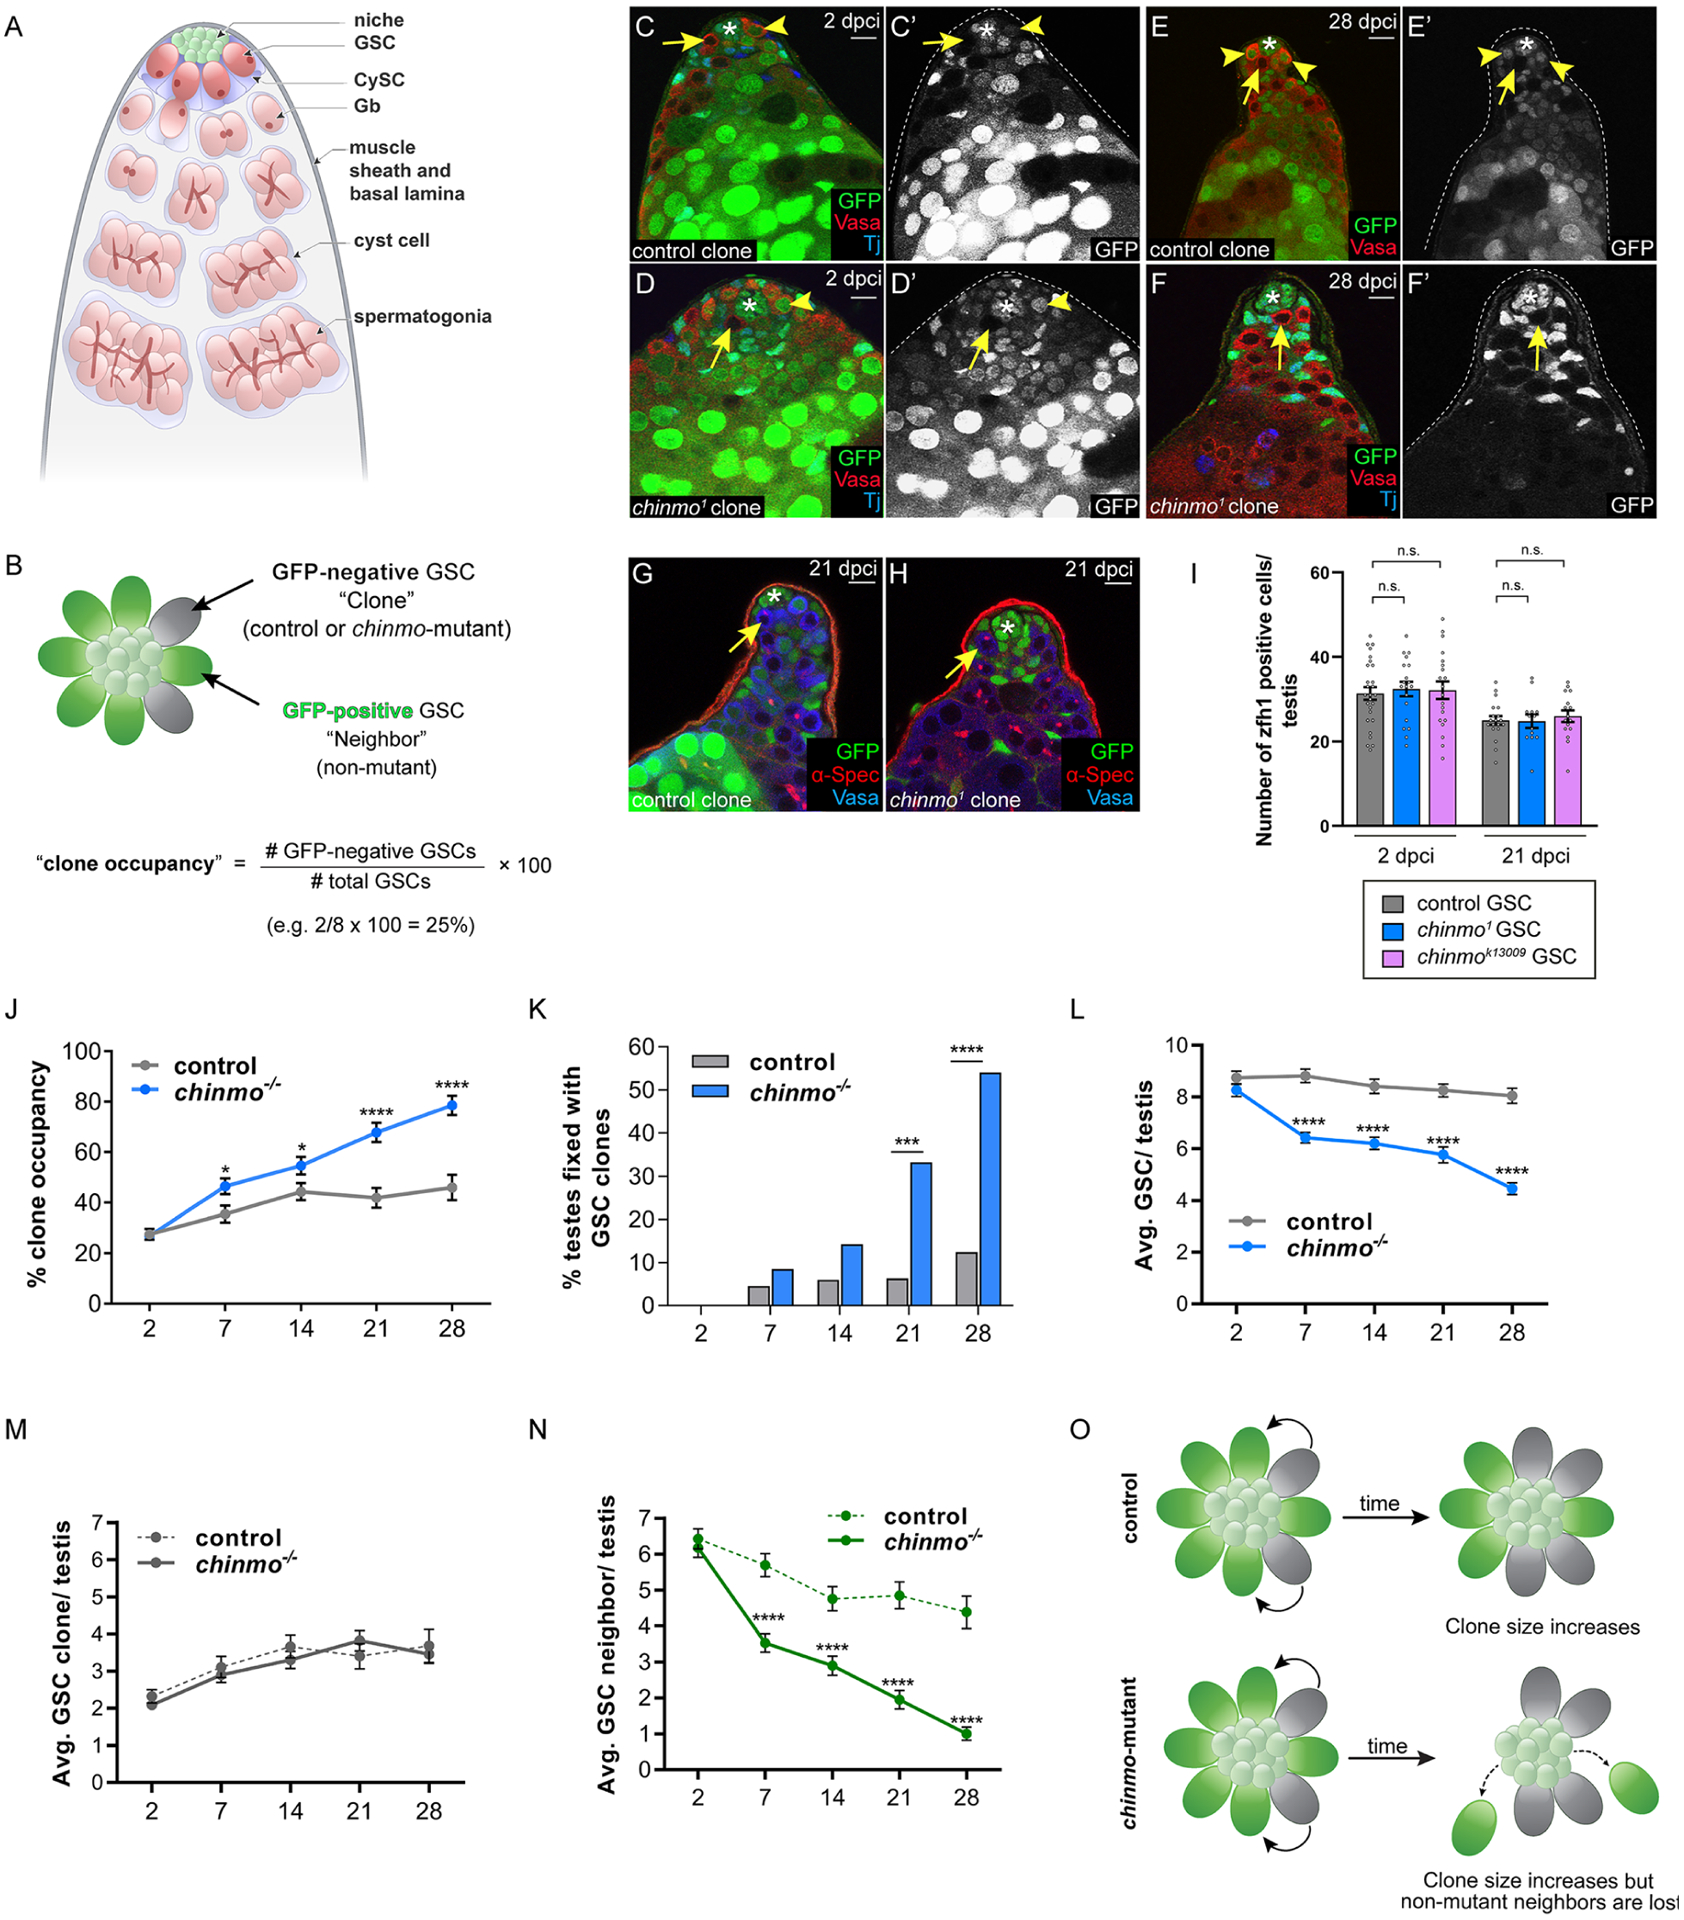
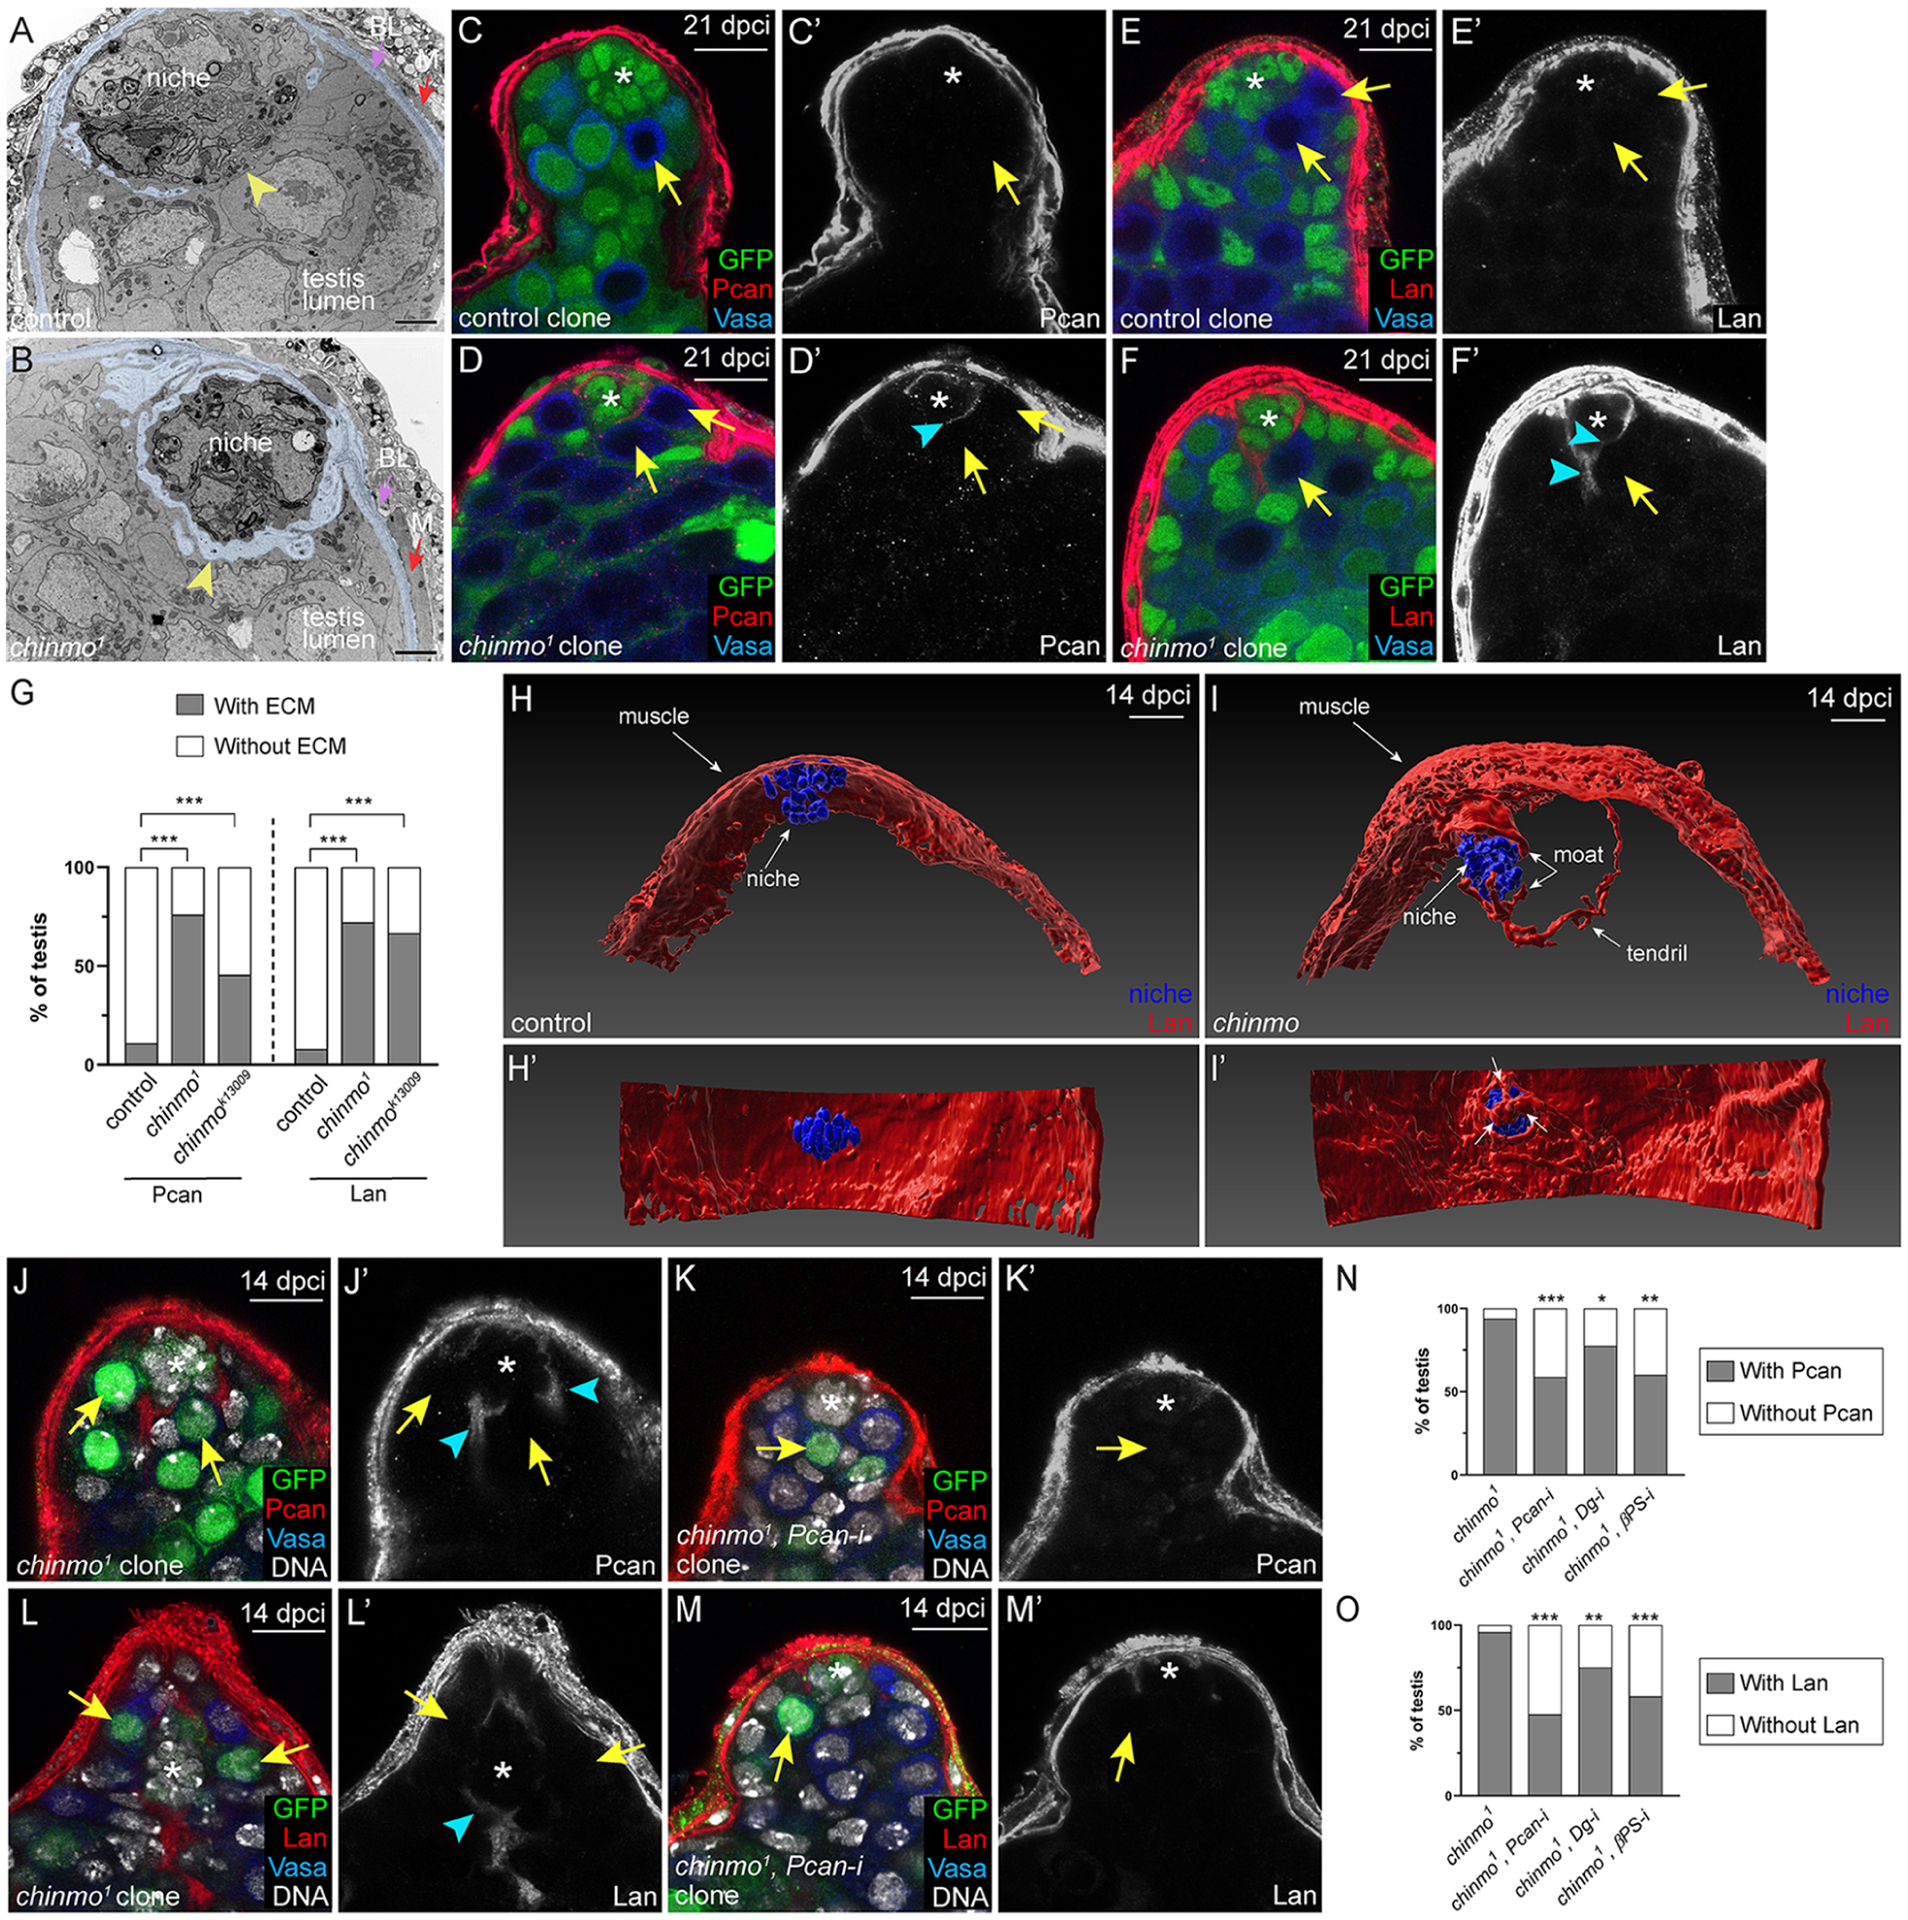
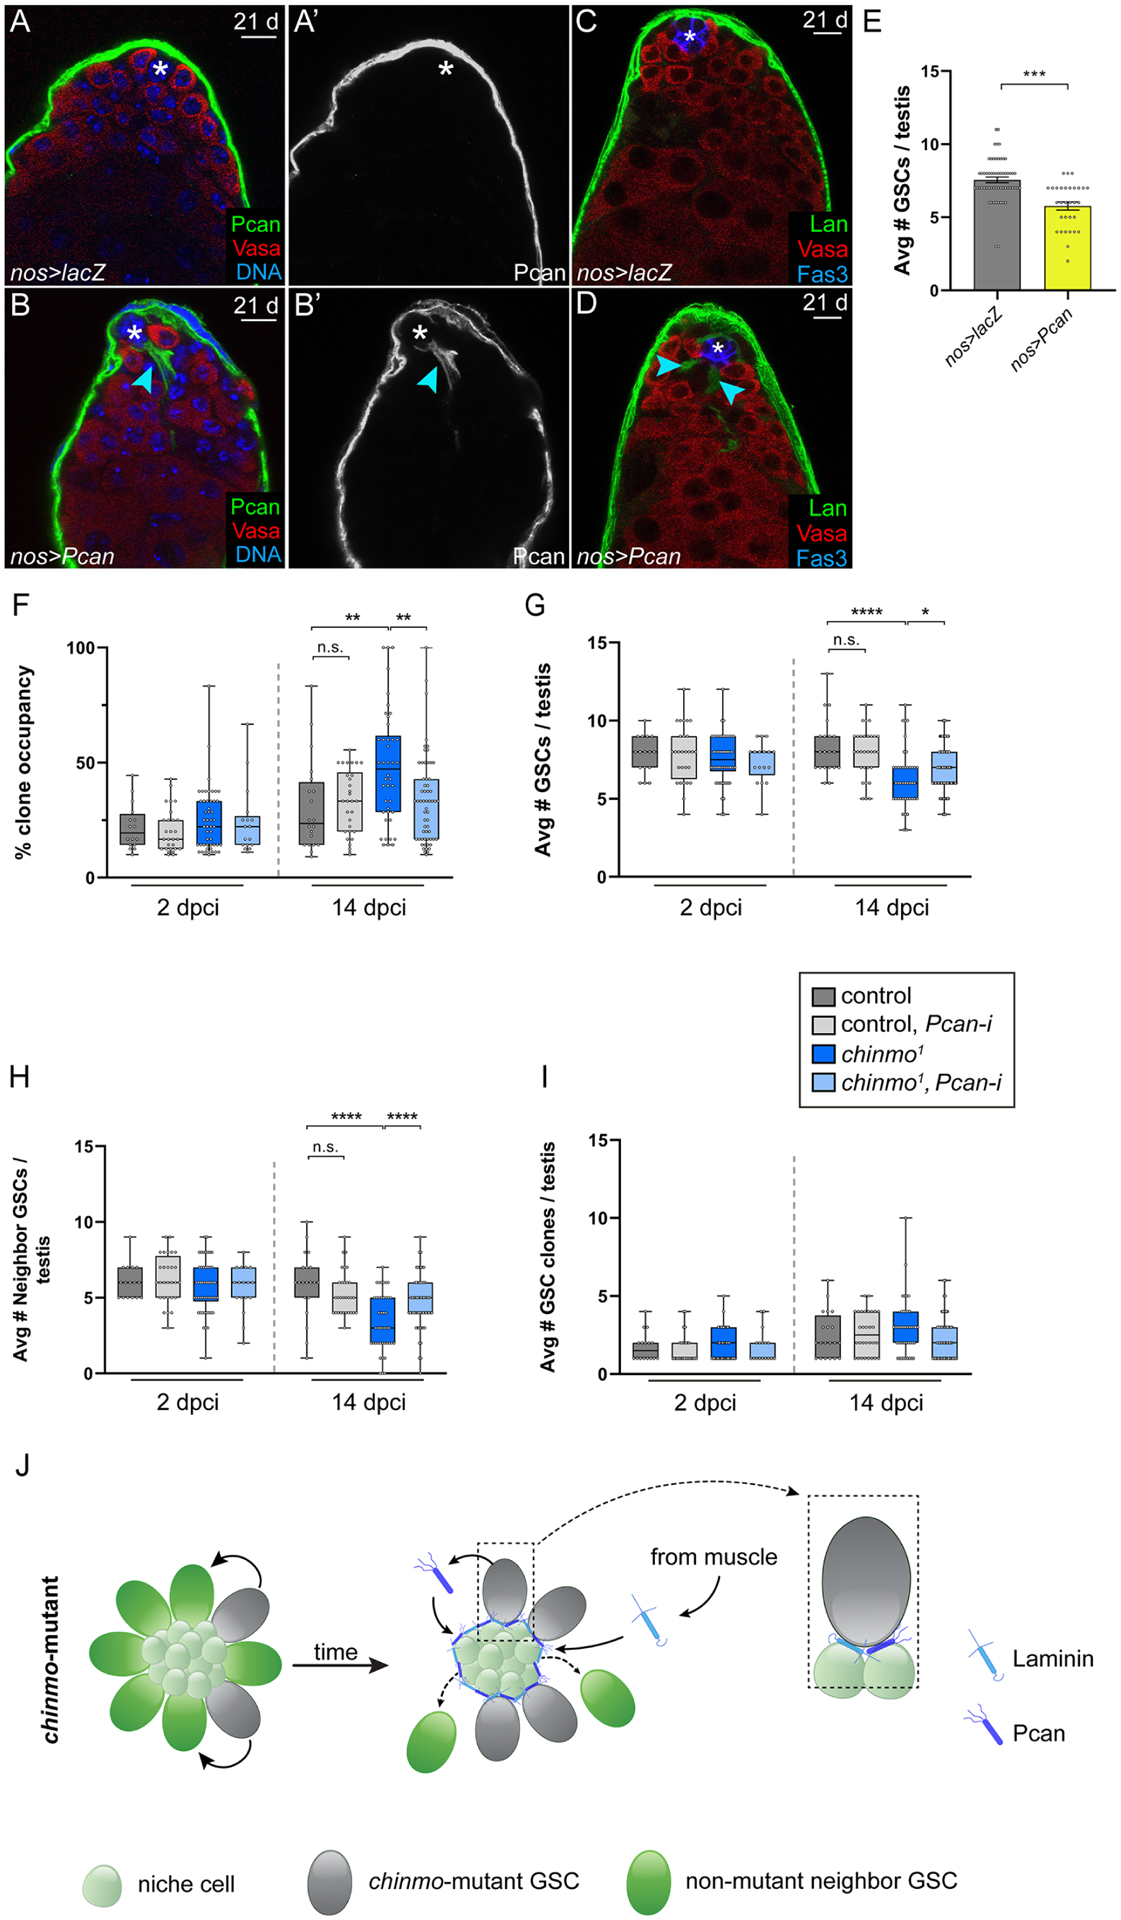
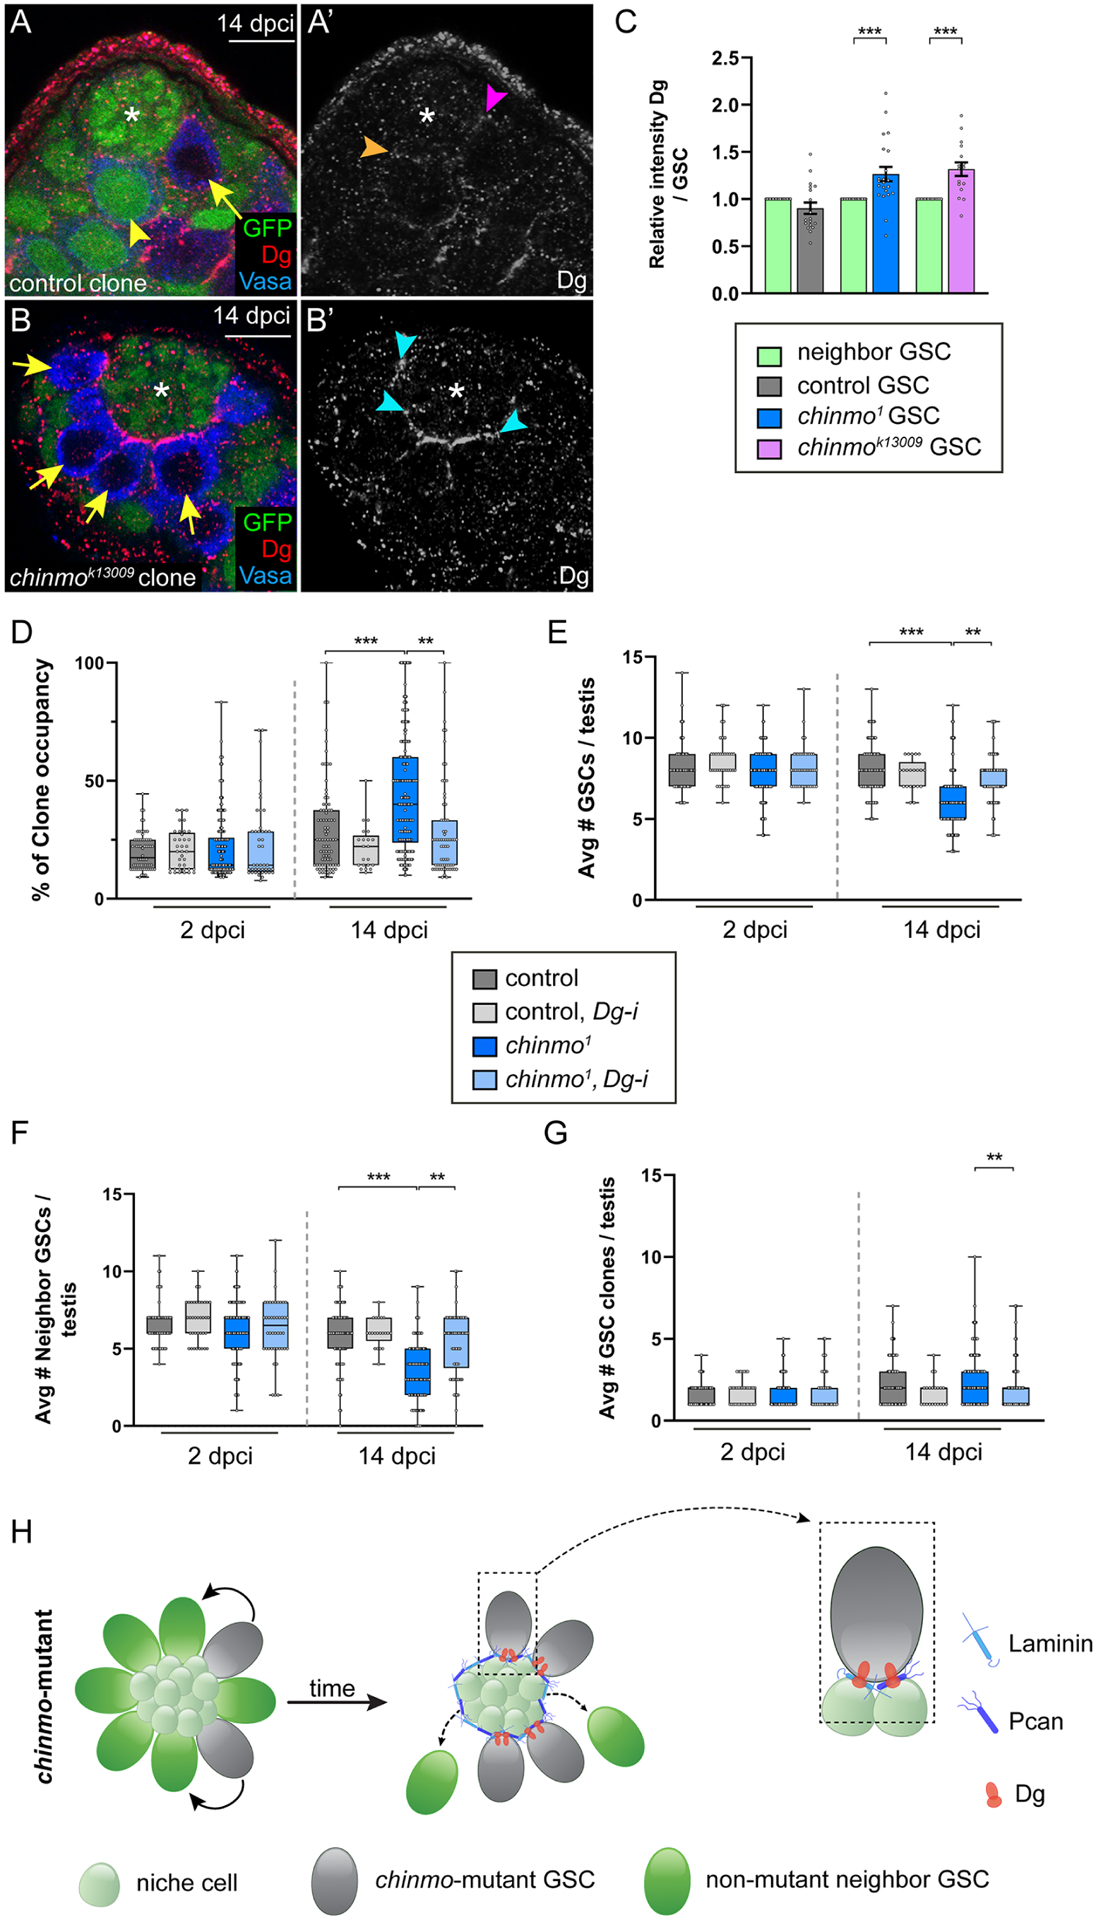
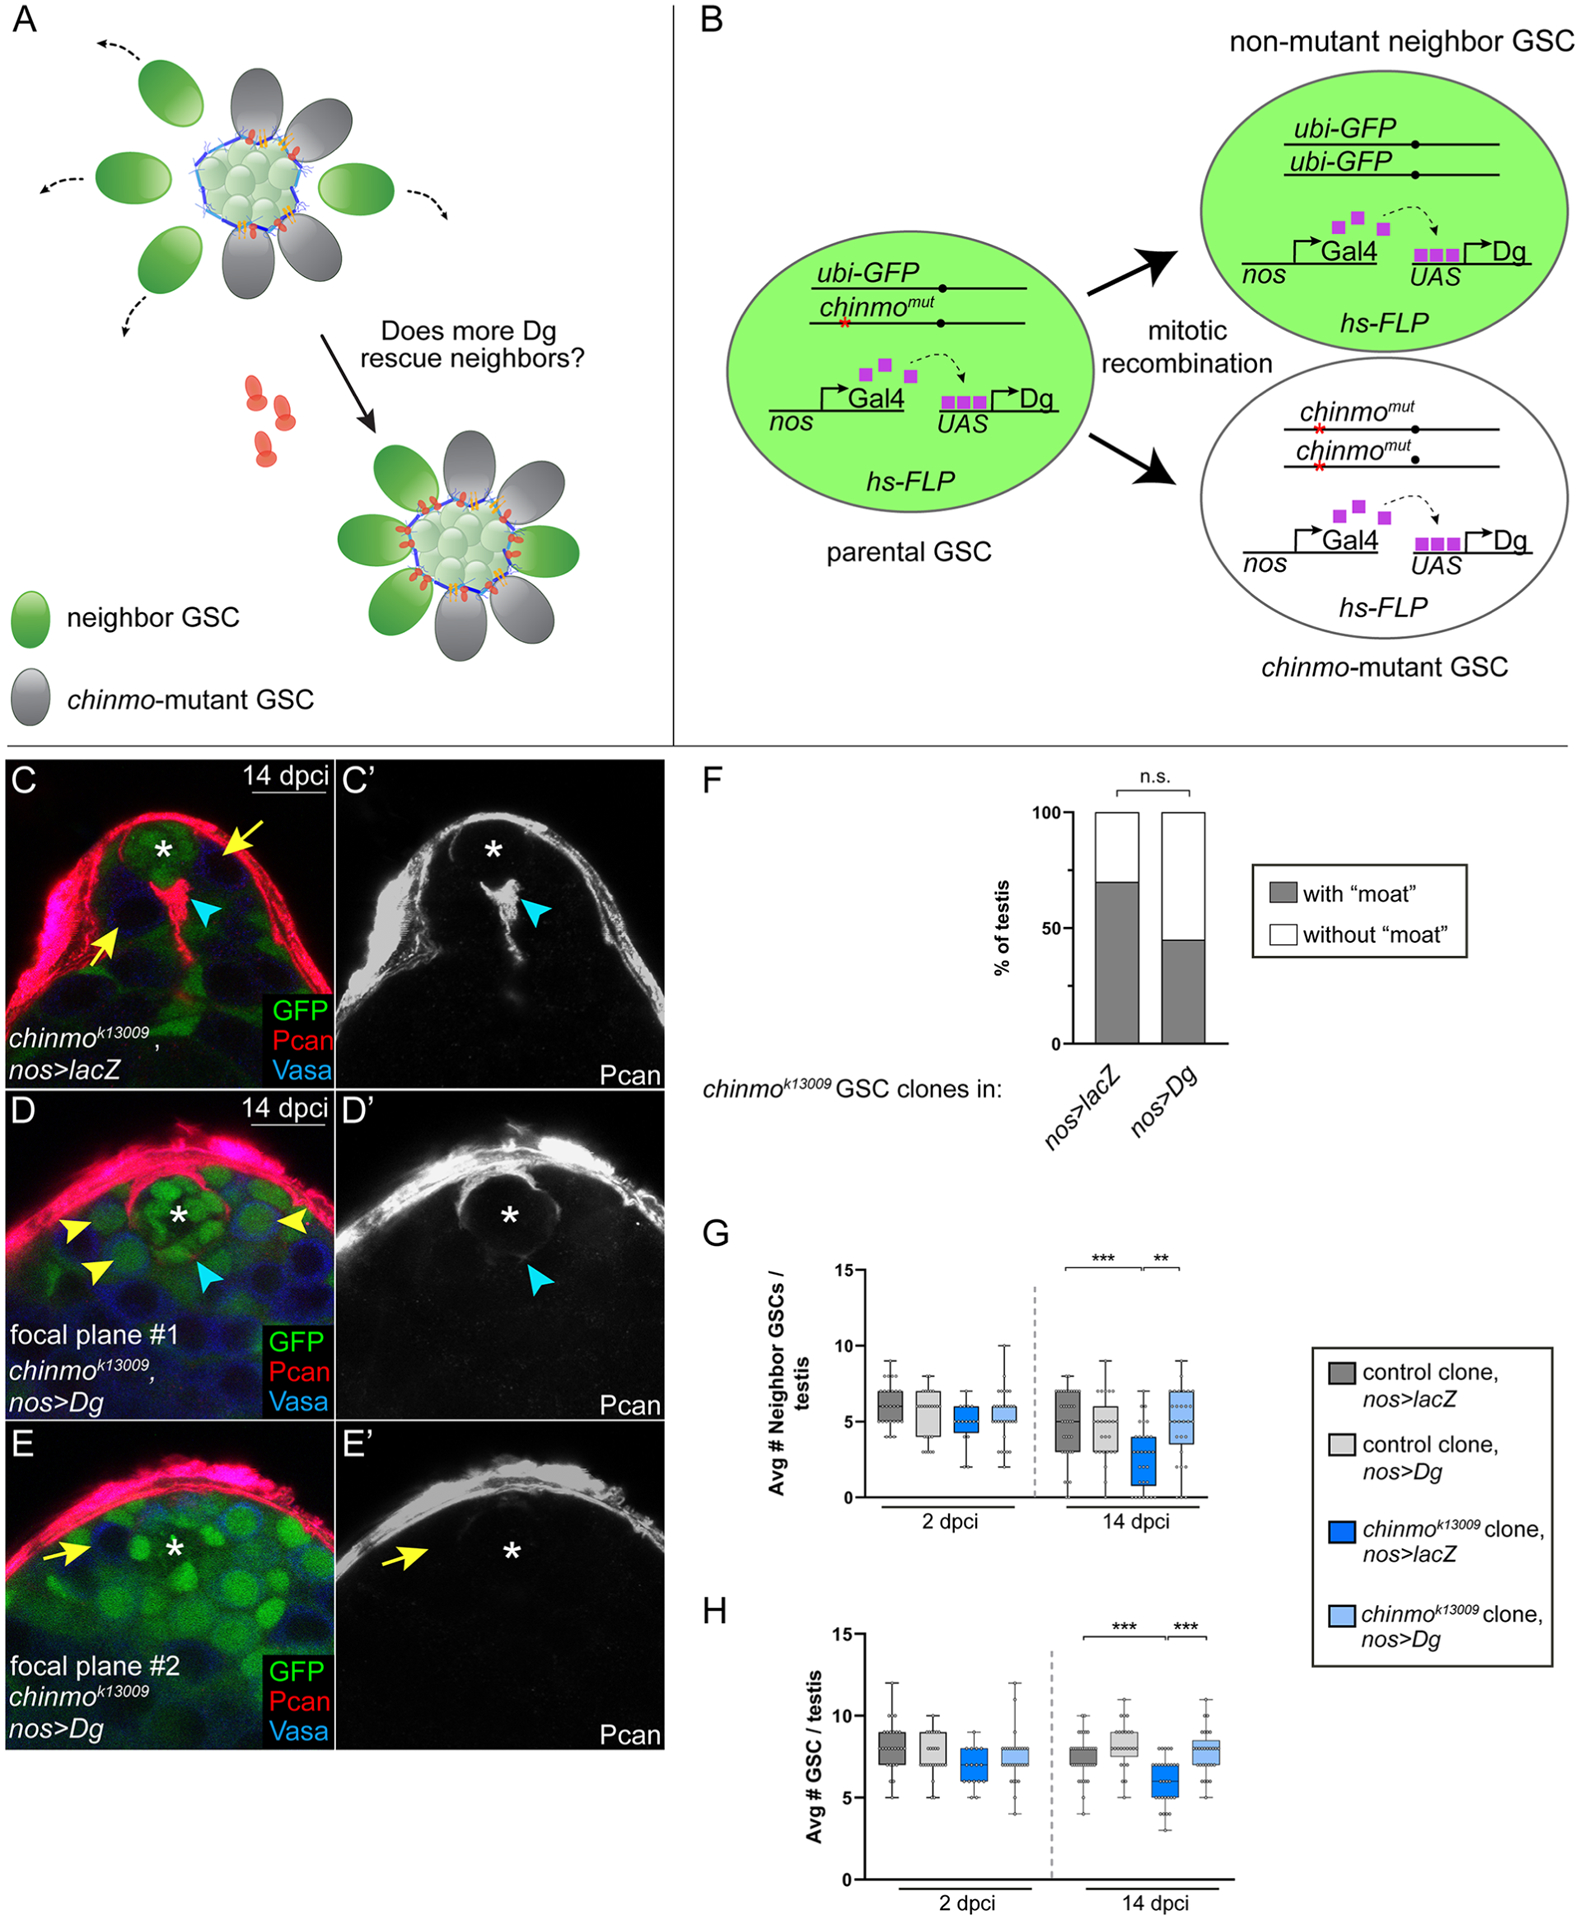
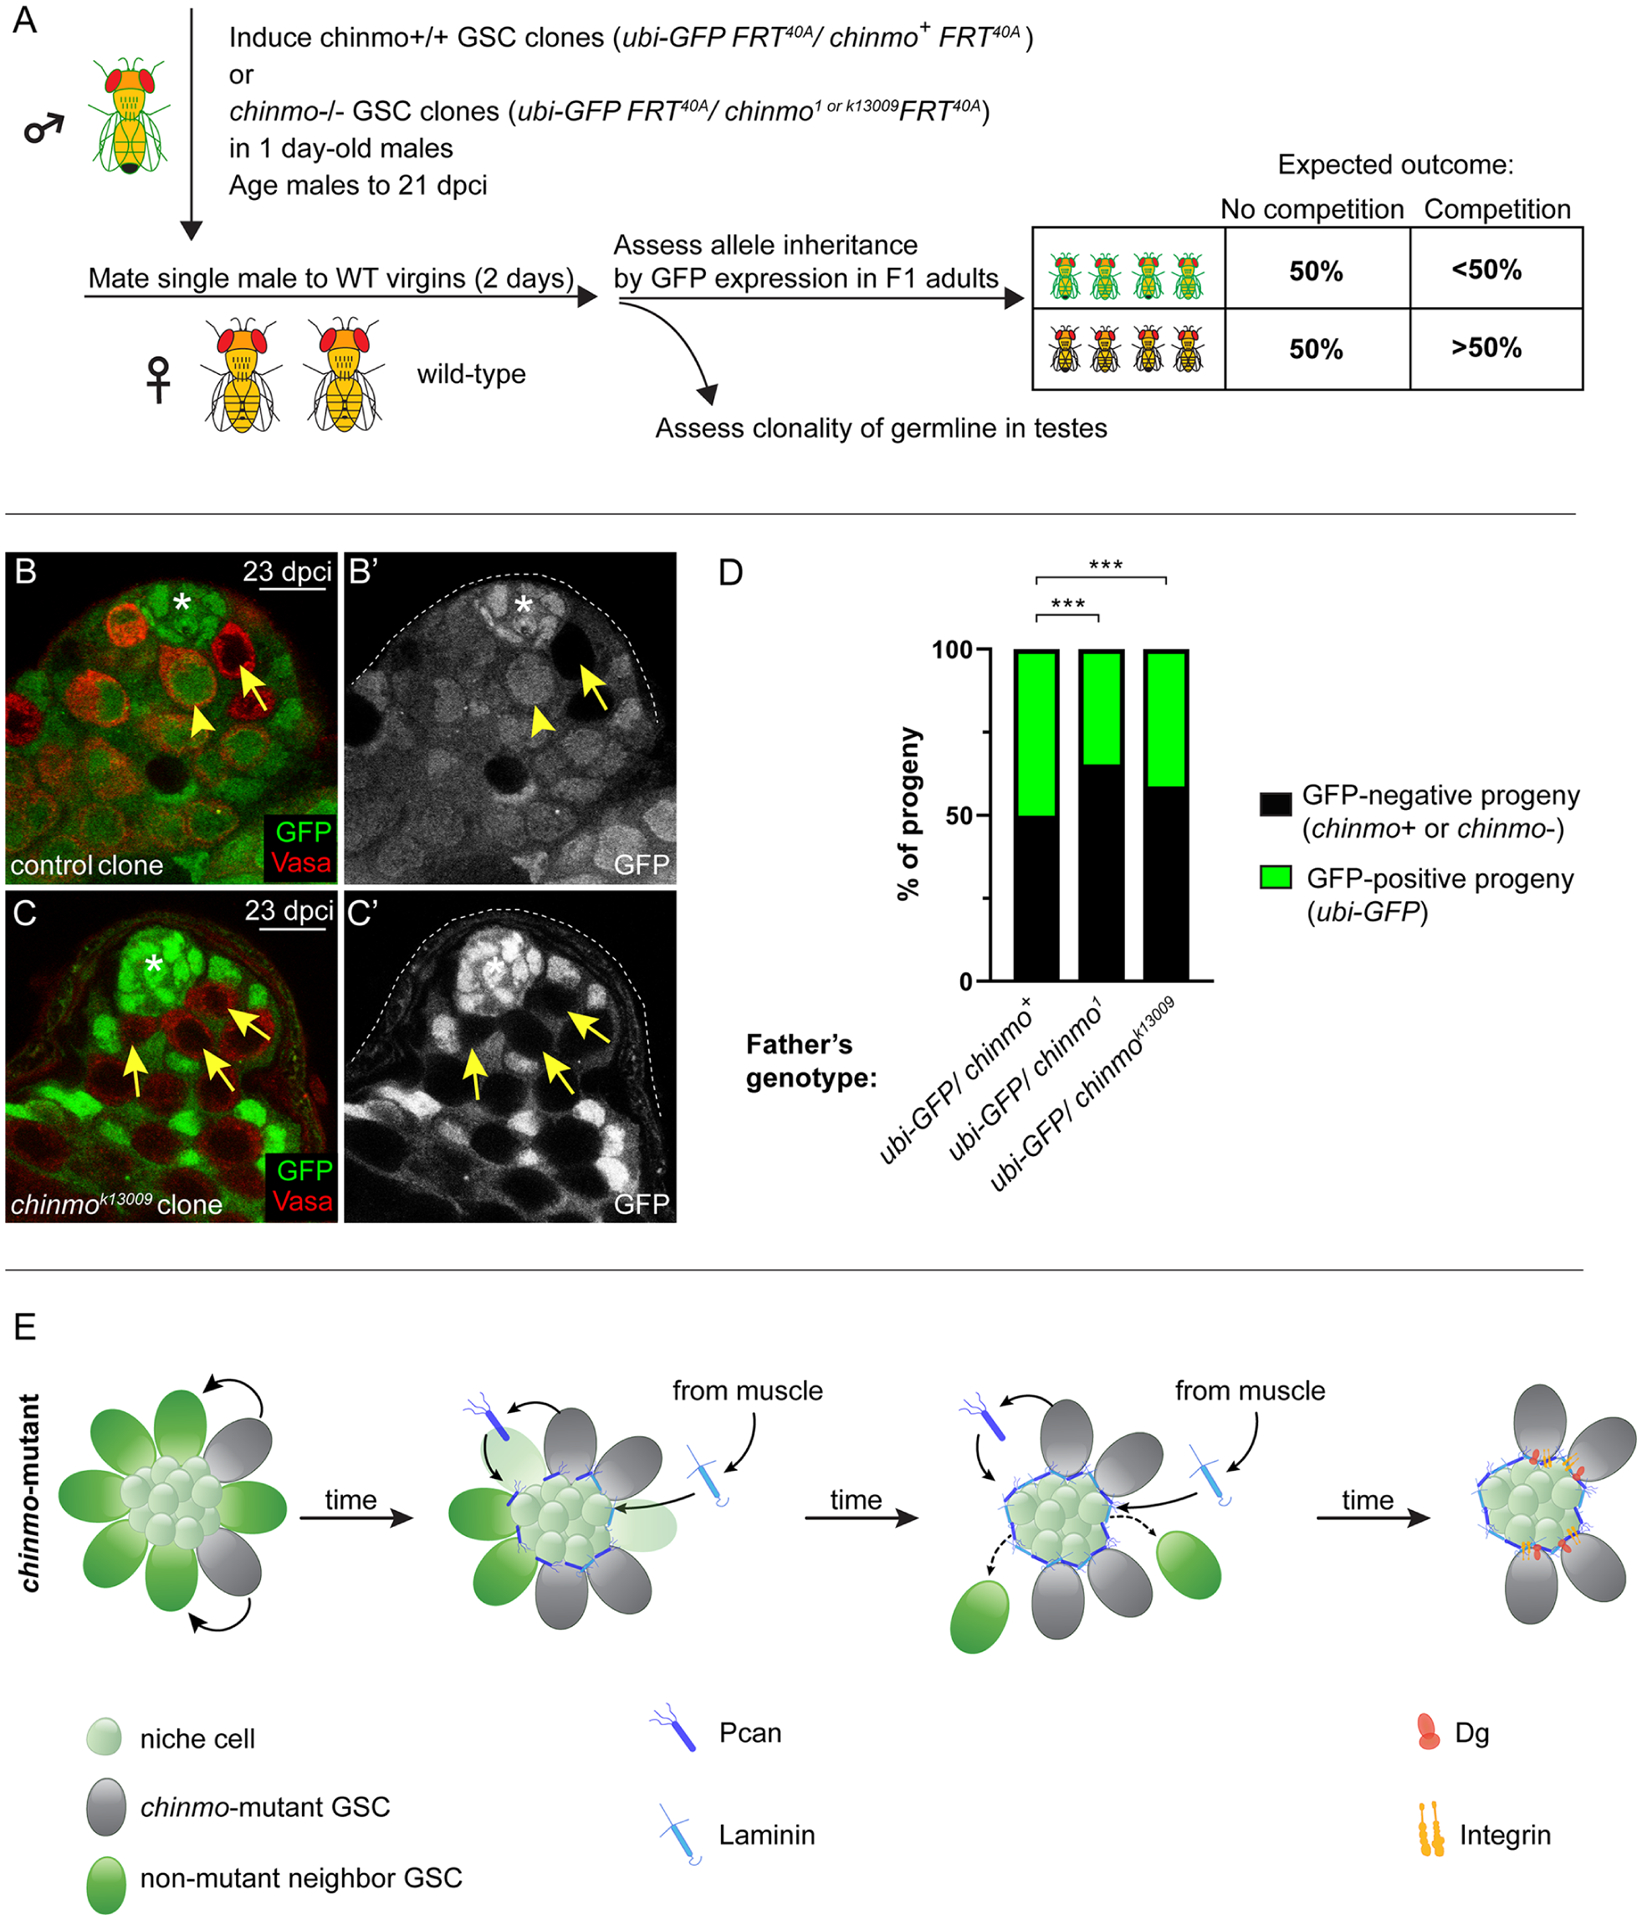
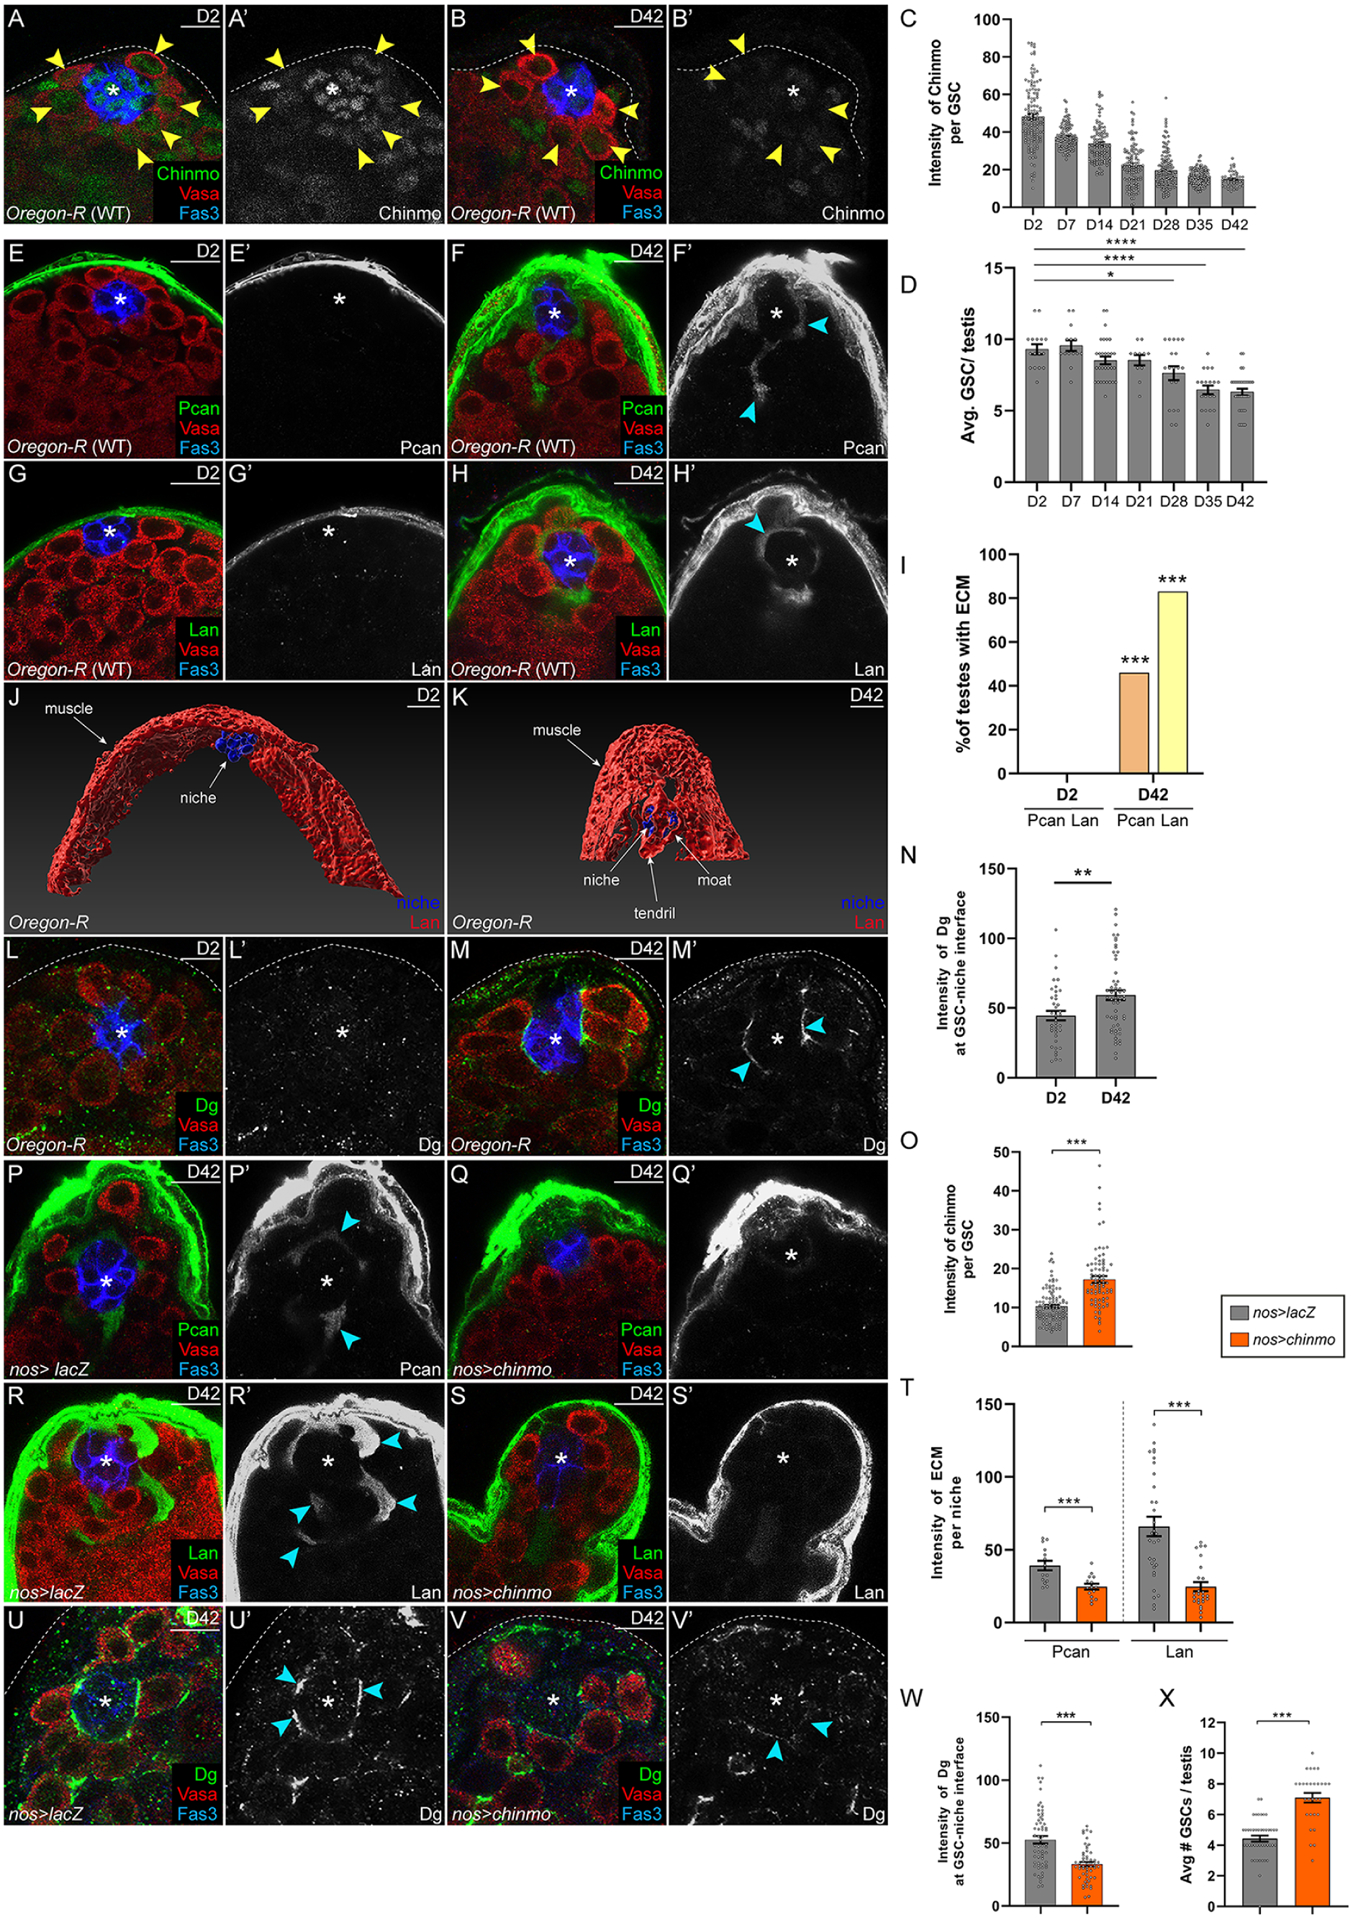
Niches maintain a finite pool of stem cells via restricted space and short-range signals. Stem cells compete for limited niche resources, but the mechanisms regulating competition are poorly understood. Using the Drosophila testis model, we show that germline stem cells (GSCs) lacking the transcription factor Chinmo gain a competitive advantage for niche access. Surprisingly, chinmo-/- GSCs rely on a new mechanism of competition in which they secrete the extracellular matrix protein Perlecan to selectively evict non-mutant GSCs and then upregulate Perlecan-binding proteins to remain in the altered niche. Over time, the GSC pool can be entirely replaced with chinmo-/- cells. As a consequence, the mutant chinmo allele acts as a gene drive element; the majority of offspring inherit the allele despite the heterozygous genotype of the parent. Our results suggest that the influence of GSC competition may extend beyond individual stem cell niche dynamics to population-level allelic drift and evolution.

Keywords: Drosophila; Dystroglycan; Perlecan; aging; biased inheritance; chinmo; competition; germline stem cell; niche; testis.


Conflict of interest statement

Declaration of interests The authors declare no competing interests.

Figures

Figure 1:
Figure 1:. chinmo−/− GSCs dominate the niche by evicting non-mutant GSCs.
(A) The adult Drosophila testis. A GSC produces a gonialblast (Gb), which undergoes transita-mplifying divisions to produce spermatogonia that differentiate into sperm. CySCs divide to produce cyst cells, two of which envelope a Gb and its descendants. (B) The clone occupancy assay. In a WT testis, 8 GSCs surround the niche. GSC clones (either control or chinmo−/−) lack GFP. The other GSCs (labeled “neighbors”) are not mutant and express GFP. Clone occupancy is measured by dividing the number of GSC clones by the total number of GSCs in that testis. (C-F) Confocal images of testes with control (C,E, arrows) or chinmo−/− (D,F, arrows) GSC clones at 2 (C,D) or 28 (E,F) dpci. Clones lack GFP. Vasa (red) marks germ cells. Tj (blue) marks the nuclei of CySCs and early cyst cells. Arrowheads mark non-mutant GSC neighbors. (G-H) Confocal images of testes with control (G, arrow) or chinmo−/− (H, arrow) clones at 21 dpci stained with αSpectrin (red) to mark the fusome. Clones lack GFP. Vasa (blue). (I) Graph showing the number of Zfh1-positive CySCs in testes with control (gray), chinmo1 (blue) and chinmok13009 GSC clones (purple) at 2 and 28 dpci. (J) Graph showing clone occupancy of control (gray) and chinmo−/− (blue) GSC clones at 2, 7, 14, 21, 28 dpci. (K) Graph showing percent monoclonal testes within the GSC lineage at 2, 7, 12, 21 and 28 dpci when control (gray) or chinmo−/− (blue) GSC clones are present. (L) Graph showing the average total number of GSCs in testes with control (gray) or chinmo−/− GSC clones (blue) at 2, 7, 14, 21 and 28 dpci. (M) Graph showing the average number of control (dashed line) or chinmo−/− (solid line) GSC clones at 2, 7, 14, 21 and 28 dpci. (N) Graph showing non-mutant GSC neighbors in testes with control (dashed line) or chinmo−/− (solid line) GSC clones at 2, 7, 14, 21 and 28 dpci. (O) Model. Control GSC clones (gray cells, upper panel) and chinmo−/− GSC clones (gray cells, lower panel) are induced at the same low frequency. Over time, both types of clones expanded to a similar extent (gray cells). chinmo−/− clones cause the loss of non-mutant neighbor GSCs (green cells, lower panel) and this does not occur to the non-mutant neighbors (green cells, upper panel) of control GSC clones. In C-F, G,H, an asterisk marks the niche. Scale bar = 10 μM In I,J,L,M,N, error bars represent SEM. n.s. = not significant; * P ≤ 0.05; *** P ≤ 0.001; **** P ≤ 0.0001 as assessed by Student’s t-test (I,J,LM,N) or by χ2 test (K). See also Table S1, Fig. S1.
Figure 2:
Figure 2:. chinmo−/− GSCs create a “moat” around the niche by secreting Pcan
(A,B) TEMs of testes with control (A) or chinmo1 (B) GSC clones at 28 dpci. The micrographs are pseudocolored to show ECM-like material (light blue) in the muscle basal lamina (“BL”, purple arrowhead in A,B) or in the testis lumen (yellow arrowhead, B). Yellow arrowheads indicate GSC-niche interface. Magnification 5,600x. Scale bar is 2 μM. (C-F) Pcan (C,D, red) and Lan (E,F, red) in testes with control (C,E arrows) chinmo−/− GSC (D,F, arrow) clones at 21 dpci. Arrowhead (D’,F’) indicates ectopic ECM. (G) Graph quantifying the percentage testes with (gray portion of bar) or without (white portion of bar) ECM proteins Pcan or Lan surrounding the niche when control, chinmo1 or chinmok13009 clones are present. (H,I) Imaris-generated view of a testis with control (H) or chinmo−/− (I) GSC clones (not shown) at 14 dpci. Niche cells (blue) are visible as a ball, and some niche cells adhere to Lan (red) present in the muscle (H,I). In I, some niche cells are partially obscured by a distended “hat” of Lan (red, upper arrow labeled “moat”) that is contiguous with Lan in the muscle. In I, there is ectopic Lan in the testis lumen, which form three “claws” on distal niche cells (lower arrow labeled “moat”). A “tendril” of ectopic Lan extends to the right. In H’,I’, the testis is rotated 90°. All niche cells are visible in H’, but in I’ several niche cells are covered by Lan (arrows). (J-M) Expression of Pcan (red in J,K) and Lan (red in L,M) around the niche when chinmo−/− GSC clones (J,L) or chinmo−/− clones depleted for Pcan (K,M) are present. Arrowheads indicate ectopic ECM. (N-O) Graph quantifying the percentage of testes with (gray portion of bar) or without (white portion of bar) Pcan (N) or Lan (O) in the moat when chinmo−/− clones (first bars), chinmo−/− clones depleted for Pcan (second bars), for Dg (third bars) or for βPS (fourth bars) are present. In A-F, clones lack GFP. In H-M, clones express GFP. In C-F, J-M, Vasa is blue and an asterisk marks the niche. Scale bar = 10 μM * P ≤ 0.05; ** P ≤ 0.01; *** P ≤ 0.001 as assessed by χ2 test. See also Figs. S1, S2, S4, S7.
Figure 3:
Figure 3:. chinmo−/− GSCs require Pcan to evict non-mutant neighbors
(A,D) Confocal images of nos>lacZ (A,C) or nos>Pcan (B,D) testes in which Pcan was mis-expressed in all GSCs for 21 days. Arrowheads (B,B’,D) indicate ectopic ECM. Pcan (green, A,B); Lan (green, C,D); Vasa (red) and DNA (ToPro, blue A,B); Fas3 (blue, C,D). (E) Graph showing average number of GSCs in nos>lacZ (gray) or nos>Pcan (yellow) testes. (F-I) Box and whisker plots showing clone occupancy (F), average total number of GSCs (G), average number of non-mutant GSC neighbors (H); average number of clones (I) in testis with control GSC clones (dark gray bars), with control GSC clones depleted for Pcan (light gray bars), with chinmo−/− GSC clones (dark blue bars) or chinmo−/− GSC clones depleted for Pcan (light blue bars) at 2 and 14 dpci. (J) Model: chinmo−/− GSC clones (gray cells) secrete Pcan (dark blue symbol), which seeds the moat. Lan (light blue symbol) is recruited from the muscle BL. Boxed area at right illustrates a chinmo−/− GSC clone in contact with the moat. By contrast, non-mutant neighbor GSCs (green stem cells in middle cartoon) are lost from the niche. The smaller, light green cells are niche cells. Scale bar = 10 μM In F-I, error bars represent SEM. n.s. = not significant; * P ≤ 0.05; ** P ≤ 0.01; *** P ≤ 0.001; **** P ≤ 0.0001, as assessed by Student’s t-test. See also Table S1, Figs. S1, S3, S7.
Figure 4:
Figure 4:. chinmo−/− GSCs require Dg to remain in the altered niche
(A,B) Confocal images of Dg (red) in testes harboring control (A, arrow) or chinmok13009-mutant GSC clones (B, arrows) at 14 dpci. Orange arrowhead (A’), magenta arrowhead (A’) and blue arrowheads (B’) indicate Dg at the GSC-niche in a non-mutant GSC neighbor, a control clone and a chinmo−/− GSC, respectively. Clones lack GFP. Neighbors (yellow arrowhead) express GFP. Vasa (blue). (C) Graph of relative Dg expression at the GSC-niche interface in control, chinmo1 or chinmok13009 GSC clones relative to that of neighbor GSCs in the same testis. (D-G) Box and whisker plots showing clone occupancy (D), average total number of GSCs (E), average number of non-mutant GSC neighbors (F), and average numbers of GSC clones (G) in testes with control GSC clones (dark gray bars), with control GSC clones depleted for Dg (light gray bars), with chinmo−/− GSC clones (dark blue bars) or chinmo−/− GSC clones depleted for Dg (light blue bars) at 2 and 14 dpci. (H) Model: chinmo−/− GSC clones (gray cells) have increased Dg (orange symbol) at the GSC-niche interface, allowing them to remain in the resculpted niche. Boxed area at right illustrates a chinmo−/− GSC clone remaining in contact with the moat through increased localized Dg expression. Non-mutant neighbor GSCs do not have increased Dg at the GSC-niche interface and cannot remain long-term in the niche. Scale bar = 10 μM In D-G, error bars represent SEM. * P ≤ 0.05; ** P ≤ 0.01; *** P ≤ 0.001; **** P ≤ 0.0001, as assessed by Student’s t-test. See also Table S1, Figs. S1, S4, S5, S6.
Figure 5:
Figure 5:. Neighbors are rescued from competition when provide with ectopic Dg
(A) Model: If non-mutant neighbor GSCs (green) are provided with increased Dg (dark orange), they should be able to remain in the niche despite the induction of chinmo−/− GSC clones (gray) and the formation of the moat (Pan, Lan, blue symbols). Yellow symbols represent integrins. (B) In the “neighbor rescue” assay, chinmo−/− clones (abbreviated chinmomut) were generated in a background where all GSCs express UAS-Dg driven by the GSC driver nos-Gal4. We scored the number of non-mutant neighbors at 2 and 14 dpci (see G), average number of GSCs (see H) and presence a moat (see C,D,F). (C-E) Pcan (red) in testes containing chinmok13009 GSC clones in nos>lacZ (C) or nos>Dg (D). The chinmo clone is not visible in D (“focal plan #1”) but is visible in E (arrow, “focal plane #2”). Clones lack GFP. Pcan (red). Vasa (blue). (F) Graph showing percentage of testes with a “moat” when chinmok13009 GSC clones are generated in a nos>lacZ or nos>Dg background. (G, H) Box and whisker plots showing average number of non-mutant GSC neighbors (G) or average number of GSCs (H) in testis with control GSC clones in nos>lacZ (dark gray bars), control GSC clones in nos>Dg (light gray bars), chinmok13009 GSC clones in nos>lacZ (dark blue bars), or chinmok13009 GSC clones in nos>Dg (light blue bars) at 2 and 14 dpci. Scale bar = 10 μM In G,H, error bars represent SEM. n.s. = not significant; ** P ≤ 0.01; *** P ≤ 0.001 as assessed by Student’s t-test (G,H) and by χ2 test (F). See also Table S2.
Figure 6:
Figure 6:. GSC competition causes biased inheritance
(A) Schematic of the “inheritance assay” - see STAR Methods for details. Box shows expected outcomes. (B,C) Confocal images of a testis with a control (B,B’, arrow) or a chinmok13009 GSC clone (C,C’, arrows) at 23 dpci. Non-mutant neighbor GSCs are marked by an arrowhead. The only GFP-positive cells in C are somatic support cells. Clones lack GFP. Vasa is red. (D) Graph showing inheritance of the chinmo chromosome (chinmo+, chinmo1 or chinmok13009 allele) (in black) or the ubi-GFP chromosome (in green). (E) Model. chinmo−/− GSC clones (gray) secrete Pcan (dark blue), which causes the moat. Lan (light blue) is recruited to the moat from the muscle BL. chinmo−/− GSC clones increase Dg (orange) and βPS integrin (yellow) at the GSC-niche interface, allowing them to remain in the resculpted niche but non-mutant neighbor GSCs (green cells) do not and differentiate. Scale bar = 10 μM *** P ≤ 0.001 as assessed by χ2 test (D). See also Table S3.
Figure 7:
Figure 7:. Age-related phenotypes of the testis stem cell niche are caused by declining Chinmo levels in GSCs
(A-D) Confocal images of young (2-day-old) (A) or aged (42-day-old) (B) WT testes. Chinmo (green). Arrowheads indicate GSCs in A,B. (C,D) Graphs showing Chinmo levels in GSCs (C) and average number of GSCs/testis (D) during aging. (E-H) Confocal image of Pcan (green in E,F) and Lan (green in G,H) in young (E,G) and aged testes (F,H). (I) Graph showing percentage of testis with Pcan (orange) or Lan (yellow) surrounding the niche. (J,K) Imaris-generated views of young (J) and aged (K) testes. Niche cells (blue) are visible as a ball (J,K). In a young testis, some niche cells interact with Lan (red) present in muscle BL (J). In an aged testis, some niche cells are partially obscured by ectopic Lan (red) in the testis lumen (K). (L-N) Confocal image of young (L) and aged (M) testis stained with Dg (green). (N) Graph showing relative Dg levels at the GSC-niche interface in young or old testes. (O) Graph showing Chinmo intensity in GSCs in nos>lacZ (gray) or nos>chinmo (orange). (P-T) Confocal images of aged nos>lacZ (P,R) and aged nos>chinmo (Q,S) testes stained for Pcan (green in P,Q) or Lan (green in R,S). (T) Graph showing ECM intensity in aged nos>lacZ (gray) or aged nos>chinmo (orange) testes. (U-X) Confocal images of aged nos>lacZ (U) or aged nos>chinmo (V) testes stained with Dg (green). Arrowheads indicate Dg at GSC-niche interface. (W) Graph of Dg intensity at the GSC-niche interface in aged nos>lacZ (gray) or in aged nos>chinmo (orange) testes. (X) Graph showing number of GSCs in aged nos>lacZ (gray) or in aged nos>chinmo (orange) testes. In A,B,E-H,L,M,P-S,U,V, Vasa is red and Fas3 is blue. Scale bar = 10 μM In C,D,N,O,T,W,X, error bars represent SEM. * P ≤ 0.05; ** P ≤ 0.01; *** P ≤ 0.001; **** P ≤ 0.0001 as assessed by Student’s t-test (C,D,N,O,T,W,X) and by χ2 test (I). See also Table S1.

References

    1. AMOYEL M, ANDERSON J, SUISSE A, GLASNER J & BACH EA 2016. Socs36E Controls Niche Competition by Repressing MAPK Signaling in the Drosophila Testis. PLoS Genet, 12, e1005815. - PMC - PubMed
    1. AMOYEL M & BACH EA 2014. Cell competition: how to eliminate your neighbours. Development, 141, 988–1000. - PMC - PubMed
    1. AMOYEL M, SIMONS BD & BACH EA 2014. Neutral competition of stem cells is skewed by proliferative changes downstream of Hh and Hpo. EMBO J, 33, 2295–313. - PMC - PubMed
    1. BRAND AH & PERRIMON N 1993. Targeted gene expression as a means of altering cell fates and generating dominant phenotypes. Development, 118, 401–15. - PubMed
    1. BRAVO NUNEZ MA, NUCKOLLS NL & ZANDERS SE 2018. Genetic Villains: Killer Meiotic Drivers. Trends Genet, 34, 424–433. - PMC - PubMed

Publication types

MeSH terms