

Multimodal MRI cerebral correlates of verbal fluency switching and its impairment in women with depression
- PMID: 34942588
- PMCID: PMC8713114
- DOI: 10.1016/j.nicl.2021.102910
Multimodal MRI cerebral correlates of verbal fluency switching and its impairment in women with depression
Abstract
Background: The search of biomarkers in the field of depression requires easy implementable tests that are biologically rooted. Qualitative analysis of verbal fluency tests (VFT) are good candidates, but its cerebral correlates are unknown.
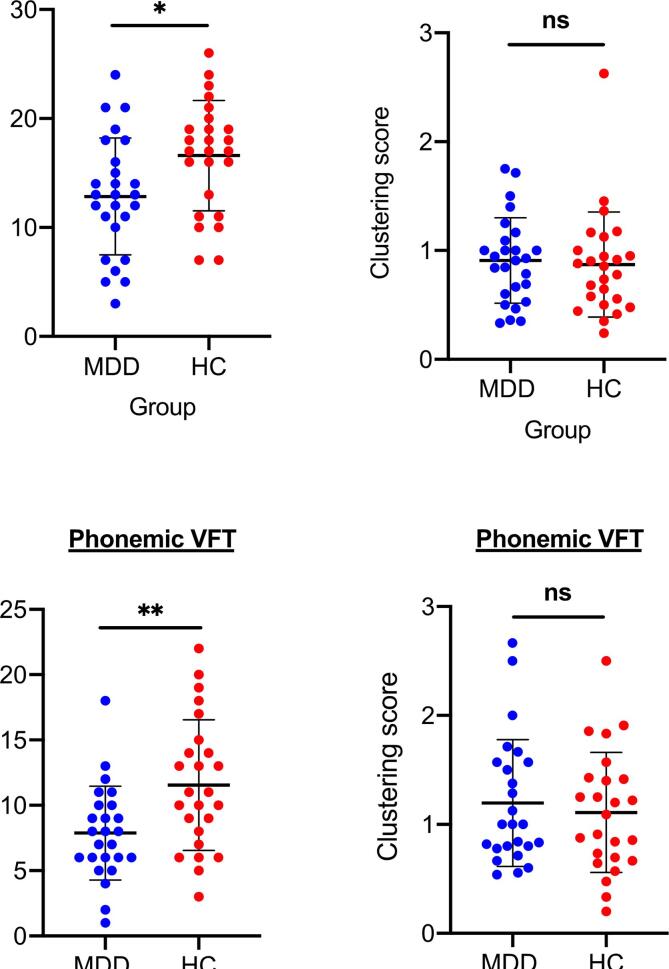
Methods: We collected qualitative semantic and phonemic VFT scores along with grey and white matter anatomical MRI of depressed (n = 26) and healthy controls (HC, n = 25) women. Qualitative VFT variables are the "clustering score" (i.e. the ability to produce words within subcategories) and the "switching score" (i.e. the ability to switch between clusters). The clustering and switching scores were automatically calculated using a data-driven approach. Brain measures were cortical thickness (CT) and fractional anisotropy (FA). We tested for associations between CT, FA and qualitative VFT variables within each group.
Results: Patients had reduced switching VFT scores compared to HC. Thicker cortex was associated with better switching score in semantic VFT bilaterally in the frontal (superior, rostral middle and inferior gyri), parietal (inferior parietal lobule including the supramarginal gyri), temporal (transverse and fusiform gyri) and occipital (lingual gyri) lobes in the depressed group. Positive association between FA and the switching score in semantic VFT was retrieved in depressed patients within the corpus callosum, right inferior fronto-occipital fasciculus, right superior longitudinal fasciculus extending to the anterior thalamic radiation (all p < 0.05, corrected).
Conclusion: Together, these results suggest that automatic qualitative VFT scores are associated with brain anatomy and reinforce its potential use as a surrogate for depression cerebral bases.
Keywords: Automatic speech analysis; Cortical Thickness; Fractional Anisotropy; Major depressive disorder; Switching; Verbal fluency.
Copyright © 2021. Published by Elsevier Inc.
Conflict of interest statement
The authors declare that they have no known competing financial interests or personal relationships that could have appeared to influence the work reported in this paper.
Figures


References
-
- James S.L., Abate D., Abate K.H., Abay S.M., Abbafati C., Abbasi N., et al. Global, regional, and national incidence, prevalence, and years lived with disability for 354 diseases and injuries for 195 countries and territories, 1990–2017: a systematic analysis for the Global Burden of Disease Study 2017. Lancet. 2018;392(10159):1789–1858. - PMC - PubMed
-
- Desai, R., Liebenthal, E., Possing, E.T., Waldron, E., Binder, J.R. 2005. Volumetric vs. surface-based alignment for localization of auditory cortex activation. Neuroimage 26(4), 1019–1029. - PubMed
-
- Lerch J.P., Evans A.C. Cortical thickness analysis examined through power analysis and a population simulation. Neuroimage. 2005;24(1):163–173. - PubMed
-
- Lerch J.P., Carroll J.B., Dorr A., Spring S., Evans A.C., Hayden M.R., Sled J.G., Henkelman R.M. Cortical thickness measured from MRI in the YAC128 mouse model of Huntington’s disease. NeuroImage. 2008;41(2):243–251. - PubMed
Publication types
MeSH terms
LinkOut - more resources
Full Text Sources
Medical
