. 2022 Feb;602(7897):487-495.
doi: 10.1038/s41586-021-04352-y. Epub 2021 Dec 23.

Evolution of enhanced innate immune evasion by SARS-CoV-2

Affiliations

Evolution of enhanced innate immune evasion by SARS-CoV-2

Lucy G Thorne et al. Nature. 2022 Feb.

Erratum in

  • Publisher Correction: Evolution of enhanced innate immune evasion by SARS-CoV-2.
    Thorne LG, Bouhaddou M, Reuschl AK, Zuliani-Alvarez L, Polacco B, Pelin A, Batra J, Whelan MVX, Hosmillo M, Fossati A, Ragazzini R, Jungreis I, Ummadi M, Rojc A, Turner J, Bischof ML, Obernier K, Braberg H, Soucheray M, Richards A, Chen KH, Harjai B, Memon D, Hiatt J, Rosales R, McGovern BL, Jahun A, Fabius JM, White K, Goodfellow IG, Takeuchi Y, Bonfanti P, Shokat K, Jura N, Verba K, Noursadeghi M, Beltrao P, Kellis M, Swaney DL, García-Sastre A, Jolly C, Towers GJ, Krogan NJ. Thorne LG, et al. Nature. 2022 Apr;604(7905):E14. doi: 10.1038/s41586-022-04653-w. Nature. 2022. PMID: 35332335 Free PMC article. No abstract available.

Abstract

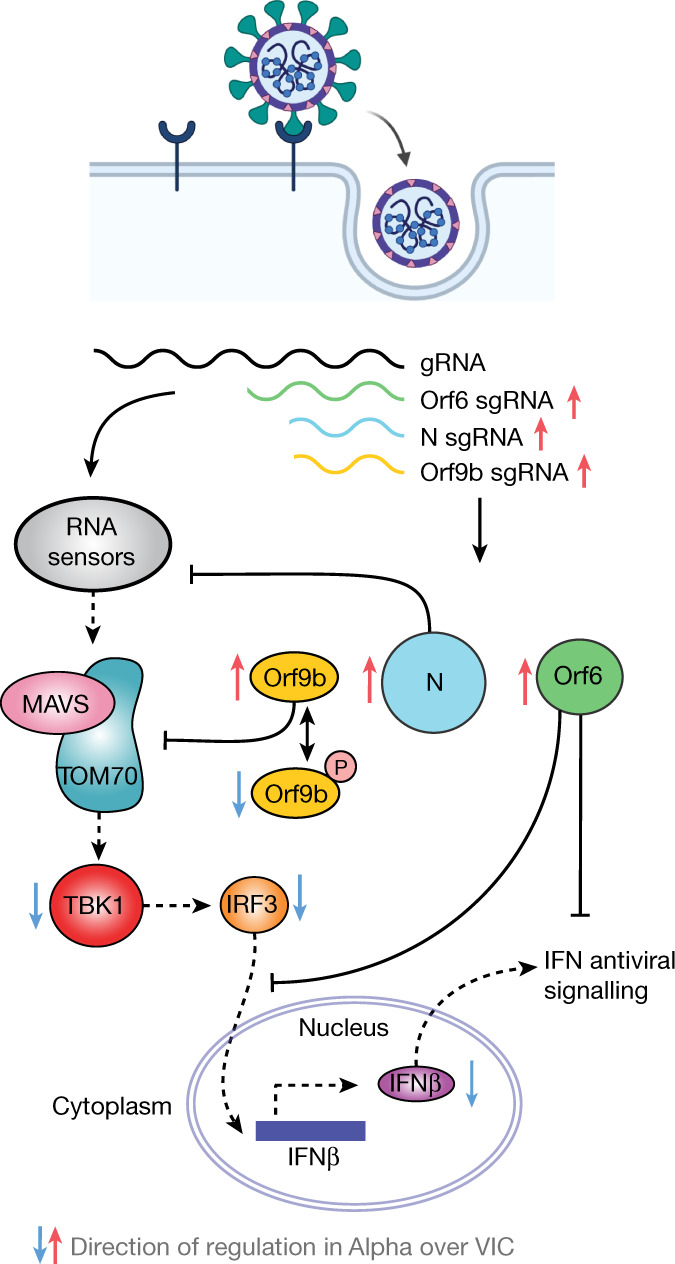
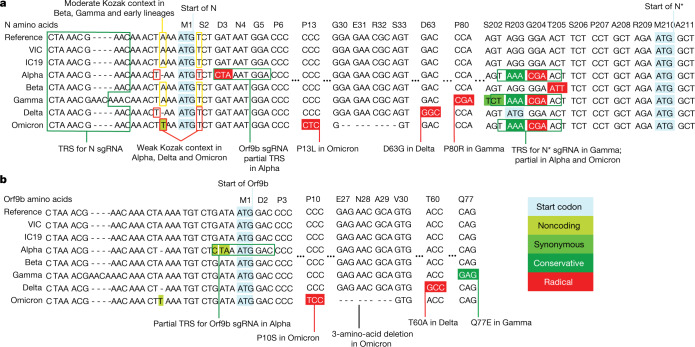
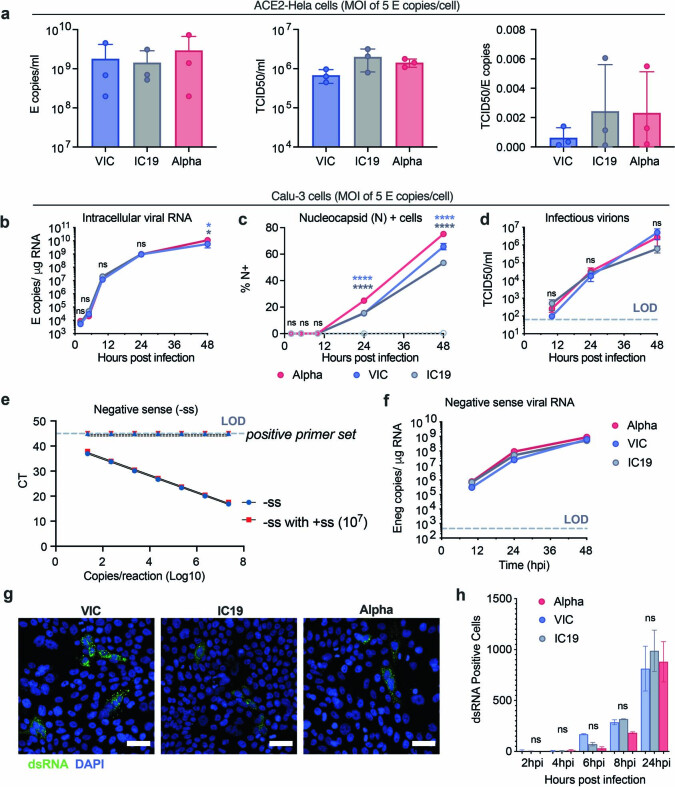
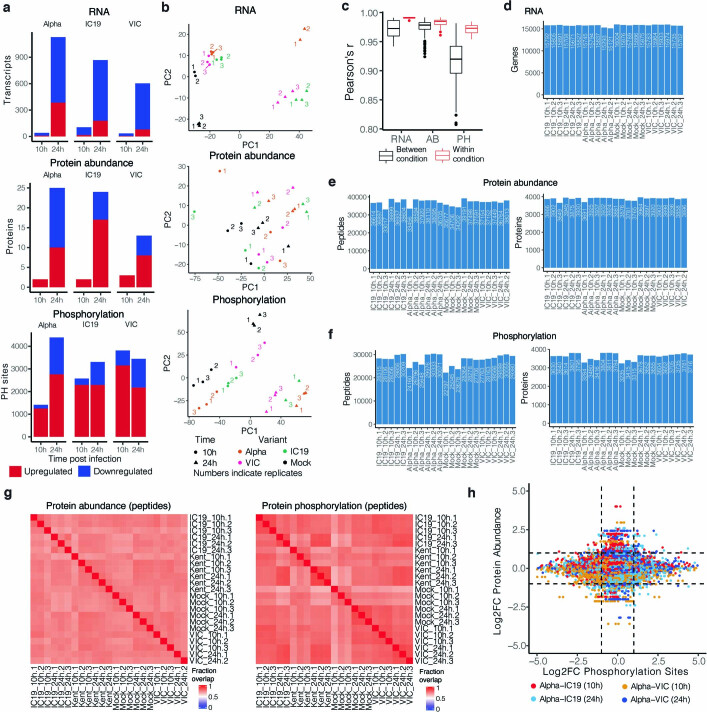
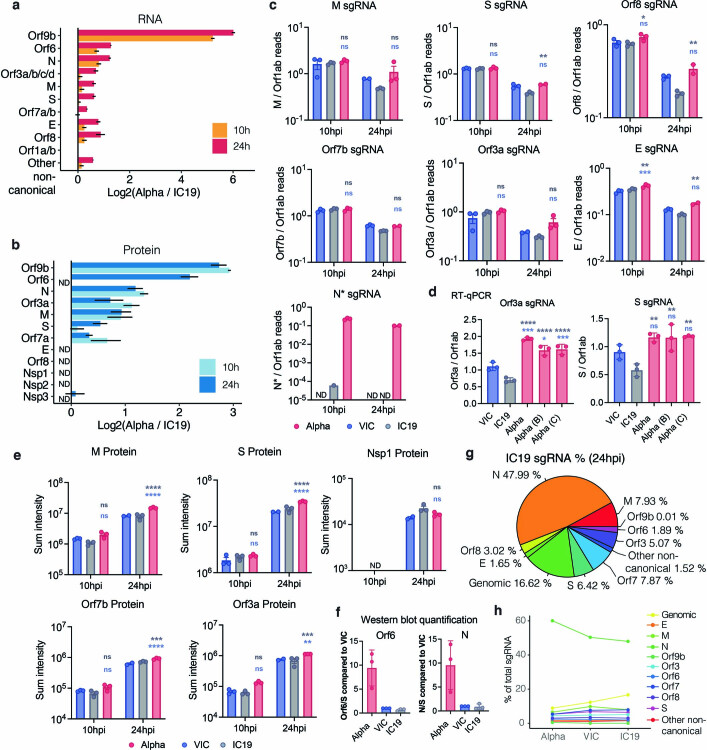
The emergence of SARS-CoV-2 variants of concern suggests viral adaptation to enhance human-to-human transmission1,2. Although much effort has focused on the characterization of changes in the spike protein in variants of concern, mutations outside of spike are likely to contribute to adaptation. Here, using unbiased abundance proteomics, phosphoproteomics, RNA sequencing and viral replication assays, we show that isolates of the Alpha (B.1.1.7) variant3 suppress innate immune responses in airway epithelial cells more effectively than first-wave isolates. We found that the Alpha variant has markedly increased subgenomic RNA and protein levels of the nucleocapsid protein (N), Orf9b and Orf6-all known innate immune antagonists. Expression of Orf9b alone suppressed the innate immune response through interaction with TOM70, a mitochondrial protein that is required for activation of the RNA-sensing adaptor MAVS. Moreover, the activity of Orf9b and its association with TOM70 was regulated by phosphorylation. We propose that more effective innate immune suppression, through enhanced expression of specific viral antagonist proteins, increases the likelihood of successful transmission of the Alpha variant, and may increase in vivo replication and duration of infection4. The importance of mutations outside the spike coding region in the adaptation of SARS-CoV-2 to humans is underscored by the observation that similar mutations exist in the N and Orf9b regulatory regions of the Delta and Omicron variants.


Conflict of interest statement

The N.J.K. laboratory has received research support from Vir Biotechnology and F. Hoffmann-La Roche. N.J.K. has consulting agreements with the Icahn School of Medicine at Mount Sinai, New York, Maze Therapeutics and Interline Therapeutics. He is a shareholder in Tenaya Therapeutics, Maze Therapeutics and Interline Therapeutics, has received stocks from Maze Therapeutics and Interline Therapeutics and is a financially compensated Scientific Advisory Board Member for GEn1E Lifesciences. The A.G.-S. laboratory has received research support from Pfizer, Senhwa Biosciences, Kenall Manufacturing, Avimex, Johnson & Johnson, Dynavax, 7Hills Pharma, Pharmamar, ImmunityBio, Accurius, Nanocomposix, Hexamer, N-fold, Model Medicines, Atea Pharma and Merck. A.G.-S. has consulting agreements for the following companies involving cash and/or stock: Vivaldi Biosciences, Contrafect, 7Hills Pharma, Avimex, Vaxalto, Pagoda, Accurius, Esperovax, Farmak, Applied Biological Laboratories, Pharmamar, Paratus and Pfizer. A.G.-S. is inventor on patents and patent applications on the use of antivirals and vaccines for the treatment and prevention of virus infections, owned by the Icahn School of Medicine at Mount Sinai, New York.

Figures

Fig. 1
Fig. 1. The SARS-CoV-2 Alpha variant antagonizes innate immune activation more efficiently than early-lineage isolates.
a, Protein-coding changes in SARS-CoV2 Alpha (red), early-lineage IC19 (grey) and early-lineage VIC (blue) are indicated in comparison to the Wuhan-Hu-1 reference genome (MN908947). be, Viral replication after infection of Calu-3 cells with 5,000 E copies per cell. LOD, limit of detection. b, Intracellular viral RNA. c, Nucleocapsid (N)+ cells. d, Infectious virions (TCID50, 50% tissue culture infectious dose). e, Negative-sense viral RNA. f, Total area of dsRNA area per cell measured by single-cell immunofluorescence in Calu-3 cells infected with 2,000 E copies per cell. g, Expression and secretion of IFNβ by cells in b. h, Replication (intracellular viral RNA; 24 h) and IFNβ expression (24 h) and secretion (48 ) after infection of Calu-3 cells with 250 E copies per cell. i, j, Measurements of infection in primary differentiated HAE cells infected with 2,000 E copies per cell (j, 72 h). k, Expression of IFNβ and ISGs in cells from j. Mean ± s.e.m. of one of three representative experiments performed in triplicate. For ik, n = 6, two independent donors. For f, one of two independent experiments with one data point per cell is shown. Two-way ANOVA (be) with Dunn’s multiple comparison test (f), one-way ANOVA with Tukey’s post-hoc test (gh, i) or Wilcoxon matched-pairs signed rank test (j, k). Blue asterisks, Alpha versus VIC (blue lines and symbols); grey stars, Alpha versus IC19 (grey lines and symbols). *P < 0.05, **P < 0.01, ***P < 0.001, ****P < 0.0001; NS, not significant.
Fig. 2
Fig. 2. Global RNA-seq and proteomics reveal innate immune suppression by Alpha.
a, Schematic of the experimental workflow. Calu-3 cells were infected with 5,000 E copies per cell of SARS-CoV-2 Alpha (red), early-lineage VIC (blue) or early-lineage IC19 (grey) or mock-infected (biological triplicates were performed for each time point). Phosphoproteomics and abundance proteomics analysis using a data-independent acquisition (DIA) and total RNA-seq were performed at 10 and 24 h. b, Unbiased pathway enrichment analysis. The −log10(P) values were averaged for enrichments using Alpha/VIC and Alpha/IC19 at 10 and 24 hpi to rank terms. The top five terms are shown. Innate immune system terms are shown in bold. ECM, extracellular matrix; AMI, acute myocardial infarction. c, Heat map depicting the log2-transformed fold change (log2FC; colour) of ISGs (by RNA-seq) comparing Alpha to VIC or IC19. Black outlines indicate P < 0.01. d, Box plots show log2FC of ISGs between Alpha/VIC, Alpha/IC19 or IC19/VIC. Dots indicate different ISGs. Boxes indicate median (middle line) and interquartile range (upper and lower lines). Blue indicates comparisons with Alpha; black indicates comparisons between early-lineage viruses (IC19 and VIC). e, RT–qPCR analysis of bolded ISGs from c in cells infected with 2,000 E copies per cell. Mean ± s.e.m. f, Number of phosphorylation sites significantly dysregulated for Alpha, VIC or IC19 versus mock at an absolute log2FC > 1 and adjusted P < 0.05. g, Kinase activities for the top enriched terms for the phosphoproteomics dataset ‘Reactome innate immune system’ (b, right). Two-tailed student’s t-test (d) or two-way ANOVA with Tukey’s multiple comparisons post-hoc test (e). Blue asterisks, Alpha versus VIC (blue bars); grey stars, Alpha versus IC19 (grey bars). *P < 0.05, **P < 0.01, ***P < 0.001, ****P < 0.0001, or exact P value (d); NS, not significant.
Fig. 3
Fig. 3. The SARS-CoV-2 Alpha variant upregulates innate immune antagonists at the subgenomic RNA and protein level.
a, Top, the log2 ratio of Alpha to VIC sgRNA normalized to total genomic RNA per time point and virus (from RNA-seq). Bottom, the log2 ratio of summed peptide intensities per viral protein comparing Alpha to VIC (from proteomics analysis) (n = 3). Orf3a–d refers to Orf3a, Orf3b, Orf3c and Orf3d. S, spike protein; E, envelope protein; M, membrane protein. ND, not detected. bd, Quantification of Orf9b (b), Orf6 (c) and N (d) sgRNA from the RNA-seq dataset (top) and summed peptides per viral protein (bottom). e, Quantification of Orf9b and N (left) or Orf6 (right) sgRNA abundance by RT–qPCR (24 hpi). f, Representative western blot of Orf6, N and S expression in infected Calu-3 cells (2,000 E copies per cell) at 24 hpi (n = 3). g, Pie chart depicting the proportion (shown as percentages) of total sgRNA mapping to each viral sgRNA for Alpha at 24 hpi. VIC percentages in parentheses. h, sgRNA log2-normalized counts (dot height) projected onto their identified start sites on the SARS-CoV-2 genome (24 hpi). Canonical and two non-canonical sgRNAs (Orf9b and N*) are depicted. i, Scatter plot of sgRNA abundance in Alpha or VIC at 24 hpi. Grey dots indicate other non-canonical sgRNAs containing a leader sequence but no clear start codon. Mean ± s.e.m. (ae). Two-way ANOVA with Tukey’s multiple comparisons post-hoc test (ce). *P < 0.05, **P < 0.01, ***P < 0.001, ****P < 0.0001; NS, not significant.
Fig. 4
Fig. 4. Orf9b binds TOM70 and antagonizes innate immune activation downstream of RNA sensing.
a, Transcription factor (TF) activities in the five top enriched terms for the RNA-seq dataset (Fig. 2b, left); rows clustered hierarchically based on activity magnitude. Black outlines show activities >1.5 or  < −1.5. b, IRF3 nuclear to cytoplasmic ratio measured by single-cell immunofluorescence at 24 h in cells infected at 2,000 E copies per cell; 1,000 randomly sampled cells per condition (cut-off of 0.1> = <5). c, Cryo-electron microscopy of SARS-CoV-2 Orf9b (yellow) in complex with TOM70 (blue) (Protein Data bank (PDB) code: 7KDT). Serine residues (Ser50 and Ser53) in Orf9b in the TOM70-binding site are shown in red. d, Co-immunoprecipitation of Orf9b wild type (WT) or point mutants with TOM70 in HEK293T cells. e, ISG56-reporter activation by poly I:C in the presence of Orf9b WT, S50E/S53E or empty vector (EV) in HEK293T cells. f, Schematic of proposed innate immune antagonism by Orf9b. (i) When S53 is unphosphorylated, Orf9b binds TOM70 to inhibit innate immune signalling. (ii) When S53 is phosphorylated, Orf9b can no longer interact or antagonize innate immune activation. g, Ratio between the intensity of Orf9b peptide phosphorylated on Ser53 (S53p) and total Orf9b (as calculated in Fig. 3b, bottom) from phospho- and abundance proteomics of Calu-3 cells (Fig. 2). h, ISG56-reporter activation by poly:IC in the presence of N (VIC), N (Alpha) or EV in HEK293T cells. Mean ± s.e.m. Mann–Whitney test (b) or two-way ANOVA with Tukey’s post-hoc test (e, h). For e, Orf9b WT versus Orf9b(S50E/S53E). For h, blue stars: VIC versus EV; red stars, Alpha versus EV. P < 0.05, **P < 0.01, ***P < 0.001, ****P < 0.0001.
Fig. 5
Fig. 5. Antagonism of innate immune activation by Alpha.
SARS-CoV-2 Alpha has evolved more effective innate immune antagonisms. First-wave isolates activate a delayed innate response in airway epithelial cells relative to rapid viral replication, indicative of viral innate immune antagonism early in infection. The known innate immune antagonists Orf9b, Orf6 and N act at different levels to inhibit RNA sensing. Orf6 inhibits IRF3 and STAT1 nuclear translocation,; N prevents activation of the RNA sensor RIG-I; and Orf9b inhibits RNA sensing through interaction with TOM70, regulated by phosphorylation. Alpha has evolved to produce more sgRNA for these key innate immune antagonists, which leads to increased protein levels and enhanced innate immune antagonism as compared to first-wave isolates. gRNA, genomic RNA.
Fig. 6
Fig. 6. VOCs present similar nucleotide mutations in N and Orf9b.
a, b, Genomic alignment of first-wave isolates and five VOCs showing sections of N and its 5′ region, codonized by CodAlignView in the reading frames of N (a) and Orf9b (b). The alignment includes TRS for N sgRNA present in all genomes; partial TRS for Orf9b sgRNA only in Alpha; TRS for N* sgRNA in Gamma and partial TRS in Alpha and Omicron. All mutations in Orf9b are colour-coded to indicate conservative (dark green) and radical (red) amino acid changes in Orf9b protein. We also highlighted a one-base deletion at 5′ of the N start codon in Alpha and Delta and an A to T substitution in Omicron, which change their adequate (A in −3, T in +4) Kozak initiation context to the weak (T in −3, T in +4) context, and could lead to more leaky scanning translation of Orf9b from the N sgRNA.
Extended Data Fig. 1
Extended Data Fig. 1. The SARS-CoV-2 Alpha variant replicates similarly to early-lineage isolates in Calu-3 cells.
a, E copies/ml (left), TCID50/ml (centre) and infectious units per genome (TCID50/E copies) (right) were measured in viral stocks. bd, Calu-3 cell infection with 5 E copies/cell. Viral replication (b), % infection (c), and infectious virion production (d) are shown. e, Quantification of E gene negative sense standard RNA in the presence and absence of 107 positive sense E RNA copies. Positive sense E primer set run with negative sense standards, observed at the limit of detection. f. Negative sense E copies in cells from (b). g, h, dsRNA detection by single cell immunofluorescence in cells infected with 2,000 E copies/cell. Representative images at 24 hpi (g) and quantification of dsRNA-positive cells (h) are shown. Shown are mean ± s.e.m. of one of three representative experiments performed in triplicate. For (g) representative images from two independent experiments, quantified in (h), are shown. Scale bars are 50 μm. Two Way ANOVA (b,c,d,f) or One Way ANOVA with a Tukey post-hoc test were used. Blue stars indicate comparison between Alpha and VIC (blue lines and symbols), grey stars indicate comparison between Alpha and IC19 (grey lines and symbols). * (p < 0.05), ** (p < 0.01), *** (p < 0.001), **** (p < 0.0001). ns: non-significant. E: viral envelope gene. LOD, limit of detection.
Extended Data Fig. 2
Extended Data Fig. 2. The SARS-CoV-2 Alpha variant antagonizes innate immune activation more efficiently than early-lineage isolates.
a, IFNβ gene expression (left) and protein secretion (right) from cells in Extended Data Fig 1b. b, HAE cells were infected with 2,000 E copies/cell of VIC. E copies were measured in apical washes of infected cultures. c, Calu-3 infection at 2,000 E copies/cell after 8h pre-treatment with IFNβ. Infection levels are shown normalized to untreated controls at 24 hpi. d, IFNβ and ISGs expression in HAE cells infected with 2,000 E copies/cell of IC19 or Alpha variant normalized to intracellular E copies for each sample. Shown are mean ± s.e.m. of one of three representative experiments performed in triplicate. For d, n = 6, two independent donors. Two Way ANOVA (a,c) or One Way ANOVA (d) with Wilcoxon matched-pairs signed rank test were used. Blue stars indicate comparison between Alpha and VIC (blue lines and symbols), grey stars indicate comparison between Alpha and IC19 (grey lines and symbols). * (p < 0.05), ** (p < 0.01), *** (p < 0.001), **** (p < 0.0001). ns: non-significant. E: viral envelope gene.
Extended Data Fig. 3
Extended Data Fig. 3. Omics data quality control and pathway enrichments.
a, Significantly changing genes for RNA, proteins for protein abundance, and phosphorylation sites for phosphoproteomics data. Significance was defined as abs(log2FC)>1 and adjusted p-value < 0.05. Red depicts positive log2 fold changes whereas blue depicts negative log2 fold changes. b, Principal components analysis (PCA) on normalized RNA transcripts per million (TPM), protein intensities, or phosphorylation site intensities. Non-finite values were removed and detections (transcripts, proteins, or phosphorylation sites) not shared (non-finite) between all conditions were discarded prior to analysis. Coloured numbers indicate biological replicates. c, Pairwise Pearson’s correlation between RNA, protein, or phosphorylation site abundance among replicates within the same condition (red) or between distinct conditions (black). d, Number of genes expressed above baseline in RNA-seq dataset per replicate. e, Number of peptides and proteins detected per replicate in the abundance proteomics dataset. f, Number of phosphorylated peptides and corresponding proteins from the phosphoproteomics dataset. g, Fraction of peptides from protein abundance (left) or phosphoproteomics (right; phosphorylated peptides) that overlap between two replicates. h, Correlation between Log2 fold-change (log2FC) phosphorylation sites and log2FC abundance of the corresponding protein. Dots are coloured according to the comparison between conditions.
Extended Data Fig. 4
Extended Data Fig. 4. Omics data highlight the recruitment of innate immune signalling.
a, Gene set enrichment analysis based on log2FC method using RNA dataset (as in Fig. 2b). Ranking is based on the average of the absolute value z-scores across the indicated contrasts involving Alpha (per row). Black borders indicate an adjusted p-value < 0.05. b, Same as in a, but for abundance proteomics dataset. c, Same as in a, but for phosphoproteomics dataset. If a protein possessed multiple phosphorylation sites, the maximum absolute value log2FC was used as the representative value for the protein. Finite values (non-infinite) were prioritized over quantitative values. d, Expression of interferon-stimulated genes from Lui et al (2018) (see Methods) using the RNA-seq dataset. Significant fold changes with an adjusted p-value < 0.05 are indicated with black borders. e, Same as in (a) using the abundance proteomics dataset. N.D. indicates proteins either not detected in one condition (thus, Inf or -Inf) or not detected in both conditions. f, RNA expression per biological replicate of interferon-stimulated genes (ISGs) for each virus versus mock.
Extended Data Fig. 5
Extended Data Fig. 5. Infection with the SARS-CoV-2 Alpha variant results in lower IFN III and pro-inflammatory responses than first wave isolates.
a, Calu-3 cells were infected with 250 E copies/cell and IFNL1 and IFNL3 expression measured at 24 hpi. b, Secretion of CXCL10, IL6 and CCL5 by infected cells at 48 hpi. c, d, Calu-3 cells were infected with (c) 5,000 E copies/cell or (d) 5 E copies/cell. Expression of TNF, CCL2, IL6, IL8 and CCL3 were measured. Data shown are mean ± s.e.m. of one of three representative experiments performed in triplicate. One Way ANOVA with a Tukey post-comparison test (a, b) or two Way ANOVA (c,d) were used. Blue stars indicate comparison between Alpha and VIC (blue lines and symbols), grey stars indicate comparison between Alpha and IC19 (grey lines and symbols). * (p < 0.05), ** (p < 0.01), *** (p < 0.001), **** (p < 0.0001). ns: non-significant. E: viral envelope gene.
Extended Data Fig. 6
Extended Data Fig. 6. Kinase and transcription factor activity analysis.
a, Full kinase activity analysis of indicated contrasts with z-score>2. Kinases were separated using k-means clustering, which naturally reveals groups depicting kinases downregulated for the entire time course (“Down”), downregulated early and upregulated late (“Down-Up”), upregulated early and downregulated late (“Up-Down”), or upregulated or constant throughout the time course (“Up”). Panel on the right depicts the average Z-score for each distinct cluster per time point, collapsing across Alpha/VIC and Alpha/IC19 comparisons. b, Correlation between the calculated kinase activity Z-score and protein (left) or RNA (right) abundance log2FC for kinases with estimated activities in our dataset. Vertical dashed lines indicate kinase activity of ±2, horizontal dashed lines indicate protein log2FC of ±1. Colours represent comparisons between viruses and time points as indicated. c, Detected substrates known to be phosphorylated by TBK1. Log2FC of each phosphorylation site is depicted. Those not detected are indicated in grey. d, Transcription factor (TF) activities were estimated from the RNA-seq dataset using known TF-target gene interactions. Included are TFs with a NES>2.5. TF are clustered using ward hierarchical clustering based on similar activity patterns across time.
Extended Data Fig. 7
Extended Data Fig. 7. Expression of viral RNA and protein for SARS-CoV-2 variants.
a, Log2 ratio of Alpha to IC19 subgenomic RNA (sgRNA) abundance as determined from the RNA-seq dataset. b, Log2 ratio of Alpha to IC19 viral proteins. Peptide intensities are summed per viral protein (n = 3). c, Quantification of sgRNAs for M, S, Orf8, Orf7a, Orf3a, E and N* from the RNA-seq dataset. Counts are normalized to genomic RNA abundance at each time point and virus. d, Quantification of Orf3a (left) or S (right) sgRNA abundance via RT–qPCR. e, Summed peptides per viral protein for M, S, Nsp1, Orf7b, and Orf3b. f, Western blot quantification of Orf6 and N protein in infected cells at 24 hpi (n = 3). g, Pie chart depicting proportion of total sgRNA mapping to each viral sgRNA for IC19. h, Mean ± s.e.m. are shown. Comparison of percentages of total sgRNA mapping to each viral sgRNA across Alpha, VIC, and IC19. * (p < 0.05), ** (p < 0.01), *** (p < 0.001), **** (p < 0.0001). ns: non-significant, ND, not detected.
Extended Data Fig. 8
Extended Data Fig. 8. Examples of leader-containing reads for Orf9b and N from the RNA-seq dataset.
ac, Representative sequence for Orf9b (top) and N (bottom) sgRNA from Alpha (a), VIC (b) and IC19 (c). Leader sequences to identify sgRNAs are highlighted in yellow. The following sequence is used to differentiate Orf9b versus N sgRNAs. Orf9b and N start codons shown in maroon. The site of the N-protein D3L mutation is indicated in green, resulting in increased similarity to the transcriptional regulatory sequence (TRS) for Alpha. Read counts of Orf9b and N are indicated to the right. Counts are normalized to mean genomic reads per replicate.
Extended Data Fig. 9
Extended Data Fig. 9. Western blot densitometry quantification for Orf9b immunoprecipitation with TOM70.
Densitometry quantification of two western blot experimental repeats of Orf9b immunoprecipitation with TOM70 (as in Fig. 4d).

Update of

Comment in

References

    1. Volz E, et al. Assessing transmissibility of SARS-CoV-2 lineage B.1.1.7 in England. Nature. 2021;593:266–269. - PubMed
    1. Davies NG, et al. Estimated transmissibility and impact of SARS-CoV-2 lineage B.1.1.7 in England. Science. 2021;372:eabg3055. - PMC - PubMed
    1. Galloway SE, et al. Emergence of SARS-CoV-2 B.1.1.7 lineage—United States, December 29, 2020–January 12, 2021. MMWR Morb. Mortal. Wkly Rep. 2021;70:95–99. - PMC - PubMed
    1. Calistri P, et al. Infection sustained by lineage B.1.1.7 of SARS-CoV-2 is characterised by longer persistence and higher viral RNA loads in nasopharyngeal swabs. Int. J. Infect. Dis. 2021;105:753–755. - PMC - PubMed
    1. Foster TL, et al. Resistance of transmitted founder HIV-1 to IFITM-mediated restriction. Cell Host Microbe. 2016;20:429–442. - PMC - PubMed

Publication types

MeSH terms

Substances

Supplementary concepts