. 2022 Feb 1;34(3):495-516.
doi: 10.1162/jocn_a_01807.

Distributed and Multifaceted Effects of Threat and Safety

Affiliations

Distributed and Multifaceted Effects of Threat and Safety

Dinavahi V P S Murty et al. J Cogn Neurosci. .

Abstract

In the present fMRI study, we examined how anxious apprehension is processed in the human brain. A central goal of the study was to test the prediction that a subset of brain regions would exhibit sustained response profiles during threat periods, including the anterior insula, a region implicated in anxiety disorders. A second important goal was to evaluate the responses in the amygdala and the bed nucleus of the stria terminals, regions that have been suggested to be involved in more transient and sustained threat, respectively. A total of 109 participants performed an experiment in which they encountered "threat" or "safe" trials lasting approximately 16 sec. During the former, they experienced zero to three highly unpleasant electrical stimulations, whereas in the latter, they experienced zero to three benign electrical stimulations (not perceived as unpleasant). The timing of the stimulation during trials was randomized, and as some trials contained no stimulation, stimulation delivery was uncertain. We contrasted responses during threat and safe trials that did not contain electrical stimulation, but only the potential that unpleasant (threat) or benign (safe) stimulation could occur. We employed Bayesian multilevel analysis to contrast responses to threat and safe trials in 85 brain regions implicated in threat processing. Our results revealed that the effect of anxious apprehension is distributed across the brain and that the temporal evolution of the responses is quite varied, including more transient and more sustained profiles, as well as signal increases and decreases with threat.


Figures

<b>Figure 1.</b>
Figure 1.
Paradigm description. (A) During threat trials (pink), participants could receive zero to three highly unpleasant electrical stimulations over a period of 16.25 sec, whereas during safe trials (blue), participants could receive zero to three benign electrical stimulations (not perceived as aversive). Actual stimulations are indicated by vertical line segments during trials. Our analyses focused on trials that did not contain electrical stimulation. At the end of each trial, participants rated their anxiety levels on a scale of 1–3, followed by a 7.50-sec fixation cross before the next block. (B) SCRs for threat and safe trials. Error bands show 95% interval for standard error across participants. (C) Anxiety rating during threat and safe trials.
<b>Figure 2.</b>
Figure 2.
Regions of interest. ACC = anterior cingulate cortex; BL/BM = amygdala; BST = bed nucleus of the stria terminalis; IFG = inferior frontal gyrus; MCC = mid- cingulate cortex; OFC = orbitofrontal cortex, PAG = periaqueductal gray; PCC = posterior cingulate cortex; PFC = prefrontal cortex; pre-SMA = pre-supplementary motor area.
<b>Figure 3.</b>
Figure 3.
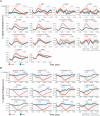
Hemodynamic responses to trials containing electrical stimulation. Estimated responses averaged across participants. Error bands show 95% interval for standard error across participants to illustrate variability only. Shaded regions represent early and late periods. L = left; R = right; CM = centromedial; BL/BM = basolateral/basomedial.
<b>Figure 4.</b>
Figure 4.
Posterior distributions. Left: Posteriors show the distribution of the trial type effect, namely, difference between threat and safe for the early (dark) and late (light) periods. Right: Posteriors show the distribution of the trial period effect, namely, difference between early and late for the trial type effect (difference between threat and safe). p+ is the probability that the effect is greater than zero.
<b>Figure 5.</b>
Figure 5.
Effects of trial type and trial period. (A) Effect of trial type. Warmer colors indicate threat > safe, and cooler colors indicate the reverse. (B) Effect of trial period. Warmer colors indicate early > late trial type effect, and cooler colors indicate the reverse. Brain slices correspond to those in Figure 2.
<b>Figure 6.</b>
Figure 6.
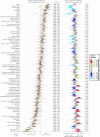
Estimated responses across key regions. Error bands show 95% interval for standard error across participants to illustrate variability only. Shaded regions indicate early and late periods. Numerical values indicate p+ (colored font highlights the strongest effects).
<b>Figure 7.</b>
Figure 7.
Estimated responses in the insula (ROI level). Error bands show 95% interval for standard error across participants to illustrate variability only. Shaded regions indicate early and late periods. The strength of the effect of trial type is indicated separately for the early and late periods (see p+ values; colored font highlights the strongest effects). The effect of trial period is indicated via color coding of the ROIs (see color scale).
<b>Figure 8.</b>
Figure 8.
Estimated responses in the amygdala (ROI level). Error bands show 95% interval for standard error across participants to illustrate variability only. Shaded regions indicate early and late periods. The strength of the effect of trial type is indicated separately for the early and late periods (see p+ values; colored font highlights the strongest effects). The effect of trial period is indicated via color coding of the ROIs (see color scale).
<b>Figure 9.</b>
Figure 9.
Estimated responses in the thalamus (ROI level). Error bands show 95% interval for standard error across participants to illustrate variability only. Shaded regions indicate early and late periods. The strength of the effect of trial type is indicated separately for the early and late periods (see p+ values; colored font highlights the strongest effects). The effect of trial period is indicated via color coding of the ROIs (see color scale).
<b>Figure 10.</b>
Figure 10.
Estimated responses in the striatum (ROI level). Error bands show 95% interval for standard error across participants to illustrate variability only. Shaded regions indicate early and late periods. The strength of the effect of trial type is indicated separately for the early and late periods (see p+ values; colored font highlights the strongest effects). The effect of trial period is indicated via color coding of the ROIs (see color scale).
<b>Figure 11.</b>
Figure 11.
Estimated responses in the hippocampus (ROI level). Error bands show 95% interval for standard error across participants to illustrate variability only. Shaded regions indicate early and late periods. The strength of the effect of trial type is indicated separately for the early and late periods (see p+ values; colored font highlights the strongest effects). The effect of trial period is indicated via color coding of the ROIs (see color scale).
<b>Figure 12.</b>
Figure 12.
Estimated responses in the cerebellum (ROI level). Error bands show 95% interval for standard error across participants to illustrate variability only. Shaded regions indicate early and late periods. The strength of the effect of trial type is indicated separately for the early and late periods (see p+ values; colored font highlights the strongest effects). The effect of trial period is indicated via color coding of the ROIs (see color scale).
<b>Figure 13.</b>
Figure 13.
Estimated responses in the insula (voxel level). Error bands show 95% interval for standard error across participants to illustrate variability only. Shaded regions indicate early and late periods. The strength of the effect of trial type is indicated via color coding at the voxel level (see color scale).
<b>Figure 14.</b>
Figure 14.
Estimated responses in the amygdala (voxel level). Error bands show 95% interval for standard error across participants to illustrate variability only. Shaded regions indicate early and late periods. The strength of the effect of trial type is indicated via color coding at the voxel level (see color scale).

References

    1. Alvarez, R. P., Chen, G., Bodurka, J., Kaplan, R., & Grillon, C. (2011). Phasic and sustained fear in humans elicits distinct patterns of brain activity. Neuroimage, 55, 389–400. 10.1016/j.neuroimage.2010.11.057, - DOI - PMC - PubMed
    1. Amunts, K., Mohlberg, H., Bludau, S., & Zilles, K. (2020). Julich-Brain: A 3D probabilistic atlas of the human brain's cytoarchitecture. Science, 369, 988–992. 10.1126/science.abb4588, - DOI - PubMed
    1. Avants, B., Tustison, N., & Song, G. (2009). Advanced normalization tools: V1.0. Insight Journal, 618
    1. Boeke, E. A., Moscarello, J. M., LeDoux, J. E., Phelps, E. A., & Hartley, C. A. (2017). Active avoidance: Neural mechanisms and attenuation of Pavlovian conditioned responding. Journal of Neuroscience, 37, 4808–4818. 10.1523/JNEUROSCI.3261-16.2017, - DOI - PMC - PubMed
    1. Bürkner, P.-C. (2017). brms: An R package for Bayesian multilevel models using Stan. Journal of Statistical Software, 80. 10.18637/jss.v080.i01 - DOI

Publication types