. 2021 Dec 3;10(12):1938.
doi: 10.3390/antiox10121938.

Heme-Oxygenase-1 Attenuates Oxidative Functions of Antigen Presenting Cells and Promotes Regulatory T Cell Differentiation during Fasciola hepatica Infection

Affiliations

Heme-Oxygenase-1 Attenuates Oxidative Functions of Antigen Presenting Cells and Promotes Regulatory T Cell Differentiation during Fasciola hepatica Infection

Monique Costa et al. Antioxidants (Basel). .

Abstract

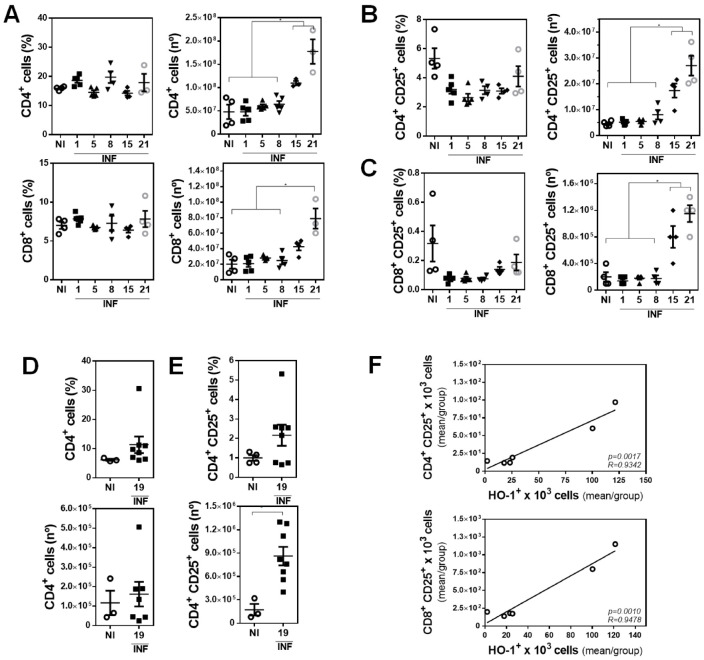
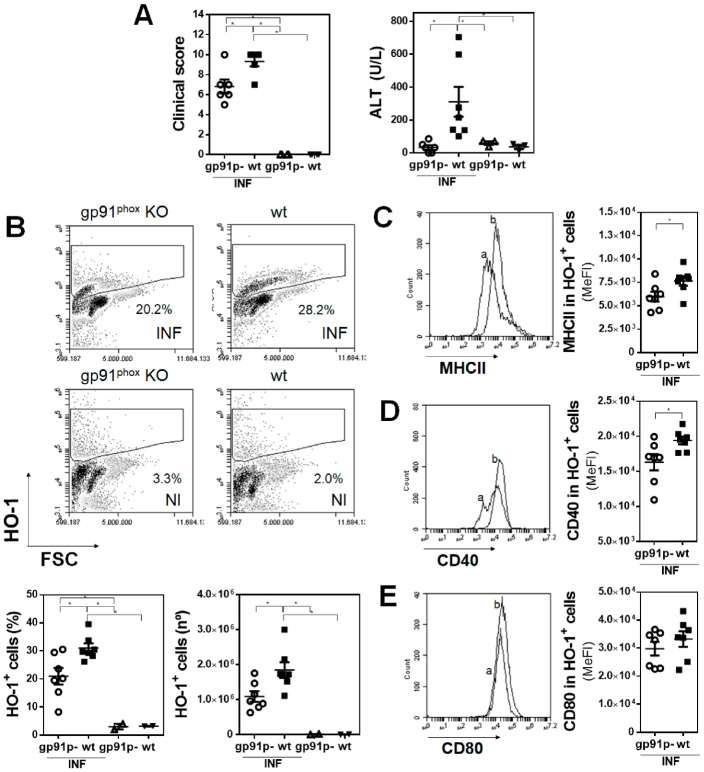
Fasciola hepatica is a fluke that infects livestock and humans causing fasciolosis, a zoonotic disease of increasing importance due to its worldwide distribution and high economic losses. The parasite regulates the host immune system by inducing a strong Th2 and regulatory T (Treg) cell immune response through mechanisms that might involve the expression or activity of heme-oxygenase-1 (HO-1), the rate-limiting enzyme in the catabolism of free heme that also has immunoregulatory and antioxidant properties. In this paper, we show that F. hepatica-infected mice upregulate HO-1 on peritoneal antigen-presenting cells (APC), which produce decreased levels of both reactive oxygen and nitrogen species (ROS/RNS). The presence of these cells was associated with increased levels of regulatory T cells (Tregs). Blocking the IL-10 receptor (IL-10R) during parasite infection demonstrated that the presence of splenic Tregs and peritoneal APC expressing HO-1 were both dependent on IL-10 activity. Furthermore, IL-10R neutralization as well as pharmacological treatment with the HO-1 inhibitor SnPP protected mice from parasite infection and allowed peritoneal APC to produce significantly higher ROS/RNS levels than those detected in cells from infected control mice. Finally, parasite infection carried out in gp91phox knockout mice with inactive NADPH oxidase was associated with decreased levels of peritoneal HO-1+ cells and splenic Tregs, and partially protected mice from the hepatic damage induced by the parasite, revealing the complexity of the molecular mechanisms involving ROS production that participate in the complex pathology induced by this helminth. Altogether, these results contribute to the elucidation of the immunoregulatory and antioxidant role of HO-1 induced by F. hepatica in the host, providing alternative checkpoints that might control fasciolosis.

Keywords: ROS/RNS; antigen presenting cell; helminth; heme-oxigenase-1; immunoregulation; regulatory T cell.


Conflict of interest statement

The authors declare no conflict of interest.

Figures

Figure 1
Figure 1
HO-1 expression in F4/80+ peritoneal cells inversely correlates with ROS/RNS production. Mice (n = 4–6) were infected with 10 metacercariae and sacrificed at 1, 8, 15, and 21 dpi. Non-infected mice were used as control (NI). (A) Clinical signs including hemorrhage, splenomegaly, and macroscopic liver damage were assessed to evaluate the severity of the disease [17]. ALT activity in sera was used as a marker of liver damage. (B) Analysis by flow cytometry of HO-1+ cells in PEC from infected and control (NI) mice. (C) Frequency and cell number of HO-1+ cells in the peritoneal cavity of infected and control (NI) animals by flow cytometry. (D) Analysis by flow cytometry of F4/80+ HO-1+ cells in PEC from infected and control (NI) mice. (E) Frequency and cell number of F4/80+ in the peritoneal cavity of infected and control (NI) animals by flow cytometry. (F) HO-1 expression in F4/80+ in the peritoneal cavity of infected and control (NI) mice. Letters on histograms correspond as follows: a: NI, b: 1 dpi, c: 15 dpi, d: 21 dpi. Median fluorescence intensity is shown (MeFI) in the plot. (G) ROS/RNS quantification in F4/80+ in the peritoneal cavity of infected and control (NI) mice using the DCFDA probe by flow cytometry. Letters on histograms correspond as follows: a: NI, b: 1 dpi, c: 15 dpi, d: 21 dpi. Median fluorescence intensity is shown (MeFI) in the plot. (H) Murine RAW264.7 macrophages were cultured in the presence of 75 µg/mL of FhTE or CoPP (100 µM/mL) and SnPP (50 µM/mL) overnight at 37 °C. Then, cells were collected and incubated for 30 min at 37 °C in PBS with the DCFDA probe and analyzed by flow cytometry. The RNS/ROS levels are shown as the ratio between FhTE/medium (FhTE), CoPP + FhTE/CoPP (CoPP/FhTE), and SnPP + FhTE/SnPP (SnPP/FhTE). Representative experiments are shown. Asterisks indicate significant differences with p < 0.05, performed by one-way ANOVA followed by Tukey’s test with multiple comparisons.
Figure 2
Figure 2
Peritoneal HO-1+ cells correlate with increased splenic CD4+ CD25+ and CD8+ CD25+ cells during F. hepatica infection. Mice (n = 4–8/group) were infected with 10 metacercariae and sacrificed at 1, 8, 15, and 21 dpi. Non-infected mice were used as control (NI). (A) Frequency and cell number of splenic CD4+ or CD8+ cells from infected and control (NI) mice. (B,C) Frequency and cell number of splenic CD4+ CD25+ (B) or CD8+ CD25+ (C) cells from infected and control (NI) mice. (D) Frequency and cell number of hepatic CD3+ CD4+ cells from infected and control (NI) mice. (E) Frequency and cell number of hepatic CD4+ CD25+ cells from infected and control (NI) mice (right). (F) Splenic CD4+ CD25+ or CD8+ CD25+ cell number in function of the number of peritoneal HO-1+ cells in NI and infected mice. The mean of CD4+ CD25+ (in Figure 2B), CD8 CD25+ (in Figure 2C), and HO-1+ cells (in Figure 1C) was plotted. Gate analyses by flow cytometry are shown in Supplementary Figures S2 and S3. The results shown represent one experiment. Asterisks indicate significant differences with p < 0.05, performed by one-way ANOVA followed by Tukey’s test with multiple comparisons.
Figure 3
Figure 3
The HO-1 pharmacological inhibitor SnPP decreases the production of ROS/RNS by peritoneal F4/80+ cells and correlates with an increase of splenic FoxP3+CD25+/CD4+ T cells induced by F. hepatica infection. Mice were injected with SnPP (40 mg/kg) or vehicle (PBS) one day before infection and every 4 days until the end of the experimental protocol. Mice (n = 5/group) were infected with 10 metacercariae (day 0) and sacrificed at 20 dpi. Non-infected (NI) mice (n = 3/group) both treated and untreated with SnPP were used as control. (A) Clinical signs of infected mice were analyzed to assess disease severity [17]. (B) Frequency and cell number of HO-1+ cells in the peritoneal cavity of SnPP-treated or untreated infected and control (NI) animals by flow cytometry. (C) Frequency and cell number of F4/80+ cells in the peritoneal cavity of SnPP-treated or untreated infected and control (NI) animals by flow cytometry. (D) ROS/RNS quantification in F4/80+ cells of the peritoneal cavity of SnPP-treated or untreated infected and control (NI) mice using the DCFDA probe by flow cytometry. HO-1 (E) and ICOSL (F) expression in F4/80+ cells in the peritoneal cavity of SnPP-treated or untreated infected and control (NI) mice. (G) Splenic CD4+ T cell frequency and number from SnPP-treated or untreated infected and control (NI) mice. (H) Splenic CD4+/CD25+FoxpP3+ cell frequency and number from SnPP-treated or untreated infected and control (NI) mice (left). CTLA4 expression in splenic CD4+/CD25+FoxpP3+ cells from SnPP-treated or untreated infected and control (NI) mice. Gate analyses by flow cytometry are shown in Supplementary Figures S2 and S4. Results obtained for one representative experiment are shown. Asterisks indicate significant differences with p < 0.05, performed by one-way ANOVA followed by Tukey’s test with multiple comparisons.
Figure 4
Figure 4
Analyses of peritoneal F4/80+ cells at the early events of F. hepatica infection. Mice (n = 5/group) were injected with SnPP (40 mg/kg) or vehicle (PBS) one day before infection, infected with 10 metacercariae (day 0), and sacrificed at 1 dpi. Non-infected (NI) mice (n = 3/group) both treated and untreated with SnPP were used as a control. (A) Analysis of F4/80int and F4/80hi cells in PEC from SnPP-treated or untreated infected and control (NI) mice by flow cytometry. (B) Frequency and cell number of F4/80int (upper plots) or F4/80hi (lower plots) cells in the peritoneal cavity of SnPP-treated or untreated infected and control (NI) animals. HO-1 (C), ROS/RNS (D), CCR2 (E), and IL-33R (F) expression in peritoneal F4/80int and F4/80hi cells by flow cytometry. “nd” means none detected, since barely any F4/80hi cells in SnPP-treated infected mice were detected. Median fluorescence intensity is shown (MeFI) in the plot. Gate analyses by flow cytometry are shown in (A) and Supplementary Figure S1. Representative experiments are shown. Asterisks indicate significant differences with p < 0.05, performed by one-way ANOVA followed by Tukey’s test with multiple comparisons.
Figure 5
Figure 5
mRNA levels of antioxidative and oxidative genes in the infection by F. hepatica. Mice (n = 5/group) were injected with SnPP (40 mg/kg) or PBS 1 day before infection, infected with 10 metacercariae (day 0), and sacrificed at 20 dpi. nrf2 (A), catalase, gpx1, gpx2, sod1, sod2 (B), and p47phox and gp91phox (C) gene expression in PECs from SnPP-treated and control infected mice evaluated by qRT-PCR. mRNA levels were analyzed by qRT-PCR with respect to gapdh expression in PECs from SnPP-treated and control infected mice (PBS). Results were compared to the infected (control) group of mice and represented as the ratio between gene expression in SnPP-treated and control mice. Asterisks indicate significant differences with p < 0.05, performed by the Student’s t-test.
Figure 6
Figure 6
Gp91phox (gp91p-) knockout (n = 6–8/group) and littermate control (n = 2/group) mice were infected with 10 metacercariae and sacrificed at 20 dpi. Non-infected mice were used as a control. (A) Clinical signs analyzed to assess disease severity [17]. Quantification of liver damage by ALT activity in sera. (B) Flow cytometry analysis of HO-1+ in PECs from gp91phox knockout mice and littermate controls (upper panel). (C) Frequency and cell number of HO-1+ cells in the peritoneal cavity of infected and non-infected animals by flow cytometry (lower panel). MHCII (C), CD40 (D), and CD80 (E) expression in HO-1+ cells in the peritoneal cavity of infected and control mice. Letters on histograms correspond as follows: a: infected gp91phox, b: infected wildtype littermates. Median fluorescence intensity is shown (MeFI) in the plot. Asterisks indicate significant differences with p < 0.05, performed by one-way ANOVA followed by Tukey’s test with multiple comparisons.
Figure 7
Figure 7
Peritoneal F4/80+ cells from wildtype infected mice present a regulatory-like phenotype. Gp91phox (gp91p-) knockout (n = 7–8/group) and littermate control (n = 2–4/group) mice were infected with 10 metacercariae and sacrificed at 20 dpi. Non-infected mice were used as a control. (A) Flow cytometry analysis of F4/80+ cells in PEC from gp91phox knockout mice and littermate controls (upper panel). Frequency and cell number of F4/80+ cells in the peritoneal cavity of infected and non-infected animals by flow cytometry (lower plots). ROS/RNS (B), Sirpα (C), ICOSL (D), and IL-10 (E) expression in F4/80+ cells in the peritoneal cavity of infected and uninfected mice. Letters on histograms correspond as follows: a: infected gp91phox, b: infected littermates, c: uninfected gp91phox, and d: uninfected littermates. Median fluorescence intensity is shown (MeFI) in the plot. (F) Frequency and cell number of splenic CD4+ cells from infected and non-infected mice. (G) Frequency and cell number of splenic CD4+/CD25+ Foxp3+ cells from infected and non-infected mice. Gate analyses by flow cytometry are shown in (A) and Supplementary Figure S1. (H) IFNγ levels in culture supernatants of splenocyte proliferation assay cultured with FhTE for 5 days at 37 °C. The results shown represent one experiment. Asterisks indicate significant differences with p < 0.05, performed by one-way ANOVA followed by Tukey’s test with multiple comparisons.
Figure 8
Figure 8
IL-10 signaling is essential for HO-1 expression in F. hepatica-infected mice. Fifteen µg of monoclonal rat IgG2a anti-IL-10R antibody was administrated by intraperitoneal injection the day before and after infection with F. hepatica and every 3 days until sacrifice (n = 5–8/group). The control group (n = 4/group) received an isotype control antibody. At day 20 post-infection, animals were sacrificed and splenocytes were analyzed by flow cytometry. (A) Clinical signs were analyzed to assess disease severity [17]. (B) Analysis by flow cytometry of F4/80+ cells in PEC from infected and non-infected (NI) mice showing frequency and number of F4/80+ cells in PECs. (C) HO-1 expression in F4/80+ cells in the peritoneal cavity of infected and uninfected mice. (D) Frequency and cell number of CD4+ T cells in spleens from infected and non-infected (NI) mice. (E) Frequency and cell number of CD4+ CD25+ T cells in spleens from infected and non-infected (NI) mice. Gate analyses by flow cytometry are shown in (B) and Supplementary Figure S7. Representative results of one representative are shown. Asterisks indicate significant differences with p < 0.05, performed by one-way ANOVA followed by Tukey’s test with multiple comparisons.
Figure 9
Figure 9
General hypothesis. (A) ICOSL+ F4/80+ APC express HO-1 induced by parasite infection that promotes IL-10 production and differentiation or expansion of CTLA4+ Tregs. (B) SnPP treatment inhibiting HO-1 activity in IL-33R+ F4/80+ APC allows ROS/RNS production, that induce parasite damage in early stages of the infection.

References

    1. Mas-Coma S., Valero M.A., Bargues M.D. Fascioliasis. Adv. Exp. Med. Biol. 2019;1154:71–103. - PubMed
    1. Cwiklinski K., O’Neill S.M., Donnelly S., Dalton J.P. A prospective view of animal and human Fasciolosis. Parasite Immunol. 2016;38:558–568. doi: 10.1111/pim.12343. - DOI - PMC - PubMed
    1. Moazeni M., Ahmadi A. Controversial aspects of the life cycle of Fasciola hepatica. Exp. Parasitol. 2016;169:81–89. doi: 10.1016/j.exppara.2016.07.010. - DOI - PubMed
    1. Rodríguez E., Carasi P., Frigerio S., Da Costa V., van Vliet S., Noya V., Brossard N., Van Kooyk Y., García-Vallejo J.J., Freire T. Fasciola hepatica Immune Regulates CD11c+ Cells by Interacting with the Macrophage Gal/GalNAc Lectin. Front. Immunol. 2017;8:264. doi: 10.3389/fimmu.2017.00264. - DOI - PMC - PubMed
    1. Dowling D.J., Hamilton C.M., Donnelly S., La Course J., Brophy P.M., Dalton J., O’Neill S.M. Major Secretory Antigens of the Helminth Fasciola hepatica Activate a Suppressive Dendritic Cell Phenotype That Attenuates Th17 Cells but Fails to Activate Th2 Immune Responses. Infect. Immun. 2010;78:793–801. doi: 10.1128/IAI.00573-09. - DOI - PMC - PubMed

LinkOut - more resources