. 2021 Dec 6;10(12):1954.
doi: 10.3390/antiox10121954.

Mito-TIPTP Increases Mitochondrial Function by Repressing the Rubicon-p22phox Interaction in Colitis-Induced Mice

Affiliations

Mito-TIPTP Increases Mitochondrial Function by Repressing the Rubicon-p22phox Interaction in Colitis-Induced Mice

Jae-Sung Kim et al. Antioxidants (Basel). .

Erratum in

Abstract

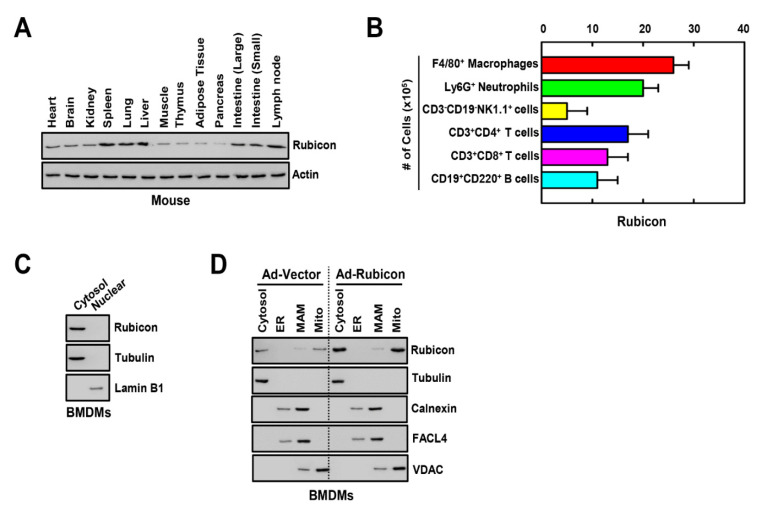
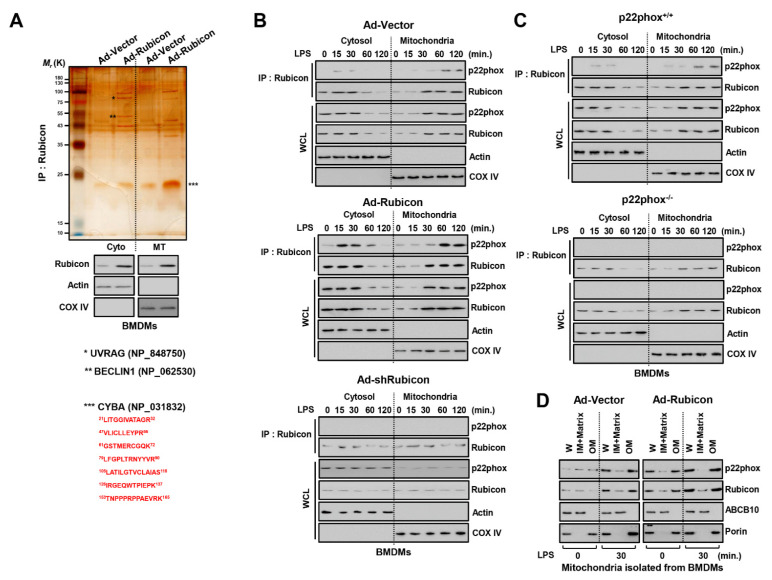
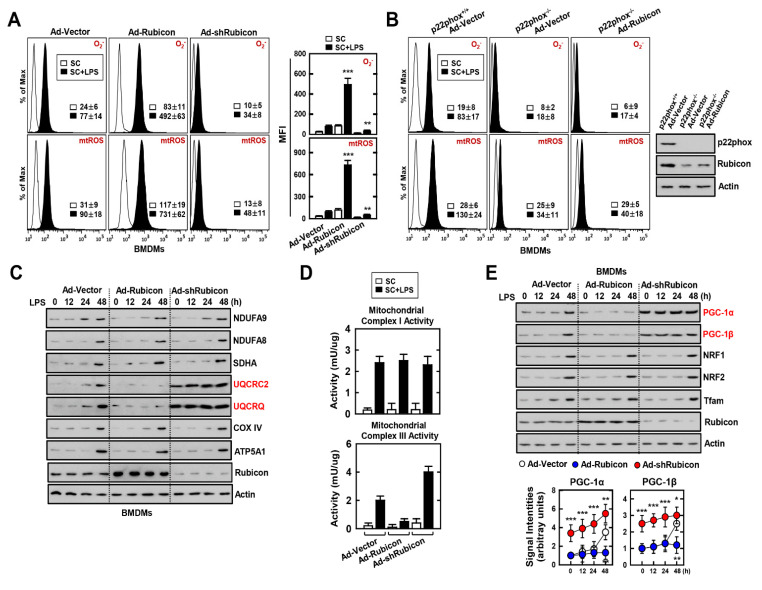
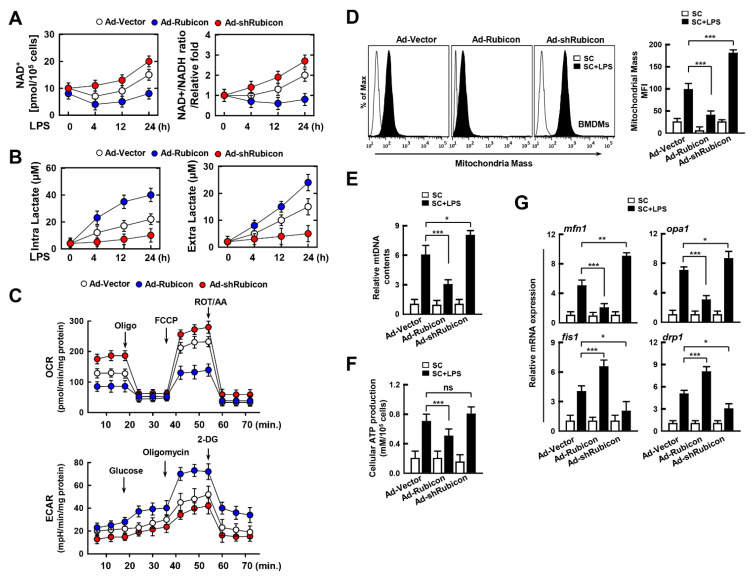
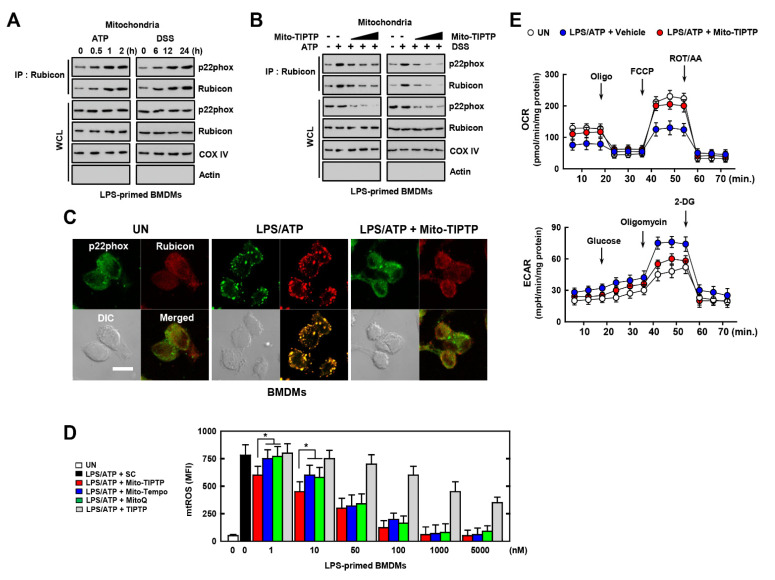
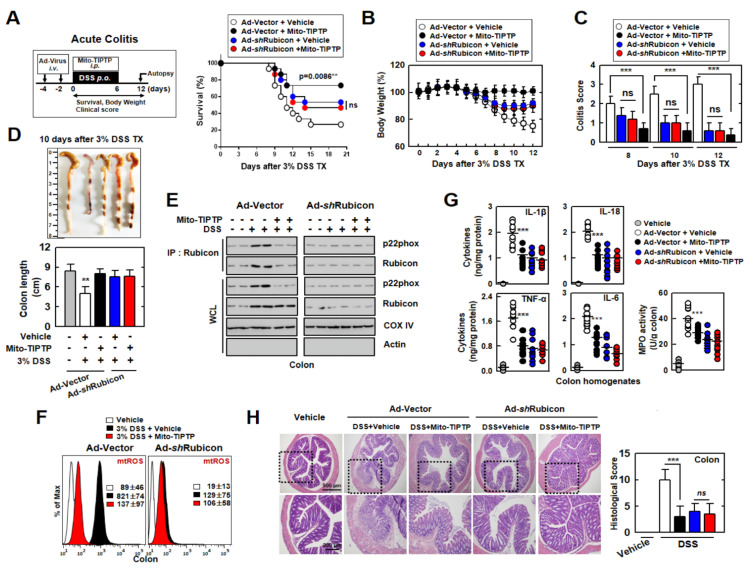
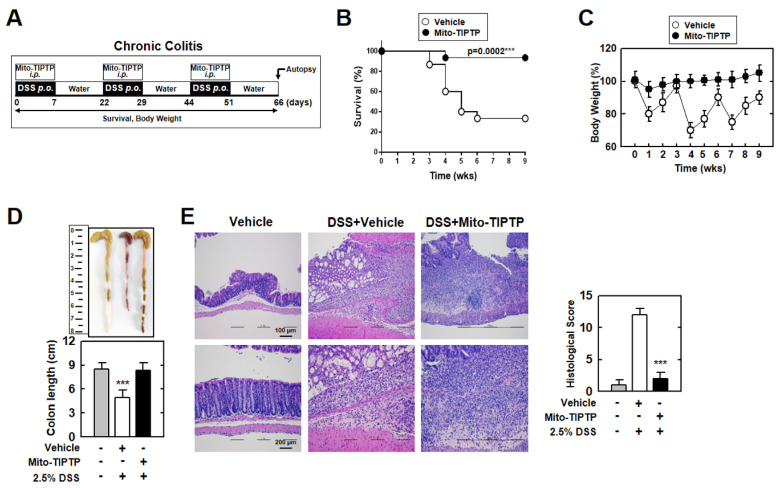
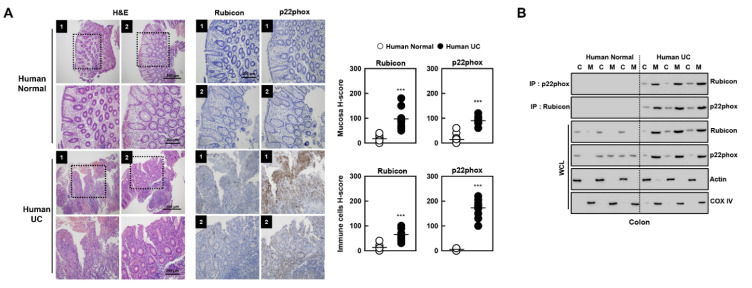
The run/cysteine-rich-domain-containing Beclin1-interacting autophagy protein (Rubicon) is essential for the regulation of nicotinamide adenine dinucleotide phosphate (NADPH) oxidase by interacting with p22phox to trigger the production of reactive oxygen species (ROS) in immune cells. In a previous study, we demonstrated that the interaction of Rubicon with p22phox increases cellular ROS levels. The correlation between Rubicon and mitochondrial ROS (mtROS) is poorly understood. Here, we report that Rubicon interacts with p22phox in the outer mitochondrial membrane in macrophages and patients with human ulcerative colitis. Upon lipopolysaccharide (LPS) activation, the binding of Rubicon to p22phox was elevated, and increased not only cellular ROS levels but also mtROS, with an impairment of mitochondrial complex III and mitochondrial biogenesis in macrophages. Furthermore, increased Rubicon decreases mitochondrial metabolic flux in macrophages. Mito-TIPTP, which is a p22phox inhibitor containing a mitochondrial translocation signal, enhances mitochondrial function by inhibiting the association between Rubicon and p22phox in LPS-primed bone-marrow-derived macrophages (BMDMs) treated with adenosine triphosphate (ATP) or dextran sulfate sodium (DSS). Remarkably, Mito-TIPTP exhibited a therapeutic effect by decreasing mtROS in DSS-induced acute or chronic colitis mouse models. Thus, our findings suggest that Mito-TIPTP is a potential therapeutic agent for colitis by inhibiting the interaction between Rubicon and p22phox to recover mitochondrial function.

Keywords: Rubicon; colitis; mitochondria; p22phox; reactive oxygen species.


Conflict of interest statement

The authors declare that they have no conflict of interest.

Figures

Figure 1
Figure 1
Tissue and subcellular distribution of Rubicon. (A) Each tissue was separated from mouse and homogenized. Rubicon expression was assessed by immunoblotting (IB) in various tissues from C57BL/6 normal mice. Whole-cell lysates (WCL) were used for the IB with αActin. (B) Cell frequencies were determined with the 10-color flow cytometry panel and centralized manual gating on cryopreserved splenocytes samples. Differences in the frequency of major splenocytes subsets. (C) BMDMs were nuclear and cytoplasmic fractions separated and analyzed for Rubicon by IB. αTubulin was detected as cytoplasmic protein loading controls. αLamin B1 was detected as nuclear loading controls. (D) BMDMs from WT mice were transduced with Ad-Rubicon or Ad-Vector (MOI = 10) for 2 days. BMDMs were subcellularly fractionated and subjected to IB with αRubicon. Levels of tubulin (cytosolic), calnexin (endoplasmic reticulum (ER) and mitochondria-associated membrane (MAM)), fatty acid CoA ligase 4 (FACL4, MAM) and voltage-dependent anion channels (VDAC, mitochondrial) protein in each fraction were determined by IB. Data shown are representative of three independent experiments with similar results (A,C,D). Data shown are the means ± SD of five experiments (B).
Figure 2
Figure 2
Rubicon−mediated p22phox translocated to mitochondria. (A) Identification of p22phox as endogenous binding partners of Rubicon in mitochondria. BMDMs were transduced with Ad−Rubicon or Ad-Vector (MOI = 10) for 2 days, followed by nuclear and cytoplasmic fractions separated and subjected to IP with αRubicon. Binding partners were confirmed by silver staining and mass spectrometric analysis (up). BMDMs were subcellularly fractionated and subjected to IB with αRubicon. αTubulin was detected as cytoplasmic protein loading controls. αLamin B1 was detected as nuclear loading controls (middle). The red-colored letters indicate the p22phox (CYBA) peptides identified from mass spectrometry analysis (down). (B,C) BMDMs were transduced with Ad-Rubicon, Ad−shRubicon, or Ad−Vector (MOI = 10) for 2 days (B) or BMDMs from p22phox+/+ and p22phox−/− (C) and stimulated with LPS (100 ng/mL) for indicated times, followed by IP with αRubicon and IB with αp22phox. WCLs were used for IB with αRubicon, αp22phox, αCOX IV, and αActin. (D) Mitochondria isolated from BMDMs were subjected to digitonin extraction to separate the outer-membrane fraction (OM) and the fraction containing the inner membrane and matrix (IM + Matrix). These fractions and whole mitochondria (W) were subjected to IB using αRubicon. Mitochondrial VDAC/porin (an outer membrane protein) and ABCB10 (an inner-membrane protein). Data shown are representative of three independent experiments with similar results.
Figure 3
Figure 3
Effects of Rubicon–p22phox interaction in the mitochondrial activity and biogenesis. (A,B) BMDMs were transduced with Ad-Rubicon, Ad-shRubicon, or Ad-Vector (MOI = 10) for 2 days and stimulated with LPS (100 ng/mL) for 30 min. FACS analysis for superoxide (up) and mitoROS (down). Quantitative analysis of mean fluorescence intensities of ROS (box). p22phox and Rubicon expression by IB (B, right). (C) BMDMs was stimulated with LPS (100 ng/mL) for indicated times and subjected to IB with αNDUFA9, αNDUFA8, αSDHA, αUQCRC2, αUQCRQ, αCOX IV, αATP5A1, αRubicon, and αActin. (D) Mitochondrial Complex I (up) and III (down) Activity. (E) BMDMs was stimulated with LPS (100 ng/mL) for the indicated times and subjected to IB with αPGC-1α, αPGC-1β, αNRF1, αNRF2, αTfam, αRubicon, and αActin (up) and signal intensity of PGC-1α and PGC-1β were measured in indicated times (down). Data shown are the means ± SD of three experiments (A,B,D). Data shown are representative of five independent experiments with similar results (C,E). Statistical significance was determined by Student’s t-test with Bonferroni adjustment (* p < 0.05; ** p < 0.01; *** p < 0.001) compared with Ad-Vector.
Figure 4
Figure 4
Effects of Rubicon in mitochondrial metabolism. BMDMs were transduced with Ad-Rubicon, Ad-shRubicon, or Ad-Vector (MOI = 10) for 2 days and stimulated with LPS (100 ng/mL) for indicated times. (A) NAD+/NADH ratio. (B) Lactate production. (C) The real-time measurement of OCR was analyzed by sequential treatment with oligomycin, FCCP, and rotenone/Actinomycin A, as an indicator of oxidative metabolism (left) or ECAR were analyzed by sequential treatment with glucose, oligomycin, and 2-DG, as an indicator of glucose oxidation. (D) Mitotracker fluorescence signals were assessed by a flow cytometric analysis. (Left) Representative histograms from seven independent replicates. (Right) Bar graph indicates the mitochondrial mass mean fluorescence intensities (MFIs). (E) Mitochondrial DNA (mtDNA) content in BMDMs measured by quantitative real-time PCR. The mtDNA content was normalized to nuclear DNA. (F) Cellular ATP production. (G) Quantitative real-time PCR of fusion or fission genes. Statistical significance was determined by Student’s t-test with Bonferroni adjustment (* p < 0.05; ** p < 0.01; *** p < 0.001) compared with Ad-Vector. Data shown are representative of seven independent experiments with similar results. Results are expressed as means ± SD of seven experiments.
Figure 5
Figure 5
Effects of Mito−TIPTP in mitochondrial functions. BMDMs were mitochondria fractionated by Mitochondria Isolation Kit. (A) LPS (100 ng/mL)-primed mitochondria fractionated−BMDMs were activated with ATP (1 mM) for 30 min or DSS (3%) for 18 h, and subjected to IP with αRubicon. IB with αp22phox and αRubicon. WCLs were used for IB with αRubicon, αp22phox, αCOX IV, and αActin. (B) The experimental conditions follow the same pattern as outlined in (A). LPS−primed BMDMs were treated with Mito−TIPTP (1, 10, and 100 nM) for 1 h, and then activated with ATP for 30 min or DSS for 18 h. (C) Immunostaining of BMDMs treated with LPS/ATP in presence or absence of Mito−TIPTP (10 nM) and then immunolabeled with antibody to p22phox (Alexa Fluor 488) or Rubicon (Alexa Fluor 568). Scale bar, 10 μm. (D) FACS analysis for mitoROS of BMDMs treated with LPS/ATP in the presence or absence of Mito−TIPTP, Mito−Tempo, or MitoQ in indicated concentrations. Quantitative analysis of mean fluorescence intensities of ROS (box). (E) The real−time measurement of OCR, as an indicator of oxidative metabolism (left) or ECAR, as an indicator of glucose oxidation. Data shown are representative of seven independent experiments with similar results (AE). Statistical significance was determined by Student’s t−test with Bonferroni adjustment (* p < 0.05) compared with solvent control (0.1% DMSO).
Figure 6
Figure 6
Mito−TIPTP has a therapeutic effect against acute DSS−induced colitis in mice. (A) Schematic of the acute colitis model transduced with Ad−vector or Ad−shRubicon virus and treated 3% DSS with Mito−TIPTP (50 ng/kg) (left). The survival of mice was monitored for 21 days; mortality was measured for n = 15 mice per group (right). (B) Weight loss (n = 8). (C) Colitis scores were obtained from clinical parameters (weight loss, stool consistency, and bleeding) (n = 8). (D) Image (up) and length (down) of colon in 3% DSS−treated mice with vehicle or Mito−TIPTP (n = 8). (E) Colon was used for IP with αRubicon, followed by IB with αp22phox and αRubicon. WCLs were used for IB with αp22hox, αRubicon, αActin, and αCOX IV. (F) FACS analysis for mtROS from colon (n = 8). (G) levels of cytokines and MPO activity in colon homogenates (n = 10). (H) Representative imaging of H&E staining of the colon (left) (n = 10). Histopathology scores were obtained from H&E staining, as described in methods (Materials and Methods) were determined in 3% DSS−treated mice with vehicle or Mito−TIPTP. Scale bar, 500 μm. Statistical significance was determined by Student’s t−test with Bonferroni adjustment (** p < 0.01; *** p < 0.001) compared with vehicle.
Figure 7
Figure 7
Mito−TIPTP alleviates chronic DSS−induced colitis in mice. (A) Schematic of the chronic colitis model treated 2.5% DSS with Mito−TIPTP (50 ng/kg). (B) The survival of mice was monitored for 9 weeks; mortality was measured for n = 15 mice per group. (C) Weight loss of vehicle or Mito−TIPTP in mice (n = 15). (D) Image (up) and length (down) of colon in 2.5% DSS−induced chronic colitis mice with vehicle or Mito−TIPTP. (E) Representative imaging of H&E staining of the colon (left) (n = 8). Histopathology scores were obtained from H&E staining were determined in 2.5% DSS−induced chronic colitis mice with vehicle or Mito−TIPTP. Scale bar, 100 μm. Statistical significance was determined by Student’s t−test with Bonferroni adjustment (*** p < 0.001) compared with vehicle.
Figure 8
Figure 8
H&E staining and immunohistochemistry in colon in human normal and ulcerative colitis (UC) patients. (A) Human normal and UC patients were used for H&E staining and IHC with αp22phox and αRubicon (left). H-score Rubicon and p22phox in mucosa and immune cells in colon were calculated by multiplying the percentage of the stained area by the staining intensity (right). Representative images from five independent healthy controls and patients are shown. Insets, enlargement of outlined areas. Biological replicates (n = 10) for each condition were performed. (B) Colon of human normal and UC patients were cytoplasmic and mitochondria fractions separated and analyzed for Rubicon, subjected to IP with αRubicon and αRubicon. IB with αp22phox and αRubicon. WCLs were used for IB with αRubicon, αp22phox, αCOX IV, and αActin. Data from three of ten normal human and UC patients are shown. Statistical significance was determined by Student’s t-test with Bonferroni adjustment (*** p < 0.001) compared with human normal.

References

    1. Balmus I.M., Ciobica A., Trifan A., Stanciu C. The implications of oxidative stress and antioxidant therapies in Inflammatory Bowel Disease: Clinical aspects and animal models. Saudi. J. Gastroenterol. 2016;22:3–17. doi: 10.4103/1319-3767.173753. - DOI - PMC - PubMed
    1. Brieger K., Schiavone S., Miller F.J., Jr., Krause K.H. Reactive oxygen species: From health to disease. Swiss Med Wkly. 2012;142:w13659. doi: 10.4414/smw.2012.13659. - DOI - PubMed
    1. Simpson D.S.A., Oliver P.L. ROS Generation in Microglia: Understanding Oxidative Stress and Inflammation in Neurodegenerative Disease. Antioxidants. 2020;9:743. doi: 10.3390/antiox9080743. - DOI - PMC - PubMed
    1. Schneider A.M., Özsoy M., Zimmermann F.A., Feichtinger R.G., Mayr J.A., Kofler B., Sperl W., Weghuber D., Mörwald K. Age-Related Deterioration of Mitochondrial Function in the Intestine. Oxid. Med. Cell Longev. 2020;2020:4898217. doi: 10.1155/2020/4898217. - DOI - PMC - PubMed
    1. Rath E., Moschetta A., Haller D. Mitochondrial function—Gatekeeper of intestinal epithelial cell homeostasis. Nat. Rev. Gastroenterol. Hepatol. 2018;15:497–516. doi: 10.1038/s41575-018-0021-x. - DOI - PubMed

LinkOut - more resources