

Standard Non-Personalized Electric Field Modeling of Twenty Typical tDCS Electrode Configurations via the Computational Finite Element Method: Contributions and Limitations of Two Different Approaches
- PMID: 34943145
- PMCID: PMC8698402
- DOI: 10.3390/biology10121230
Standard Non-Personalized Electric Field Modeling of Twenty Typical tDCS Electrode Configurations via the Computational Finite Element Method: Contributions and Limitations of Two Different Approaches
Abstract
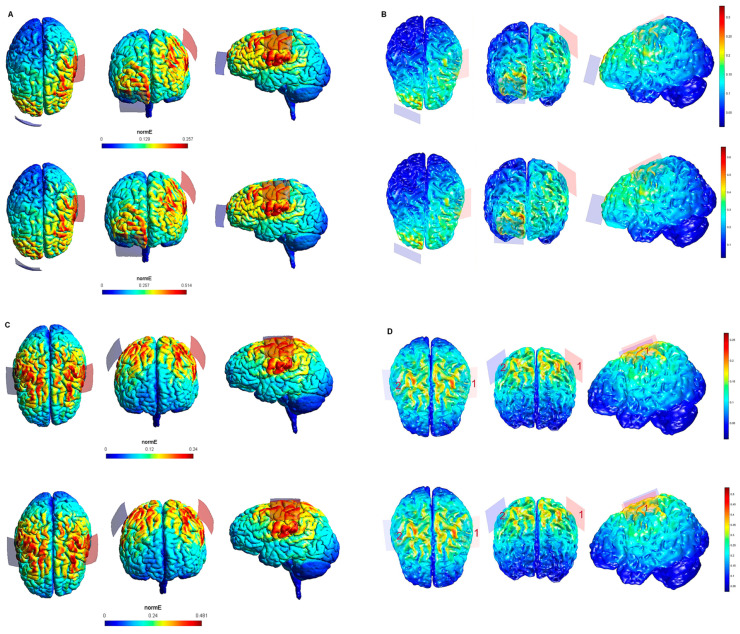
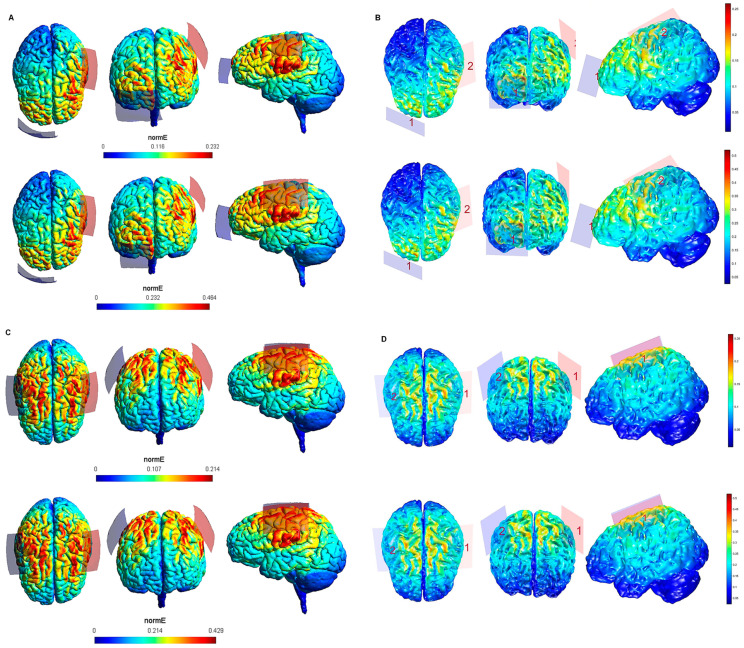
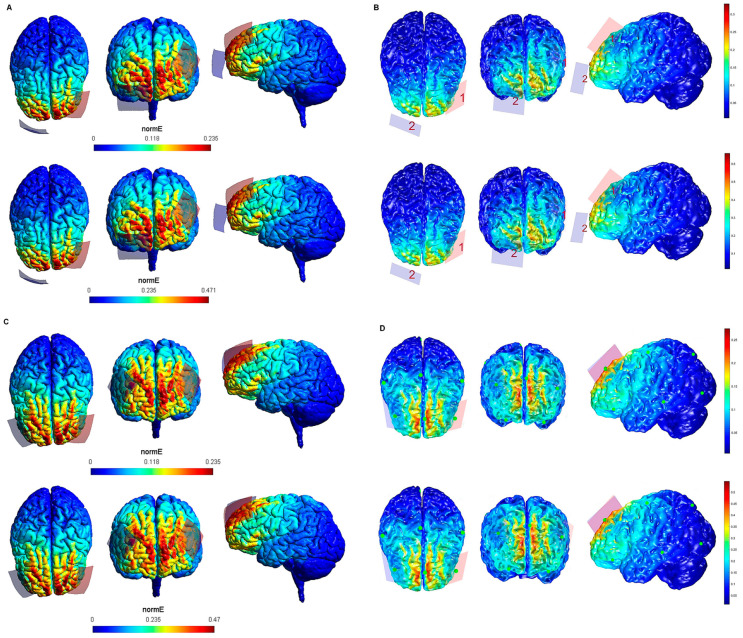
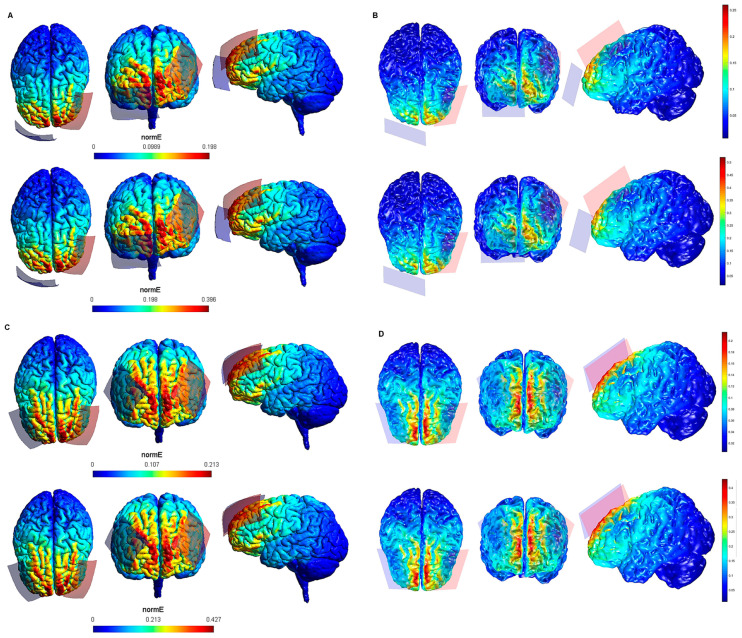
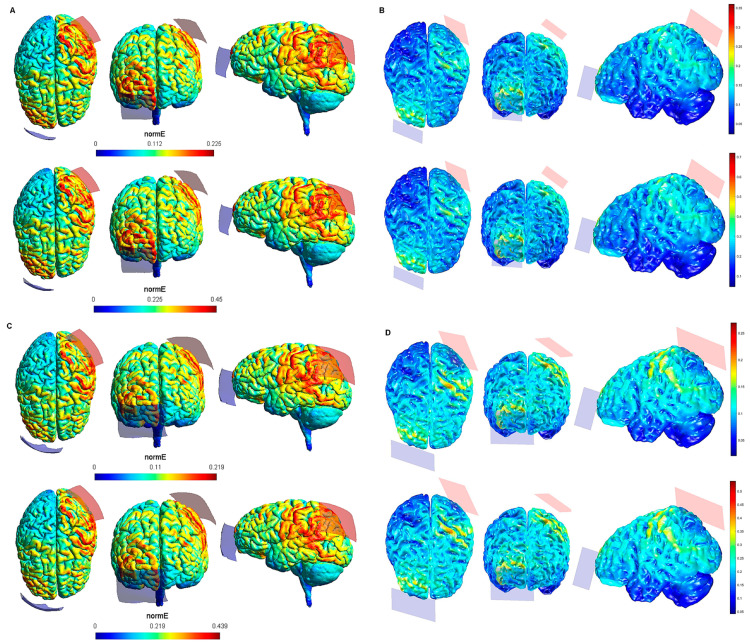
Transcranial direct current stimulation (tDCS) is a non-invasive brain stimulation procedure to modulate cortical excitability and related brain functions. tDCS can effectively alter multiple brain functions in healthy humans and is suggested as a therapeutic tool in several neurological and psychiatric diseases. However, variability of results is an important limitation of this method. This variability may be due to multiple factors, including age, head and brain anatomy (including skull, skin, CSF and meninges), cognitive reserve and baseline performance level, specific task demands, as well as comorbidities in clinical settings. Different electrode montages are a further source of variability between tDCS studies. A procedure to estimate the electric field generated by specific tDCS electrode configurations, which can be helpful to adapt stimulation protocols, is the computational finite element method. This approach is useful to provide a priori modeling of the current spread and electric field intensity that will be generated according to the implemented electrode montage. Here, we present standard, non-personalized model-based electric field simulations for motor, dorsolateral prefrontal, and posterior parietal cortex stimulation according to twenty typical tDCS electrode configurations using two different current flow modeling software packages. The resulting simulated maximum intensity of the electric field, focality, and current spread were similar, but not identical, between models. The advantages and limitations of both mathematical simulations of the electric field are presented and discussed systematically, including aspects that, at present, prevent more widespread application of respective simulation approaches in the field of non-invasive brain stimulation.
Keywords: current flow; current intensity; electric field; finite element method; tDCS.
Conflict of interest statement
Michael A. Nitsche receives support from the German Ministry of Research and Education (GCBS grant 01EE1403C), and EU (NEUROTWIN, grant No 101017716), and is a member of the scientific advisory boards of Neuroelectrics, and NeuroDevice. The other authors declare no conflict of interest.
Figures
Similar articles
-
Transcranial direct current stimulation in patients after decompressive craniectomy: a finite element model to investigate factors affecting the cortical electric field.J Int Med Res. 2021 Feb;49(2):300060520942112. doi: 10.1177/0300060520942112. J Int Med Res. 2021. PMID: 33788619 Free PMC article.
-
Transcranial direct current stimulation in patients with depression: An electric field modeling meta-analysis.J Affect Disord. 2025 Apr 1;374:540-552. doi: 10.1016/j.jad.2025.01.001. Epub 2025 Jan 6. J Affect Disord. 2025. PMID: 39778744
-
Cost of focality in TDCS: Interindividual variability in electric fields.Brain Stimul. 2020 Jan-Feb;13(1):117-124. doi: 10.1016/j.brs.2019.09.017. Epub 2019 Oct 2. Brain Stimul. 2020. PMID: 31606449
-
Transcranial direct current stimulation in obsessive-compulsive disorder: an update in electric field modeling and investigations for optimal electrode montage.Expert Rev Neurother. 2019 Oct;19(10):1025-1035. doi: 10.1080/14737175.2019.1637257. Epub 2019 Jul 8. Expert Rev Neurother. 2019. PMID: 31244347 Review.
-
Modulation of mind wandering using transcranial direct current stimulation: A meta-analysis based on electric field modeling.Neuroimage. 2023 May 15;272:120051. doi: 10.1016/j.neuroimage.2023.120051. Epub 2023 Mar 23. Neuroimage. 2023. PMID: 36965860 Review.
Cited by
-
Optimized APPS-tDCS electrode position, size, and distance doubles the on-target stimulation magnitude in 3000 electric field models.Sci Rep. 2022 Nov 22;12(1):20116. doi: 10.1038/s41598-022-24618-3. Sci Rep. 2022. PMID: 36418438 Free PMC article.
-
A map of evidence using transcranial direct current stimulation (tDCS) to improve cognition in adults with traumatic brain injury (TBI).Front Neuroergon. 2023 May 12;4:1170473. doi: 10.3389/fnrgo.2023.1170473. eCollection 2023. Front Neuroergon. 2023. PMID: 38234478 Free PMC article. Review.
References
-
- Giordano J., Bikson M., Kappenman E.S., Clark V.P., Coslett H.B., Hamblin M.R., Hamilton R., Jankord R., Kozumbo W.J., McKinley R.A., et al. Mechanisms and effects of transcranial direct current stimulation. Dose-Response. 2017;15:1559325816685467. doi: 10.1177/1559325816685467. - DOI - PMC - PubMed
LinkOut - more resources
Full Text Sources
