. 2021 Dec 16;11(12):2376.
doi: 10.3390/diagnostics11122376.

Performance of Spectral Photon-Counting Coronary CT Angiography and Comparison with Energy-Integrating-Detector CT: Objective Assessment with Model Observer

Affiliations

Performance of Spectral Photon-Counting Coronary CT Angiography and Comparison with Energy-Integrating-Detector CT: Objective Assessment with Model Observer

David C Rotzinger et al. Diagnostics (Basel). .

Abstract

Aims: To evaluate spectral photon-counting CT's (SPCCT) objective image quality characteristics in vitro, compared with standard-of-care energy-integrating-detector (EID) CT.

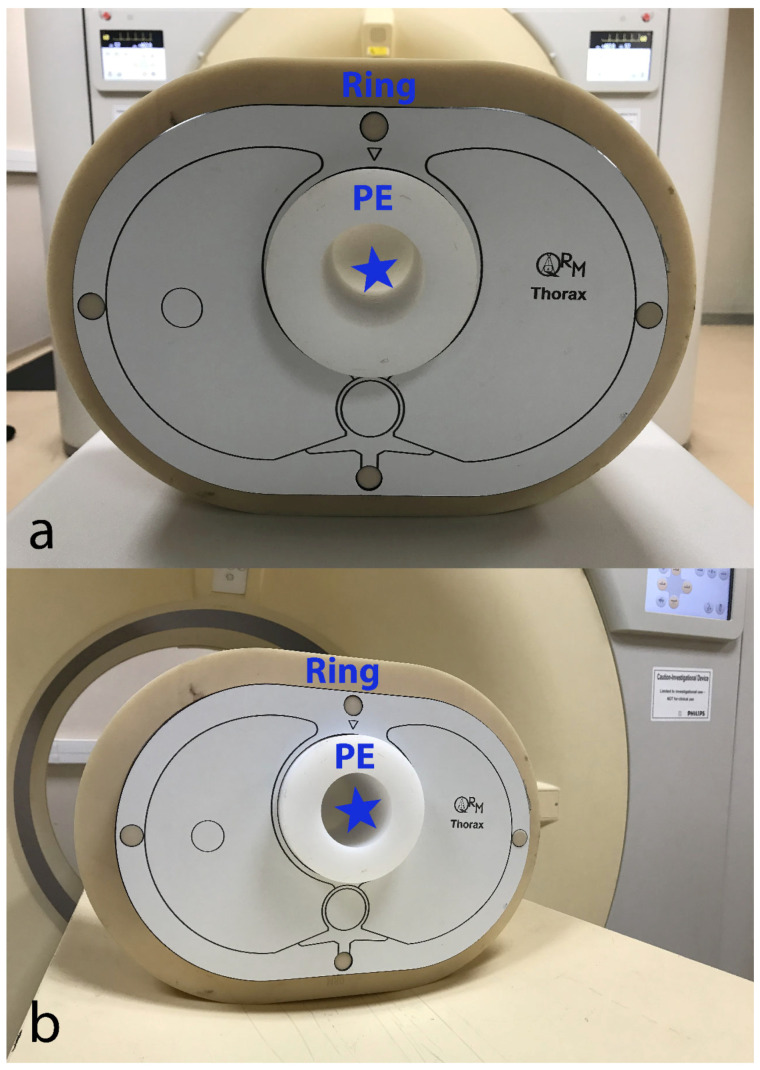
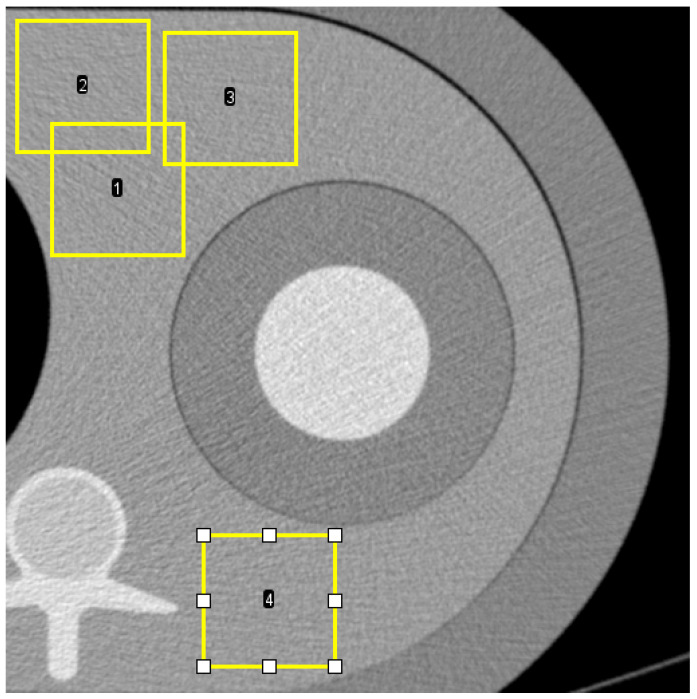
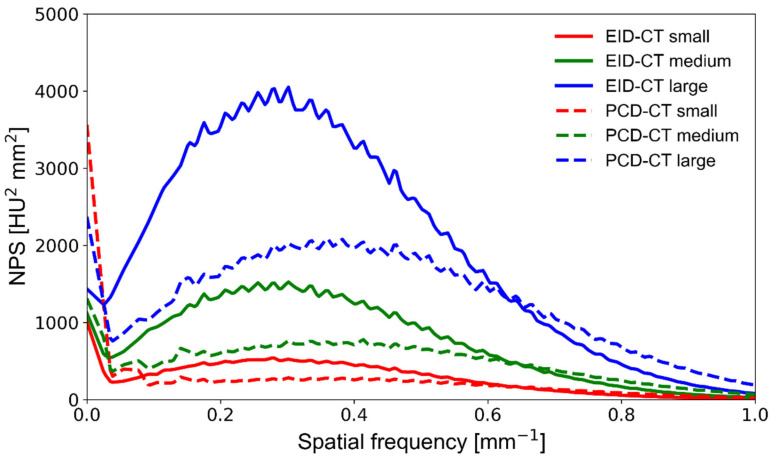
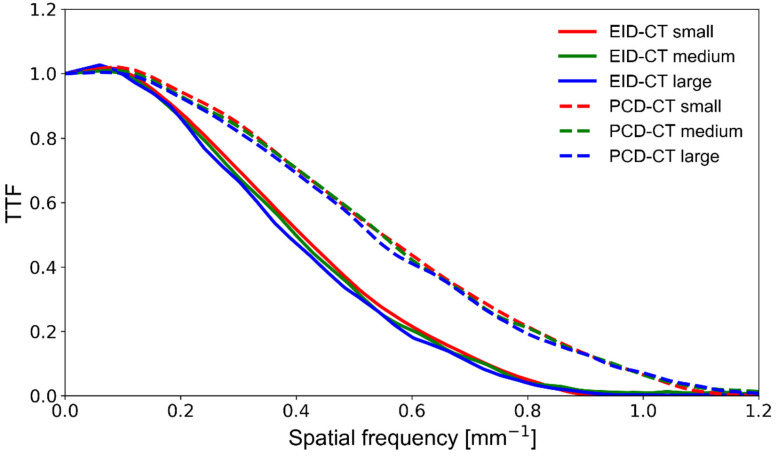
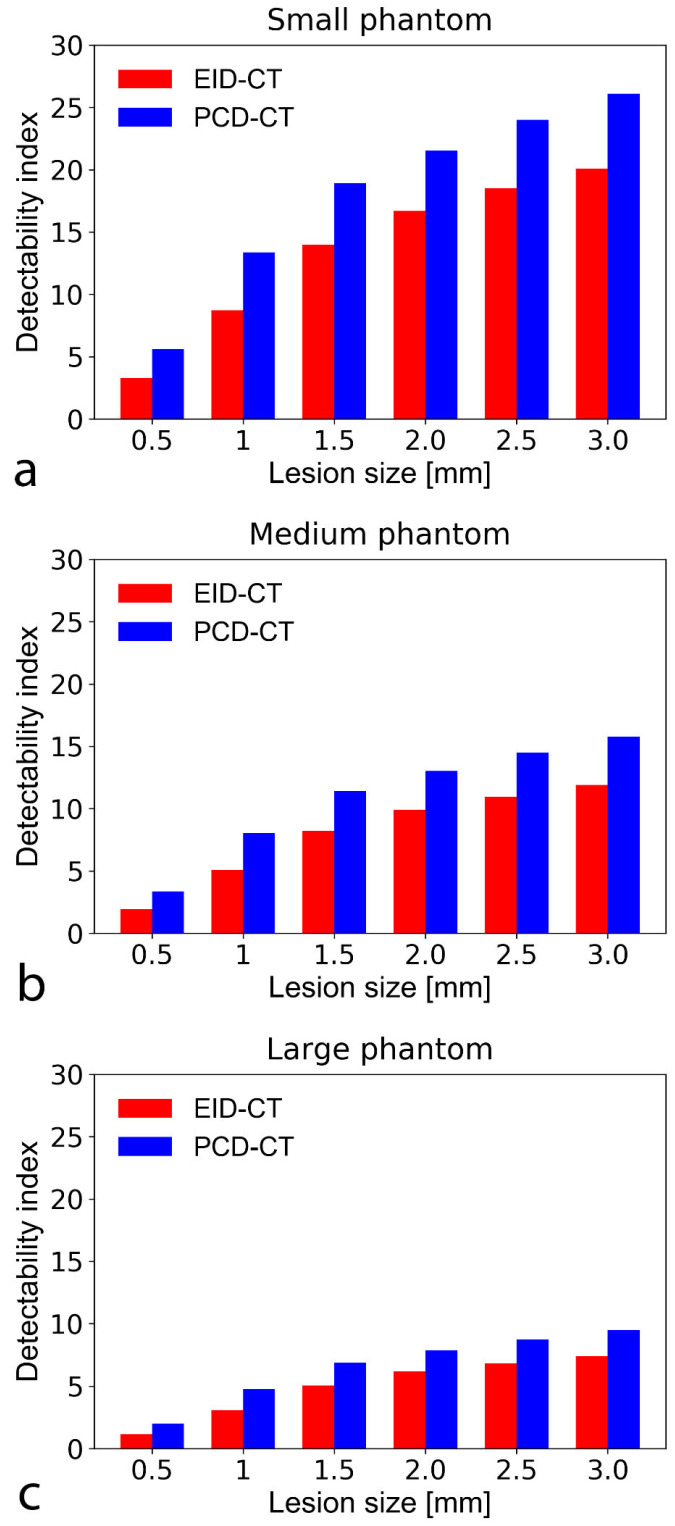
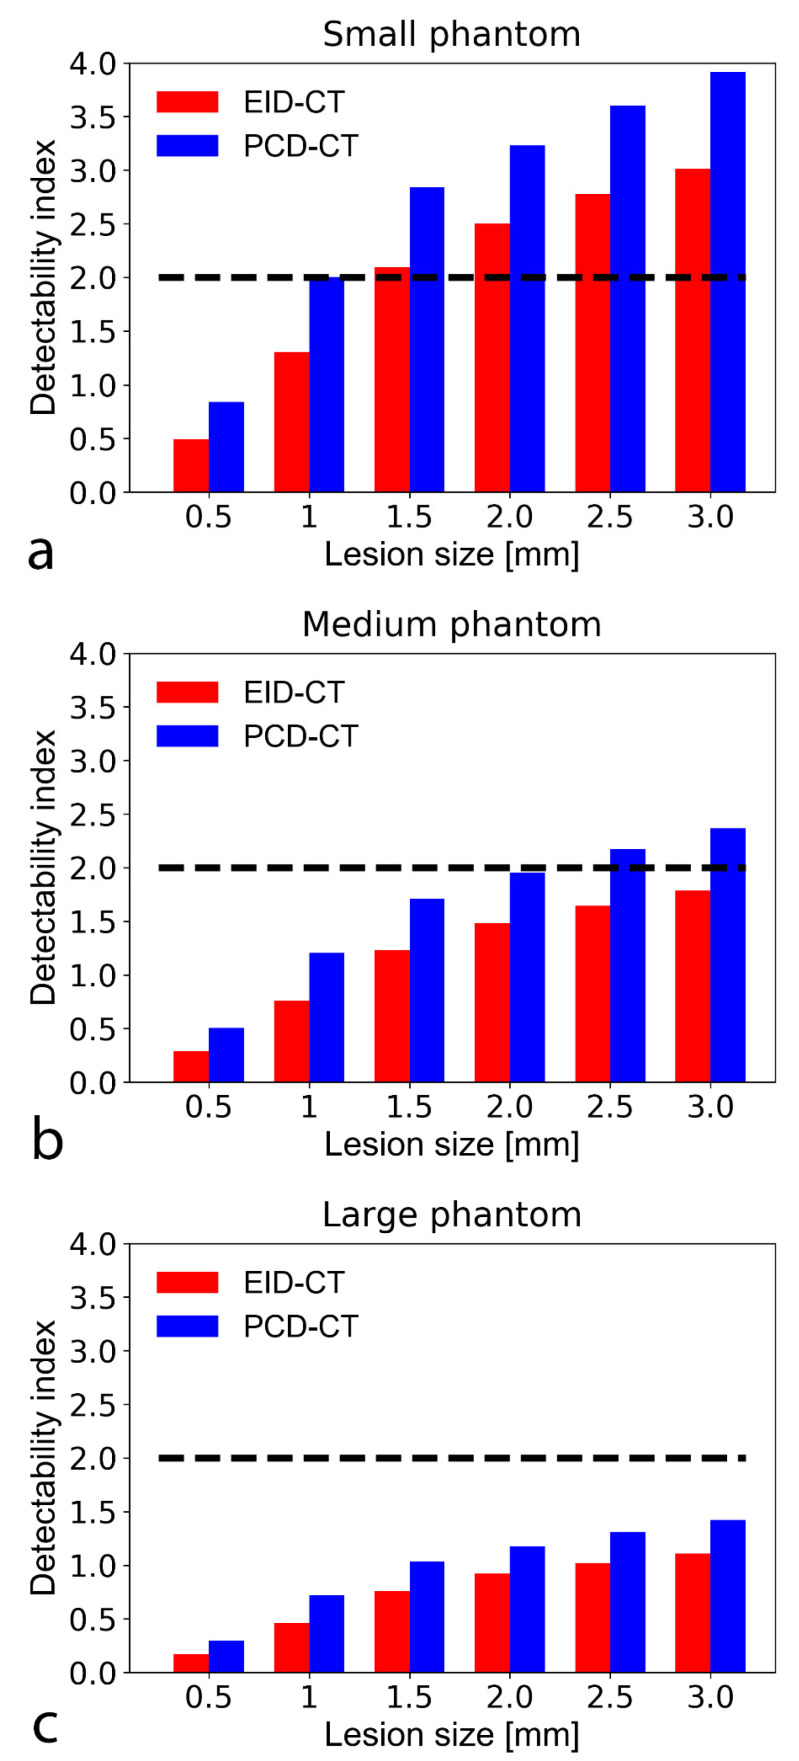
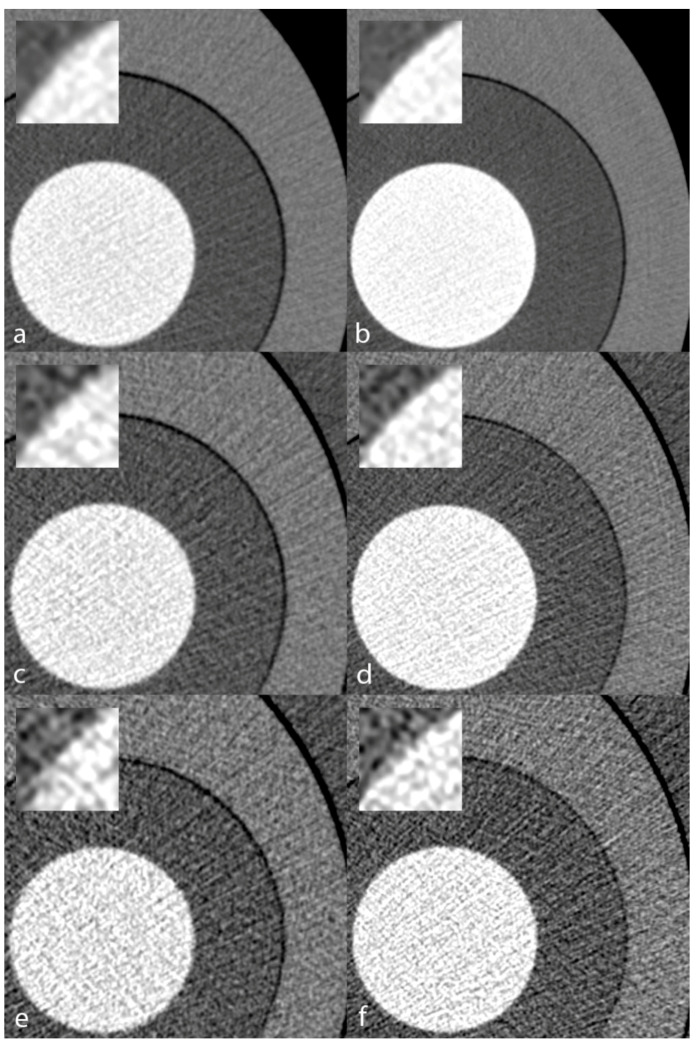
Methods: We scanned a thorax phantom with a coronary artery module at 10 mGy on a prototype SPCCT and a clinical dual-layer EID-CT under various conditions of simulated patient size (small, medium, and large). We used filtered back-projection with a soft-tissue kernel. We assessed noise and contrast-dependent spatial resolution with noise power spectra (NPS) and target transfer functions (TTF), respectively. Detectability indices (d') of simulated non-calcified and lipid-rich atherosclerotic plaques were computed using the non-pre-whitening with eye filter model observer.

Results: SPCCT provided lower noise magnitude (9-38% lower NPS amplitude) and higher noise frequency peaks (sharper noise texture). Furthermore, SPCCT provided consistently higher spatial resolution (30-33% better TTF10). In the detectability analysis, SPCCT outperformed EID-CT in all investigated conditions, providing superior d'. SPCCT reached almost perfect detectability (AUC ≈ 95%) for simulated 0.5-mm-thick non-calcified plaques (for large-sized patients), whereas EID-CT had lower d' (AUC ≈ 75%). For lipid-rich atherosclerotic plaques, SPCCT achieved 85% AUC vs. 77.5% with EID-CT.

Conclusions: SPCCT outperformed EID-CT in detecting simulated coronary atherosclerosis and might enhance diagnostic accuracy by providing lower noise magnitude, markedly improved spatial resolution, and superior lipid core detectability.

Keywords: cardiac imaging techniques; computed tomography angiography; coronary vessels; image quality enhancement; phantoms imaging.


Conflict of interest statement

Yoad Yagil, Klaus Erhard, and Elias Lahoud declare relationships with the following company: Philips Healthcare.

Figures

Figure 1
Figure 1
EID-CT (a) and SPCCT (b) systems with the phantom setup that was placed at the isocenter. CCTA module made of PE is shown with an empty cavity (blue star) to be filled with iodinated contrast material solution for the experiments. The anthropomorphic thorax phantom is shown with a fat-mimicking extension ring (“medium” patient size configuration). CCTA—coronary computed tomography angiography; EID-CT—energy-integrating detector computed tomography; PE—polyethylene; SPCCT—spectral photon-counting computed tomography.
Figure 2
Figure 2
Axial CT image shows four examples (1, 2, 3, and 4) of region-of-interest (ROI) placement in the medium phantom for calculation of noise power spectrum (NPS). The position is similar in small and large phantoms.
Figure 3
Figure 3
NPS curves obtained on a clinical EID-CT (solid lines) and a prototype PCD-CT (dashed lines) system at various phantom sizes. The area under the curve is representative of the noise magnitude, whereas the NPS center frequency indicates differences in noise texture. NPS—noise power spectrum; PCD-CT—photon-counting detector computed tomography; EID-CT—energy-integrating detector computed tomography.
Figure 4
Figure 4
TTF curves obtained on a clinical EID-CT (solid lines) and a prototype PCD-CT (dashed lines) system at various phantom sizes. The area under the curve indicates spatial resolution performance. TTF—target transfer function; PCD-CT—photon-counting detector computed tomography; EID-CT—energy-integrating detector computed tomography.
Figure 5
Figure 5
Bar chart show detectability indices (d’) of non-calcified atherosclerotic plaque with an object-to-background contrast |ΔHU| of 450 HU and CTDI = 10 mGy in the small (a), medium (b), and large sized (c) phantom setup. A d’ of 2 corresponds to 90% accuracy (AUC). The SPCCT consistently provided higher detectability indices than the conventional system. Note that at large phantom size, only the PCD-CT system could accurately detect (i.e., with a d’ ≥ 2 indicating an AUC of 90%) the smallest simulated plaque (0.5 mm). CTDI—computed tomography dose index; PCD-CT—photon-counting detector computed tomography. CTDI—computed tomography dose index; EID-CT—energy-integrating detector computed tomography; AUC—area under the curve.
Figure 6
Figure 6
Bar chart shows detectability indices (d’) of lipid-rich atherosclerotic plaque with an object-to-background contrast |ΔHU| of 30 HU in the small (a), medium (b), and large sized (c) phantom setup. A d’ of 2 corresponds to 90% accuracy (AUC), plotted on the graphs as a black dashed line. The PCD-CT consistently provided higher detectability indices than the conventional system. At the tested CTDI of 10 mGy, neither the EID nor the SPCCT reached 90% AUC to detect a 0.5 mm lipid core. With the small phantom, the EID and SPCCT systems reached 90% AUC down to a lipid core size of 1.5 and 1 mm, respectively. AUC—area under the curve; CTDI—computed tomography dose index; EID-CT—energy-integrating detector computed tomography; PCD-CT—photon-counting detector computed tomography.
Figure 7
Figure 7
Visual appearance of the TTF phantom inserted in a small (a,b), medium (c,d), and large (e,f) anthropomorphic chest phantom. Conventional reconstructions obtained from acquisitions on the EID-CT (a,c,e) and the PCD-CT (b,d,f) systems. Zoomed views of the polyethylene/iodinated solution transition better depict the finer noise texture and sharper transition yielded by the PCD-CT. TTF—target transfer function; PCD-CT—photon-counting detector computed tomography; EID-CT—energy-integrating detector computed tomography.

References

    1. Schoepf U.J., Zwerner P.L., Savino G., Herzog C., Kerl J.M., Costello P. Coronary CT angiography. Radiology. 2007;244:48–63. doi: 10.1148/radiol.2441052145. - DOI - PubMed
    1. Hounsfield G.N. Computerized transverse axial scanning (tomography). 1. Description of system. Br. J. Radiol. 1973;46:1016–1022. doi: 10.1259/0007-1285-46-552-1016. - DOI - PubMed
    1. Cavallo A.U., Patterson A.J., Thomas R., Alaiti M.A., Attizzani G.F., Laukamp K., Hokamp N.G., Bezerra H., Gilkeson R., Rajagopalan S. Low dose contrast CT for transcatheter aortic valve replacement assessment: Results from the prospective SPECTACULAR study (spectral CT assessment prior to TAVR) J. Cardiovasc. Comput. Tomogr. 2020;14:68–74. doi: 10.1016/j.jcct.2019.06.015. - DOI - PubMed
    1. Rotzinger D.C., Si-Mohamed S.A., Yerly J., Boccalini S., Becce F., Boussel L., Meuli R.A., Qanadli S.D., Douek P.C. Reduced-iodine-dose dual-energy coronary CT angiography: Qualitative and quantitative comparison between virtual monochromatic and polychromatic CT images. Eur. Radiol. 2021;31:7132–7142. doi: 10.1007/s00330-021-07809-w. - DOI - PMC - PubMed
    1. Bae K., Jeon K.N., Cho S.B., Park S.E., Moon J.I., Baek H.J., Choi B.H. Improved opacification of a suboptimally enhanced pulmonary artery in chest CT: Experience using a dual-layer detector spectral CT. Am. J. Roentgenol. 2018;210:734–741. doi: 10.2214/AJR.17.18537. - DOI - PubMed