. 2021 Nov 24;10(12):3280.
doi: 10.3390/cells10123280.

Optimized 3D Culture of Hepatic Cells for Liver Organoid Metabolic Assays

Affiliations

Optimized 3D Culture of Hepatic Cells for Liver Organoid Metabolic Assays

Christian Moya Gamboa et al. Cells. .

Abstract

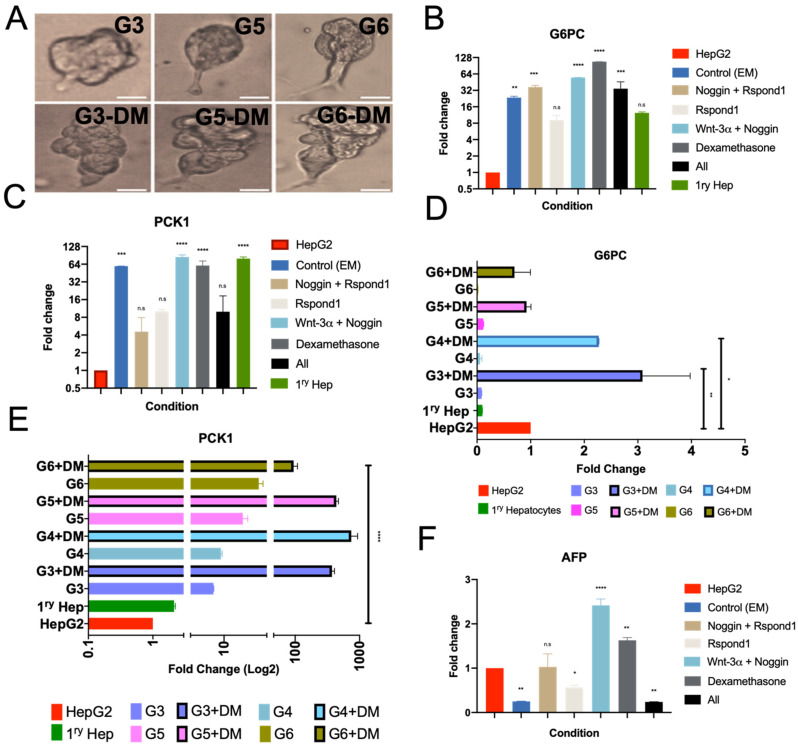
The liver is among the principal organs for glucose homeostasis and metabolism. Studies of liver metabolism are limited by the inability to expand primary hepatocytes in vitro while maintaining their metabolic functions. Human hepatic three-dimensional (3D) organoids have been established using defined factors, yet hepatic organoids from adult donors showed impaired expansion. We examined conditions to facilitate the expansion of adult donor-derived hepatic organoids (HepAOs) and HepG2 cells in organoid cultures (HepGOs) using combinations of growth factors and small molecules. The expansion dynamics, gluconeogenic and HNF4α expression, and albumin secretion are assessed. The conditions tested allow the generation of HepAOs and HepGOs in 3D cultures. Nevertheless, gluconeogenic gene expression varies greatly between conditions. The organoid expansion rates are limited when including the TGFβ inhibitor A8301, while are relatively higher with Forskolin (FSK) and Oncostatin M (OSM). Notably, expanded HepGOs grown in the optimized condition maintain detectable gluconeogenic expression in a spatiotemporal distribution at 8 weeks. We present optimized conditions by limiting A8301 and incorporating FSK and OSM to allow the expansion of HepAOs from adult donors and HepGOs with gluconeogenic competence. These models increase the repertoire of human hepatic cellular tools available for use in liver metabolic assays.

Keywords: 3D culture; HepG2 cells; gluconeogenesis; liver regeneration; metabolic assays; organoids.


Conflict of interest statement

Rutgers University has filed a provisional patent application on the methods described in the manuscript. H.E.S. is the scientific founder of Celvive, Inc. (New Brunswick, NJ, USA).

Figures

Figure 1
Figure 1
Human hepatic organoids in 3D culture. (A) Schematic of the single cell derived hepatic organoid generation process. Adult donor-derived hepatocytes and/or HepG2 cells were subjected to 3D culture, expansion in expansion media (EM) under various supplemental conditions, and differentiation in hepatocyte differentiation media (DM), followed by molecular assays for hepatocyte-specific markers and glucose production assays for gluconeogenesis. (B) Top, various EM conditions (C1–C6) tested on primary hepatocytes and HepG2 cells. Brightfield images of human-derived organoids derived from dissociated single cells after expansion for the indicated times in EM supplemented with growth factors and small molecules (FSK, Forskolin, OSM, Oncostatin M, A8301). Representative images from conditions that allowed the formation of organoids at day 7 with cell viability at 90 ± 5%. (C) Percentage organoid forming efficiency from primary hepatocytes in 3D organoid cultures (HepAOs) in different media conditions. (D) Bright field images of expanded primary hepatocytes in 3D organoid cultures (HepAOs) grown in different media conditions. Experiments were with hepatocytes derived from three different donors. (E) Number of HepAOs generated using three distinct small molecules EM conditions. (F) Hepatic organoids generated in C6 EM expanded for 4 weeks, followed by Differentiation Media (DM) with BMP7 for 2 weeks. Organoids were passaged twice followed by IF. Respective stains: DAPI for nuclei, HNF4α for hepatocytes, ALBUMIN (ALB) for hepatocyte function. All experiments were performed in triplicate unless otherwise stated. Scale bar is 100 μm. Comparison of counts and conditions were determined by two-way ANOVA with Bonferroni post hoc test (**** p < 0.0001, ** p < 0.01).
Figure 2
Figure 2
Expansion of HepG2 cells in 3D organoid cultures under different conditions. (A) Various EM with supplemental conditions, combined with differentiation in DM, for 3D culture of HepG2 cells to form HepGOs. (B) Counts of HepGOs derived using BMP7 and A8301 supplemented conditions, compared to regular HepG2 growth media (GM). (C) Counts of HepGOs organoids derived using various supplemented conditions. As expected, the number of organoids grown in conjunction with OSM and FSK is the highest when compared to the other conditions. (D) Proliferation rate of single cell-derived HepGOs and in vitro growth rate at the indicated time in optimized EM. Doubling time is indicated on days 21–28. Comparison of counts and conditions were determined by two-way ANOVA with Bonferroni post hoc test (**** p < 0.0001, *** p < 0.001, ** p < 0.01, ns, not significant).
Figure 3
Figure 3
Gluconeogenic marker expression in 3D organoid cultures under different conditions. (A) Representative images of HepGOs derived under various conditions described in Figure 2A. HepGOs were expanded for one month, and then media were supplemented with 25 ng/mL of BMP7 for 5 days before replacing the media with hepatocyte DM for one week. Data are from experiments that were done in at least in duplicate with three replicates per condition and were normalized to the endogenous control (β-Actin) and HepG2 GM cultures. Scale bar is 100 μm. (B,C) Expression of G6PC and PCK1 in standard EM and EM supplemented with various core molecules. (D,E) Expression of G6PC and PCK1 in EM conditions (C3–C6) that produced the highest number of organoids. (F) AFP fold change of expression of HepGOs grown under different conditions. (**** p < 0.0001, *** p < 0.001, ** p < 0.01, * p < 0.05, ns, not significant).
Figure 4
Figure 4
Expansion and freezing of human hepatic organoids in 3D culture. (AC) Expression of OCT4 (surrogate marker for ASC), hepatic marker HNF4α, and gluconeogenic markers G6PC and PCK1 in HepGOs, HepAOs (immediately after EM), and HepAOs after 2-week (HepAO-2wk) or one month (HepAOs-1M) of organoid freezing and thawing under various EM conditions with FSK + A8301, A8301, and OSM (C3–C5). Data demonstrate the normalized fold change over base line expression in organoid cultures. Data are from experiments that were performed in at least in duplicate with (N = 3) donor hepatocytes and multiple HepG2 organoid cultures, each in three replicates per condition. (*** p < 0.001, ** p < 0.01, * p < 0.05).
Figure 5
Figure 5
HepGOs show dynamic rates of expansion and expression of functional markers. (A) Representative IF images of HepGOs (white dotted line outlining each organoid) expanded for the indicated times. At 4 weeks, ALB staining in organoids (red) (arrow), while smaller cell structures (arrowhead) showed minimal or no staining. Note the expression of HNF4α (green) and the functional marker ALB (red) over DAPI, the nuclear marker in blue, becomes localized to the periphery of larger organoids (right side vs. left side images of organoids at 8 weeks). (B,C) Higher power IF images showing HNF4α and ALB-expressing cells within the peripheral area of HepGOs at 6 and 8 weeks, respectively. Scale bar is 100 μm in A and 10 μm in (B,C).
Figure 6
Figure 6
HepGOs show spatial distribution of HNF4α and ALB-expressing cells and metabolic competence. (A) High power IF images showing the central core and the peripheral area of HepGOs at 8 weeks. Representative cells within the central core and peripheral area of the same organoid are outlined with white dotted lines. The typical nuclear DAPI (blue) and HNF4α (green) overlay and cytosolic ALB (red) staining are outlined in the two zones. (B,C) Quantitation of expression of HNF4α (green) and the functional marker ALBUMIN (ALB) in HepGOs at the indicated times. (D) Glucose production in HepGOs expanded in C6 EM supplemented with F + OSM. The HepGOs were starved for 3 or 24 h and then allowed to produce glucose for 24 h. The glucose production basal media (BM) was supplemented with either glycerol, glucagon, or a combination of the two. Data were obtained from pooled organoids with a total of ~70,000 organoid cells. Scale bar is 10 μm. (** p < 0.01, * p < 0.05).

References

    1. Asrani S.K., Devarbhavi H., Eaton J., Kamath P.S. Burden of liver diseases in the world. J. Hepatol. 2019;70:151–171. doi: 10.1016/j.jhep.2018.09.014. - DOI - PubMed
    1. Zhou W.C., Zhang Q.B., Qiao L. Pathogenesis of liver cirrhosis. World J. Gastroenterol. 2014;20:7312–7324. doi: 10.3748/wjg.v20.i23.7312. - DOI - PMC - PubMed
    1. Alexander M., Loomis A.K., van der Lei J., Duarte-Salles T., Prieto-Alhambra D., Ansell D., Pasqua A., Lapi F., Rijnbeek P., Mosseveld M., et al. Risks and clinical predictors of cirrhosis and hepatocellular carcinoma diagnoses in adults with diagnosed NAFLD: Real-world study of 18 million patients in four European cohorts. BMC Med. 2019;17:95. doi: 10.1186/s12916-019-1321-x. - DOI - PMC - PubMed
    1. Beale E.G., Hammer R.E., Antoine B., Forest C. Disregulated glyceroneogenesis: PCK1 as a candidate diabetes and obesity gene. Trends Endocrinol. Metab. 2004;15:129–135. doi: 10.1016/j.tem.2004.02.006. - DOI - PubMed
    1. Haeusler R.A., Camastra S., Astiarraga B., Nannipieri M., Anselmino M., Ferrannini E. Decreased expression of hepatic glucokinase in type 2 diabetes. Mol. Metab. 2015;4:222–226. doi: 10.1016/j.molmet.2014.12.007. - DOI - PMC - PubMed

Publication types

MeSH terms

LinkOut - more resources