. 2021 Nov 26;10(12):3314.
doi: 10.3390/cells10123314.

Disruption of Circadian Rhythms by Ambient Light during Neurodevelopment Leads to Autistic-like Molecular and Behavioral Alterations in Adult Mice

Affiliations

Disruption of Circadian Rhythms by Ambient Light during Neurodevelopment Leads to Autistic-like Molecular and Behavioral Alterations in Adult Mice

Kun Fang et al. Cells. .

Abstract

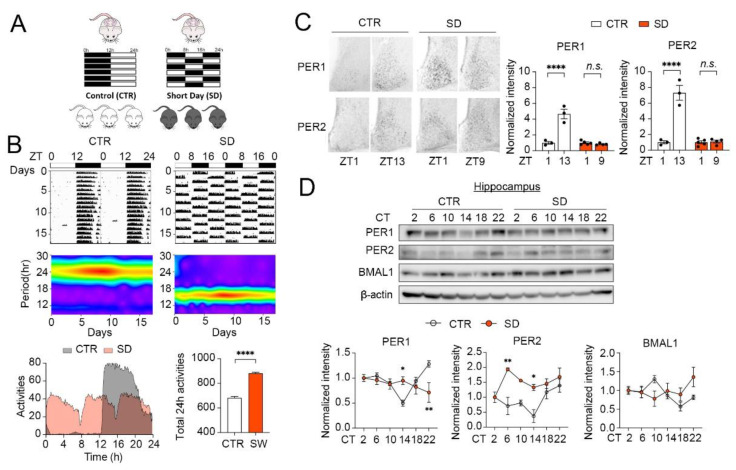
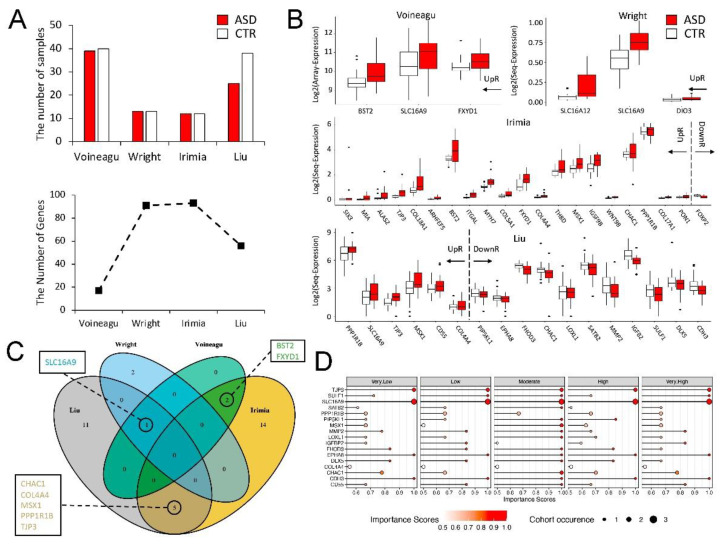
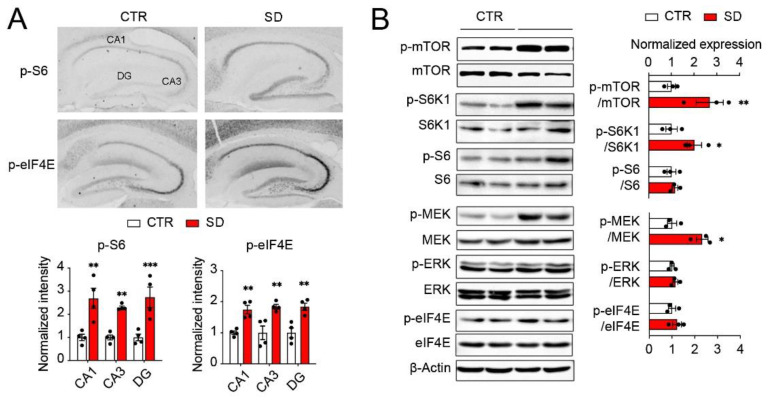
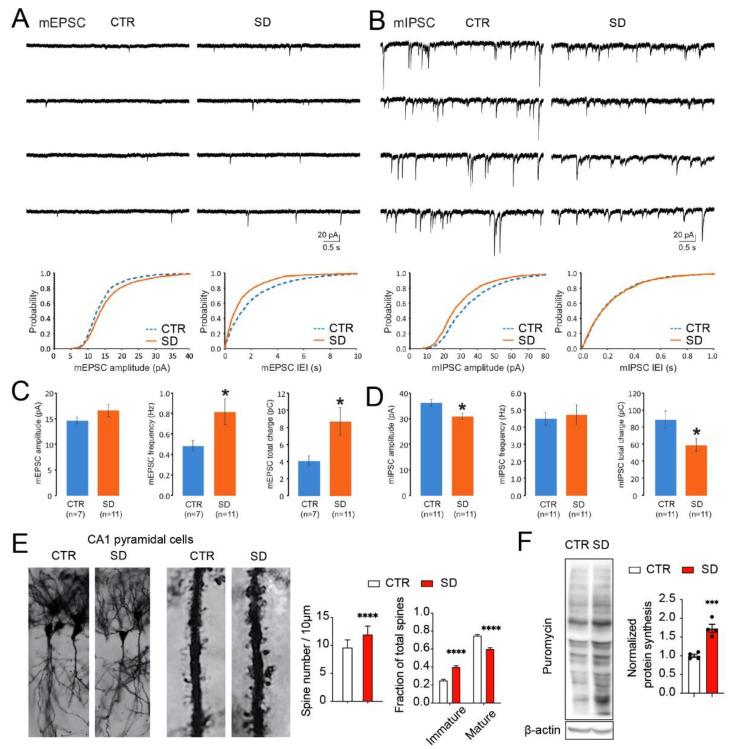
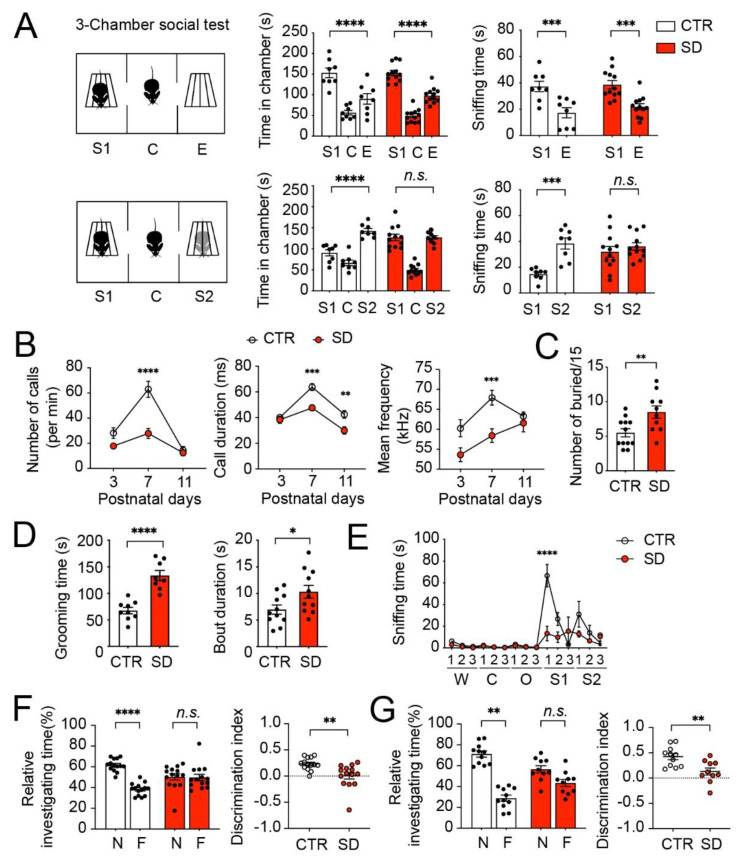
Although circadian rhythms are thought to be essential for maintaining body health, the effects of chronic circadian disruption during neurodevelopment remain elusive. Here, using the "Short Day" (SD) mouse model, in which an 8 h/8 h light/dark (LD) cycle was applied from embryonic day 1 to postnatal day 42, we investigated the molecular and behavioral changes after circadian disruption in mice. Adult SD mice fully entrained to the 8 h/8 h LD cycle, and the circadian oscillations of the clock proteins, PERIOD1 and PERIOD2, were disrupted in the suprachiasmatic nucleus and the hippocampus of these mice. By RNA-seq widespread changes were identified in the hippocampal transcriptome, which are functionally associated with neurodevelopment, translational control, and autism. By western blotting and immunostaining hyperactivation of the mTOR and MAPK signaling pathways and enhanced global protein synthesis were found in the hippocampi of SD mice. Electrophysiological recording uncovered enhanced excitatory, but attenuated inhibitory, synaptic transmission in the hippocampal CA1 pyramidal neurons. These functional changes at synapses were corroborated by the immature morphology of the dendritic spines in these neurons. Lastly, autistic-like animal behavioral changes, including impaired social interaction and communication, increased repetitive behaviors, and impaired novel object recognition and location memory, were found in SD mice. Together, these results demonstrate molecular, cellular, and behavioral changes in SD mice, all of which resemble autistic-like phenotypes caused by circadian rhythm disruption. The findings highlight a critical role for circadian rhythms in neurodevelopment.

Keywords: MAPK; autism; circadian rhythm; mTOR; neurodevelopmental disorder; translational control.


Conflict of interest statement

The authors declare no conflict of interest.

Figures

Figure 1
Figure 1
Daily rhythms of animal locomotor activities and clock gene expression are disrupted in SD mice. (A) A diagram indicating the strategy to generate the SD mice. (B) Top: Representative actograms of mouse wheel-running activities in control (CTR) and Short Day (SD) mice. Middle: Morlet wavelet transform analysis below indicates that CTR mice entrained to the 12 h/12 h light/dark cycle and exhibited a circadian period of 24 h. In contrast, SD mice entrained to the 8 h/8 h light/dark cycle and exhibited a circadian period of 8 h. Bottom: Average activities of CTR (n = 4) and SD (n = 3) mice across 24 h. Note that the SD mice exhibited a higher level of total activities in 24 h as compared with the CTR mice. (C) Representative microscopic images of immunostaining for PER1 and PER2 in the SCN. ZT1: one hour after light-on for CTR and SD mice; ZT13 and ZT9: 1 h after light-off for CTR and SD mice. Quantitative analysis of staining intensity is shown to the right. The levels at ZT13 and ZT9 were normalized according to the levels at ZT1 in the CTR and the SD mice, respectively. Note that PER1 and Per2 levels were not different between ZT1 and ZT9 in SD mice. Data are displayed as individual values and mean ± SEM. n = 3 in CTR and n = 4–5 in SD. **** p < 0.0001; n.s., not significant vs. ZT1. (D) Western blotting images indicate that PER1, PER2, and BMAL1 exhibited circadian oscillations in the hippocampi of the CTR, but not the SD, mice. Quantitation of protein levels is shown below. For this experiment mice were kept in constant darkness for 48 h and hippocampal samples were harvested every 4 h in the next 24 h. Data are displayed as mean ± SEM. n = 3 in CTR and SD. ** p < 0.01; * p < 0.05 vs. CTR.
Figure 2
Figure 2
Genome-wide transcriptional changes in the hippocampi of SD mice. (A) Volcano plot shows the Log2 (fold-change) and Log2 (p-value) of the genes. DEGs are highlighted with red color. (B) Heatmap shows the Z-scored expression value of identified DEGs. We identified 226 UpRGs and 90 DownRGs in the SD mice. (C) Top 25 GO analysis results of DEGs. P-value is indicated by the color of points and the size of points is a proportion of the odds ratio. Negative log2 (combined score) indicates the pathway analyzed from the downregulated gene set. (D) DEGs network (protein–protein interaction from STRING v11.5), we found there were 7 upregulated and 6 downregulated genes that are included in the SFARI database. UpRGs are circled in red: slc29a4, magel2, fam92b, pon1, ttc25, dydc2, ppp1r1b; DownRGs are circled in green: satb2, rora, foxp2, rims3, ttn, tcf7l2. (E) Validation results of identified SFARI-overlapped DEGs by qRT-PCR. n = 3 in CTR and SD. ** p < 0.01; * p < 0.05 vs. CTR.
Figure 3
Figure 3
Multiple DEGs in the hippocampi of SD mice are identified as ASD risk genes in four published studies. (A) Top panel bar plot shows the number of ASD and CTR samples in each of the four published cohorts; bottom panel line plot shows the number of mouse-model-identified DEGs that also measured the expression in the cohort. (B) Boxplots show the expression values of overlapped DEGs between mouse models and each cohort (mice-cohort DEGs). There are 3, 3, 21, and 17 SD mice DEGs that are also differentially expressed in the cohort data of Voineagu et al., Wright et al., Irimia et al., and Liu et al., respectively. The genes in the boxplot are ordered by the Log2FC values. (C) Venn diagram shows the overlapping genes between mouse-cohort DEGs. We highlight that SLC16A9 is identified in three cohorts, and that CHAC1, COL4A4, MSX1, PPP1R1B, TJP3, BST2, FXYD1 are identified in two cohorts. (D) Dot plots show the importance score of genes for each ADI-R class in the data of Liu et al. The importance scores are calculated from the learning vector quantization model and are characterized as: Very Low, Low, Moderate, High, Very High, each corresponding to the low, moderate2, moderate1, high2, and high1 ADI-R classes in the original paper, respectively. The larger the importance score, the more the importance of the gene to predicting the ADI-R class. The size of the dot represents the occurrence of the gene in different cohorts.
Figure 4
Figure 4
Hyperactivation of mTOR and ERK MAPK pathways in the hippocampi of SD mice. (A) Representative microscopic images of the sagittal hippocampus sections immunostained for p-S6 and p-eIF4E in the CTR and SD mice. Quantitation of staining intensities in hippocampal CA1, CA3, and DG areas are shown below. Note significant increases in the p-S6 and p-eIF4E levels in the hippocampi of SD mice. Data are displayed as individual values and mean ± SEM. n = 4 in CTR and SD. *** p < 0.001; ** p < 0.01 vs. CTR. (B) Western blots indicate upregulation of mTOR/S6K1/S6 and MEK/ERK/eIF4E kinase activities in the forebrains of SD mice compared with CTR mice. Quantitative analysis is shown to the right. Data are displayed as individual values and mean ± SEM. n = 3 in CTR and SD. ** p < 0.01; * p < 0.05 vs. CTR.
Figure 5
Figure 5
Aberrant synaptic transmission, dendritic spine morphology, and protein synthesis in the hippocampi of SD mice. (A) Representative traces and cumulative probabilities (amplitude and inter event intervals, IEIs) of mEPSC recordings from hippocampal CA1 neurons. Quantitative analysis is shown below and in (C). * p < 0.05 vs. CTR. Note that the frequency and total charge, but not the average amplitude, were increased in the hippocampal CA1 neurons of SD mice compared with CTR mice. (B) Representative traces and cumulative probabilities (amplitude and inter event intervals, IEIs) of mIPSC recordings from hippocampal CA1 neurons. Quantitative analysis is shown below and in (D). * p < 0.05 vs. CTR. Note that the amplitude and total charge, but not the frequency, were decreased in the hippocampal CA1 neurons of SD mice compared with CTR mice. The frequency is the reciprocal of IEI. The total charge is the summation of the area integrals of mEPSCs (in a 3-min recording period) or mIPSCs (in a 1-min recording period). n denotes the number of neurons from >3 mice for each group. (E) Representative microscopic images of CA1 pyramidal neurons and dendritic spines afterGolgi–Cox staining. Quantitative analysis indicates that spine density and the fraction of immature dendritic spines were increased in dendrites of hippocampal CA1 neurons in SD mice compared with the CTR mice. Data are displayed as mean ± SEM. **** p < 0.0001; n = 51 neurons from 4 mice for CTR and SD groups. (F) A de novo protein synthesis assay by puromycin incorporation revealed the higher rate of global protein synthesis in the forebrains of SD mice compared with CTR mice. *** p < 0.001, n = 4 for CTR and SD mice.
Figure 6
Figure 6
Autistic-like behavioral changes in SD mice. (A) Three-chamber test for mouse sociability. Left: a schematic diagram. S1: stranger 1; C: center; E: empty; S2: stranger 2. Right: bar graphs indicating time spent in individual chambers and time spent sniffing wire cages during the three-chamber test. Note that both CTR and SD mice spent longer times in the S1 chamber and sniffing the S1 cage, compared with in the E chamber and sniffing the E cage. CTR mice spent longer times in the S2 chamber and sniffing the S2 cage, compared with in the S1 chamber and sniffing the S1 cage. In contrast, SD mice spent similar times in the S1 and S2 chamber and sniffing the S1 and S2 cage. Data are displayed as individual values and mean ± SEM. *** p < 0.001; **** p < 0.0001; n.s., not significant. Data are displayed as individual values and mean ± SEM. n = 8 in CTR and n = 12 in SD. (B) Ultrasonic vocalization tests at Postnatal Day (P) 3, 7, and 11. Note that SD pups exhibited a reduced number of calls, call durations, and call frequencies at P7 compared with the CTR pups. Data are displayed as mean ± SEM ** p < 0.01; *** p < 0.001; **** p < 0.0001 vs. CTR; n = 5–6 for P3 and P11 in CTR and SD; n = 8-9 for P7 in CTR and SD. (C) A bar graph indicates the numbers of marbles buried in the marble burying test. n = 12 in CTR and n = 10 in SD. Data are displayed as individual values and mean ± SEM. ** p < 0.01. (D) Spontaneous self-grooming test. Note that SD (n = 8) mice displayed increased grooming time and duration of bouts as compared with WT (n = 9) mice. * p <0.05; **** p < 0.0001 vs. CTR (E) Olfactory habituation test. W: water; C: cinnamon; O: food (butter); S1: social odor 1 (dirty cage swab1); S2: social odor 2 (dirty cage swab2). Note that time spent sniffing the social odor was markedly reduced, whereas time sniffing nonsocial odors was not changed in the SD mice compared with the CTR mice. **** p < 0.0001 vs. CTR. n = 4 mice in CTR and SD. Data are presented as mean ± SEM. (F) Novel object recognition test. During the training session, mice were exposed to two familiar (F) objects. After 24 h, one F objectwas replaced by a novel (N) object in the testing session. Time animals spent investigating the two objects was measured. The discrimination index was calculated as Timenovel − Timefamiliar/Timenovel + Timefamiliar. CTR (n = 14) mice spent a longer time investigating the N object compared with the F object, whereas the SD (n = 14) mice spent similar time investigating the N and familiar objects. The discrimination index was decreased in the SD mice compared with the CTR mice. ** p < 0.01; **** p < 0.0001 vs. CTR; n.s., not significant. (G) Object location memory test. During the training session, mice were exposed to two identical objects. After 24 h, one object was left at the same familiar (F) location and the other object was moved to a novel(N) location. Time animals spent investigating the two objects was measured. The discrimination index was calculated as Timenovel − Timefamiliar/Timenovel + Timefamiliar. CTR (n = 10) mice spent a longer time investigating the object in the Nlocationas compared with the object in the Flocation, whereas SD (n = 11) mice spent similar time investigating the objects in the Nlocation compared with the object in the Flocation. The discrimination index was decreased in the SD mice compared with the CTR mice. Data are displayed as individual values and mean ± SEM. ** p < 0.01; n.s., not significant.

References

    1. Reppert S.M., Weaver D.R. Coordination of circadian timing in mammals. Nature. 2002;418:935–941. doi: 10.1038/nature00965. - DOI - PubMed
    1. Parekh P.K., McClung C.A. Circadian Mechanisms Underlying Reward-Related Neurophysiology and Synaptic Plasticity. Front. Psychiatry. 2016;6:187. doi: 10.3389/fpsyt.2015.00187. - DOI - PMC - PubMed
    1. Takahashi J.S., Hong H.K., Ko C.H., McDearmon E.L. The genetics of mammalian circadian order and disorder: Implications for physiology and disease. Nat. Rev. Genet. 2008;9:764–775. doi: 10.1038/nrg2430. - DOI - PMC - PubMed
    1. Herzog E.D., Hermanstyne T., Smyllie N.J., Hastings M.H. Regulating the Suprachiasmatic Nucleus (SCN) Circadian Clockwork: Interplay between Cell-Autonomous and Circuit-Level Mechanisms. Cold Spring Harb. Perspect. Biol. 2017;9:a027706. doi: 10.1101/cshperspect.a027706. - DOI - PMC - PubMed
    1. Lorsung E., Karthikeyan R., Cao R. Biological Timing and Neurodevelopmental Disorders: A Role for Circadian Dysfunction in Autism Spectrum Disorders. Front. Neurosci. 2021;15:642745. doi: 10.3389/fnins.2021.642745. - DOI - PMC - PubMed

Publication types

MeSH terms

Substances