. 2021 Dec 13;10(12):3521.
doi: 10.3390/cells10123521.

Cannabidiol Inhibits Tau Aggregation In Vitro

Affiliations

Cannabidiol Inhibits Tau Aggregation In Vitro

Soha Alali et al. Cells. .

Abstract

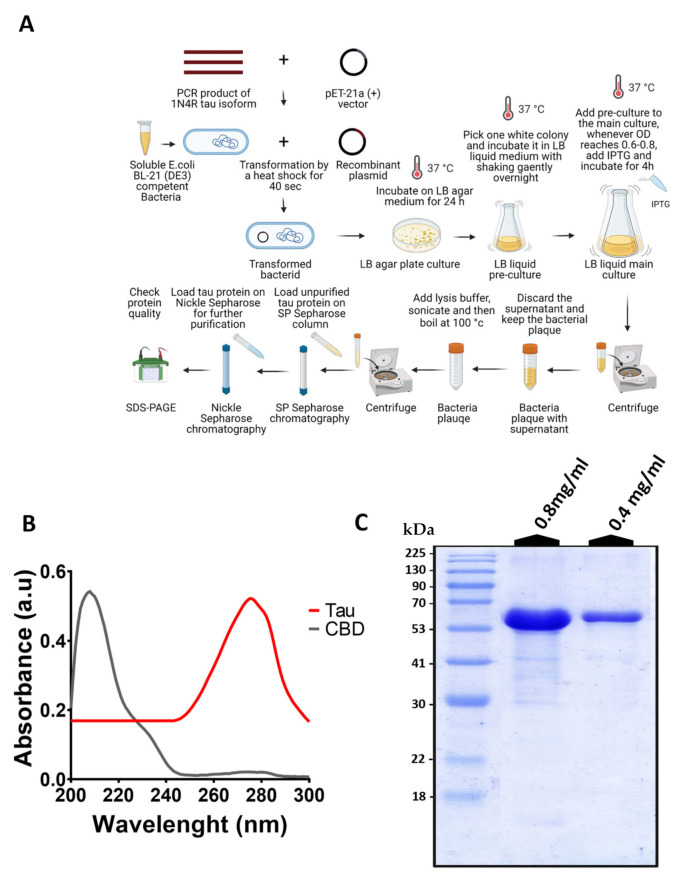
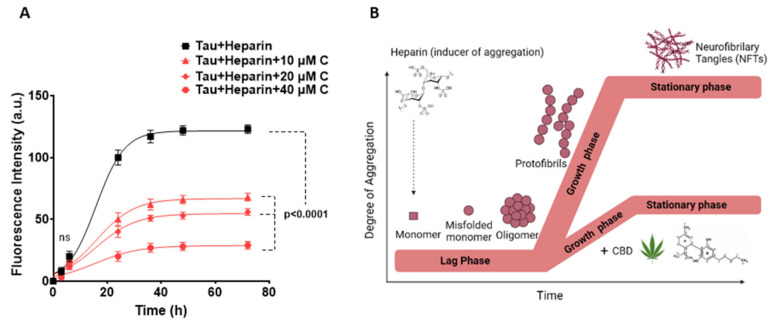
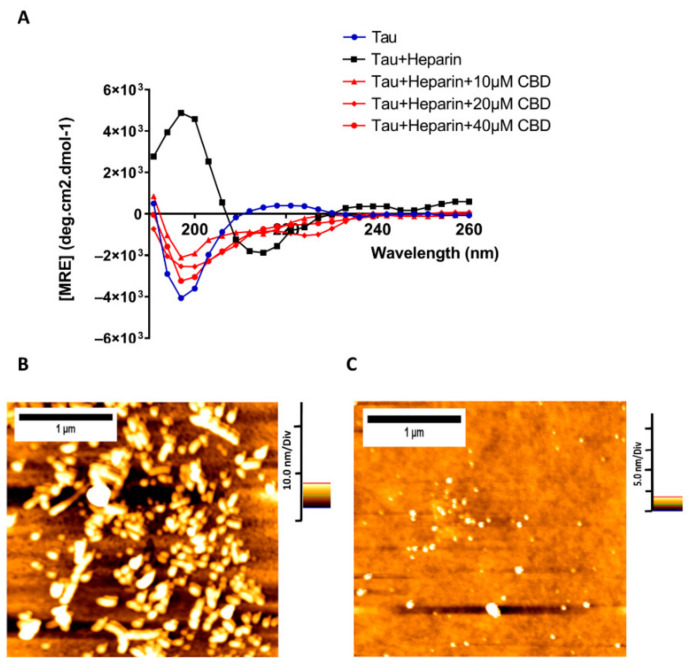
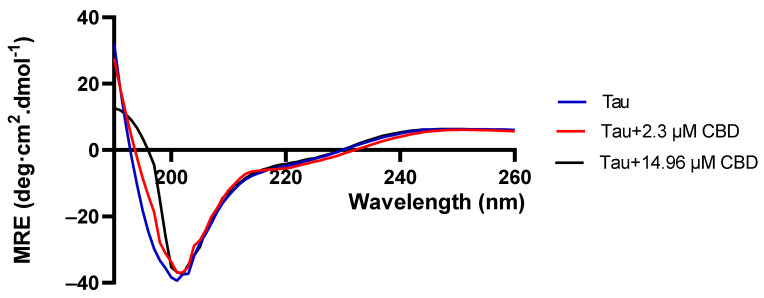
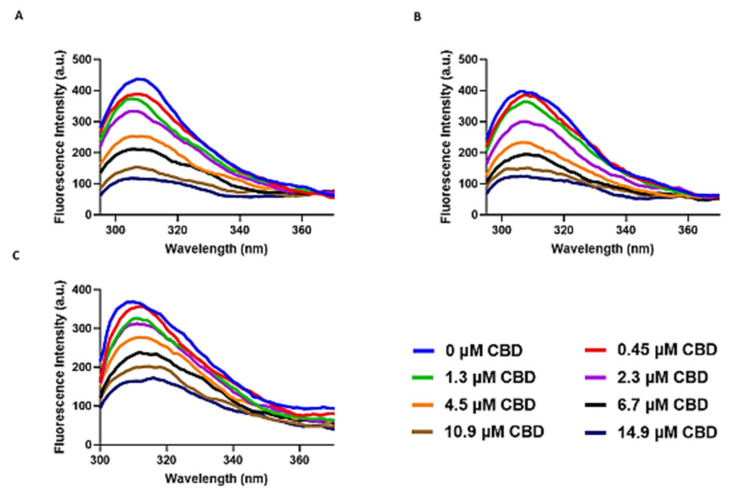
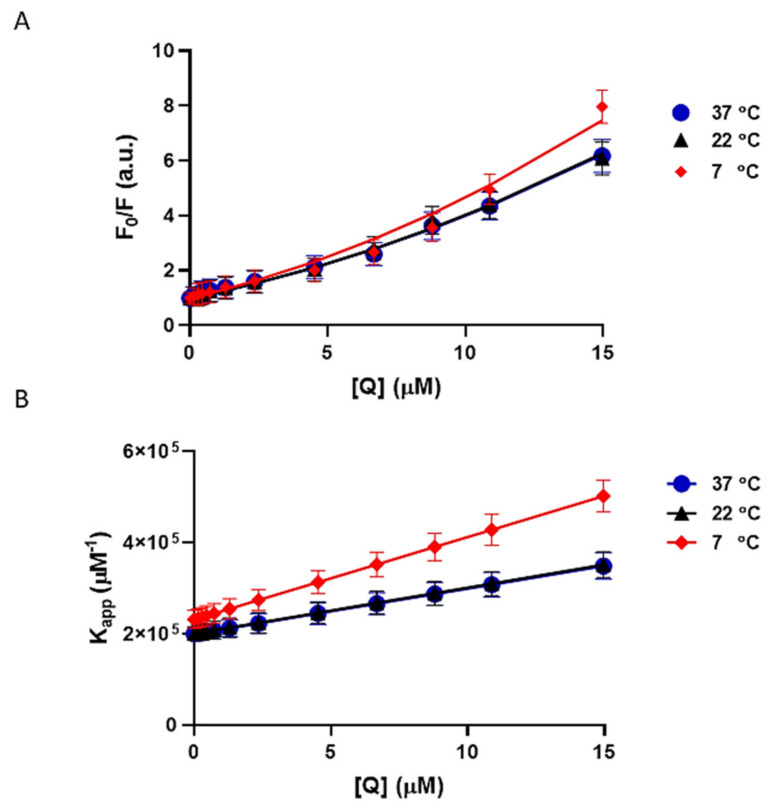
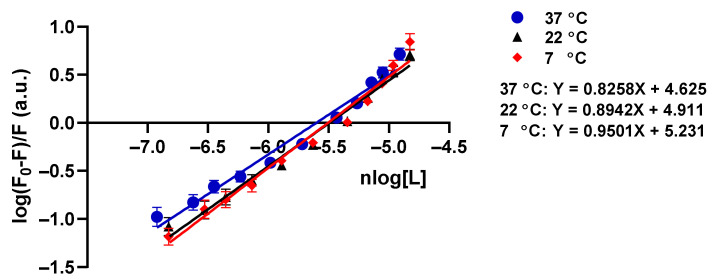
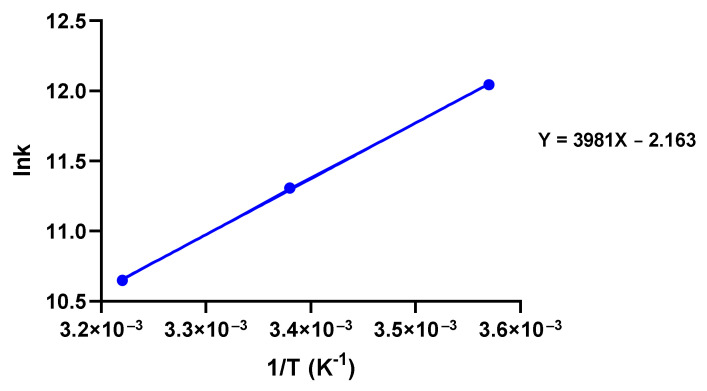
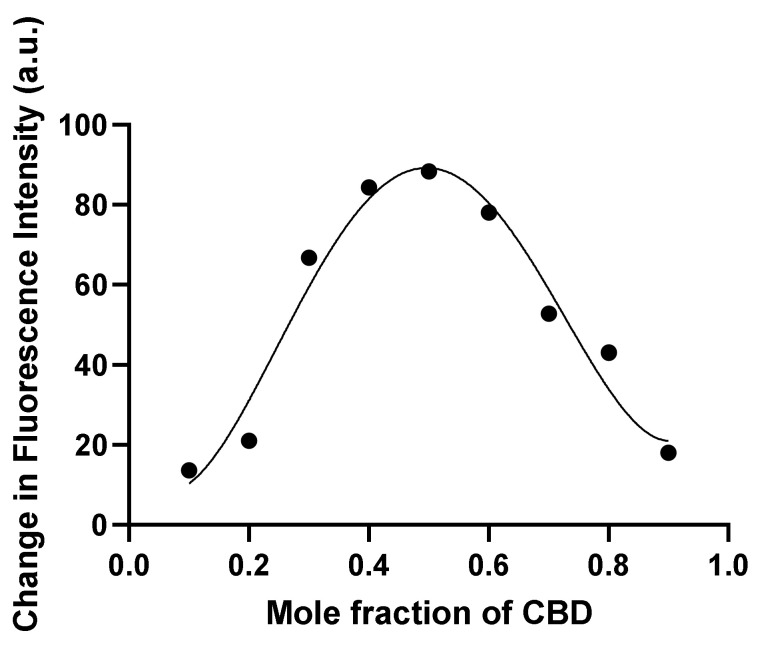
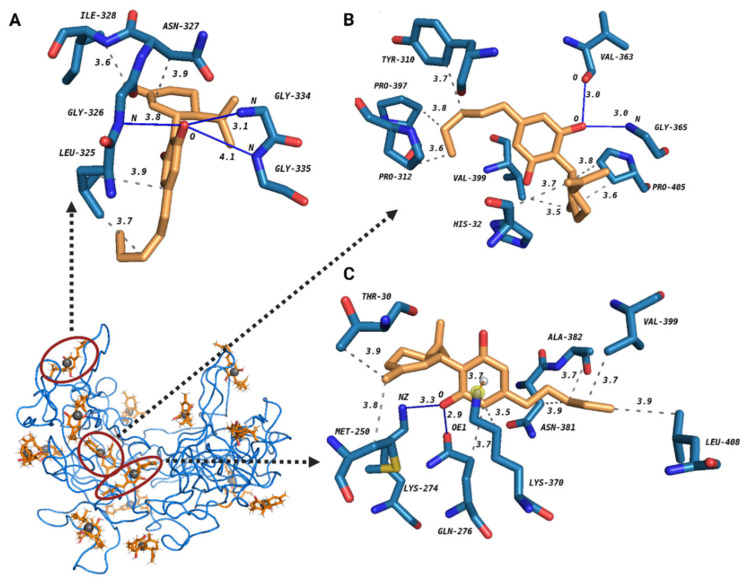
A hallmark of Alzheimer's disease (AD) is the accumulation of tau protein in the brain. Compelling evidence indicates that the presence of tau aggregates causes irreversible neuronal destruction, eventually leading to synaptic loss. So far, the inhibition of tau aggregation has been recognized as one of the most effective therapeutic strategies. Cannabidiol (CBD), a major component found in Cannabis sativa L., has antioxidant activities as well as numerous neuroprotective features. Therefore, we hypothesize that CBD may serve as a potent substance to hamper tau aggregation in AD. In this study, we aim to investigate the CBD effect on the aggregation of recombinant human tau protein 1N/4R isoform using biochemical methods in vitro and in silico. Using Thioflavin T (ThT) assay, circular dichroism (CD), and atomic force microscopy (AFM), we demonstrated that CBD can suppress tau fibrils formation. Moreover, by quenching assay, docking, and job's plot, we further demonstrated that one molecule of CBD interacts with one molecule of tau protein through a spontaneous binding. Experiments performed by quenching assay, docking, and Thioflavin T assay further established that the main forces are hydrogen Van der Waals and some non-negligible hydrophobic forces, affecting the lag phase of tau protein kinetics. Taken together, this study provides new insights about a natural substance, CBD, for tau therapy which may offer new hope for the treatment of AD.

Keywords: Alzheimer’s disease; amyloid fibrils; cannabidiol; tau protein.


Conflict of interest statement

The authors declare that the research was conducted in the absence of any commercial or financial relationships that could be construed as a potential conflict of interest.

Figures

Figure 1
Figure 1
In vitro generation of human his-tagged tau protein. (A) Scheme of the main steps of his-tagged 1N4R tau protein production using the pET-21a (+) expression vector in Escherichia coli BL21 and purification by Ni-NTA and SP Sepharose columns. (B) The absorbance of extracted tau protein with a peak at 280 nm and the absorbance of CBD with a peak at 207 nm by UV-visible spectroscopy. It indicates that there is no interference between CBD and tau protein absorbance. (C) The quality of purified tau protein using SDS-PAGE. Representative SDS-PAGE of purified tau protein (~59 kDa) at two different concentrations of 0.8 mg/mL and 0.4 mg/mL. The same trends were detected in the SDS-PAGE data of at least three independent samples (n = 3).
Figure 2
Figure 2
Aggregation kinetics of heparin-induced tau protein in the absence and presence of CBD. (A) ThT fluorescence assay to evaluate the kinetics of tau protein aggregation in the absence and presence of 10, 20 and 40 μM CBD after pre-induction with heparin. The aggregation kinetics of tau is plotted as fluorescence intensity of tau protein (a.u.) vs. time (h). The best-fitting curves for aggregation kinetics of tau follow a sigmoidal profile and a reduced rate appears in the presence of 10, 20, and 40 µM CBD. In addition, the kinetic changes of aggregation of tau alone were measured as zero constantly over time, so this result is not added in the kinetics plot. (B) Schematic representation of the three phases in the tau protein aggregation including lag phase, growth phase, and steady phase using the heparin inducer in the presence and absence of CBD. All data points are given as mean ± SD of three independent experiments (n = 3). P-value < 0.0001 is considered as statistically significant as determined by one-way ANOVA (Dunnet test) for the comparison between each data point vs. tau + heparin.
Figure 3
Figure 3
CBD is capable of reducing tau protein polymerization. (A) Far-UV CD spectra of 20 µM heparin-induced tau protein in the absence and presence of three concentrations of CBD (10, 20, and 40 µM) to monitor the changes in the secondary structures of tau aggregation after 72 h. Three independent experiments (n = 3) were performed to record the spectra. (B) AFM image of heparin-induced tau protein. (C) AFM image of heparin-induced tau protein in the presence of 40 µM CBD.
Figure 4
Figure 4
Far-Uv spectra in order to find out about CBD effect on tau protein structure. CBD transforms tau protein’s structure. Tau protein was incubated with CBD at concentrations of 2.3 µM and 14.96 µM for 30 min at 37 °C. Three independent experiments (n = 3) were performed to record the spectra.
Figure 5
Figure 5
Intrinsic fluorescence quenching of tau protein by different concentrations of CBD ranging from 0–14.9 µM (0 µM, 0.45 µM, 1.3 µM, 2.3 µM, 4.5 µM, 6.7 µM, 10.9 µM, and 14.9 µM) in the Tris-HCl buffer and PH = 7.5. (A) at 7 °C (B) at 22 °C (C) at 37 °C.
Figure 6
Figure 6
Modified Stern-Volmer plots of tau-CBD at 7 °C, 22 °C, and 37 °C. All data points are given as the mean ± SD of three independent experiments (n = 3). (A) Modified Stern–Volmer plot of tau protein fluorescence quenching at different concentrations of CBD from 0–14.9 µM (0 µM, 0.45 µM, 1.3 µM, 2.3 µM, 4.5 µM, 6.7 µM, 10.9 µM, and 14.9 µM) at 7 °C, 22 °C, and 37 °C. The data points are the results of the quenching experiment and the corresponding regressions are shown as lines. (B) The apparent quenching constant (Kapp ) plot of tau protein fluorescence quenching at different concentrations of CBD from 0–14.9 µM (0 µM, 0.45 µM, 1.3 µM, 2.3 µM, 4.5 µM, 6.7 µM, 10.9 µM, and 14.9 µM) at 7 °C, 22 °C, and 37 °C.
Figure 7
Figure 7
The Hill plots and intrinsic tau protein quenching constants of tau-CBD interaction at 7 °C, 22 °C, and 37 °C. Hill plot of tau protein fluorescence quenching at different concentrations of CBD from 0–14.9µM (0 µM, 0.45 µM, 1.3 µM, 2.3 µM, 4.5 µM, 6.7 µM, 10.9 µM, and 14.9 µM) at three different temperatures of 7 °C, 22 °C, and 37 °C. All data points are given as the mean ± SD of three independent experiments (n = 3).
Figure 8
Figure 8
Van’t Hoff plot of fluorescence quenching and analysis of thermodynamic parameters to unravel the type of forces between CBD and tau protein.
Figure 9
Figure 9
Stoichiometry determination of the predominant complex of tau-CBD. Changes of fluorescence intensity of a series of protein-ligand mixtures were measured. The total molar concentration of CBD and tau was constant (20 μM) but their mole fractions were varied.
Figure 10
Figure 10
The 3D graphical image of three best tau-CBD docking complexes predicted by Achilles platform Tau protein and CBD are shown in blue and orange, respectively. The grey spheres are pseudo atoms. The best docking pose for three best-fitted clusters of tau-CBD interaction is presented in detail as complex A, complex B, and complex C. Hydrophobic interactions (in dash line), hydrogen bonds (in blue line) and one pi-cation interaction (in red line) as well as the distances between the donor and the acceptor are shown in all three tau-CBD complexes.

References

    1. Jicha: G.A., Carr S.A. Conceptual evolution in Alzheimer’s disease: Implications for understanding the clinical phenotype of progressive neurodegenerative disease. J. Alzheimer’s Dis. 2010;19:253–272. doi: 10.3233/JAD-2010-1237. - DOI - PMC - PubMed
    1. Pallo S.P., Johnson G.V. Tau facilitates Aβ-Induced loss of mitochondrial membrane potential independent of cytosolic calcium fluxes in mouse cortical neurons. Neurosci. Lett. 2015;597:32–37. doi: 10.1016/j.neulet.2015.04.021. - DOI - PMC - PubMed
    1. De Anda-Hernández M.A., Lira-De León K.I., Mena R., Campos-Peña V., Meraz-Ríos M.A. Neuroscience–Dealing with Frontiers. IntechOpen; London, UK: 2012. Tau and Amyloid-β Conformational Change to β-Sheet Structures as Effectors in the Development of Alzheimer’s Disease; pp. 363–388.
    1. Papasozomenos S.C., Binder L.I. Phosphorylation determines two distinct species of Tau in the central nervous system. Cell Motil. Cytoskelet. 1987;8:210–226. doi: 10.1002/cm.970080303. - DOI - PubMed
    1. Barghorn S., Mandelkow E. Toward a unified scheme for the aggregation of tau into Alzheimer paired helical filaments. Biochemistry. 2002;41:14885–14896. doi: 10.1021/bi026469j. - DOI - PubMed

Publication types

MeSH terms