

Decreased miR-497-5p Suppresses IL-6 Induced Atrophy in Muscle Cells
- PMID: 34944037
- PMCID: PMC8700610
- DOI: 10.3390/cells10123527
Decreased miR-497-5p Suppresses IL-6 Induced Atrophy in Muscle Cells
Abstract
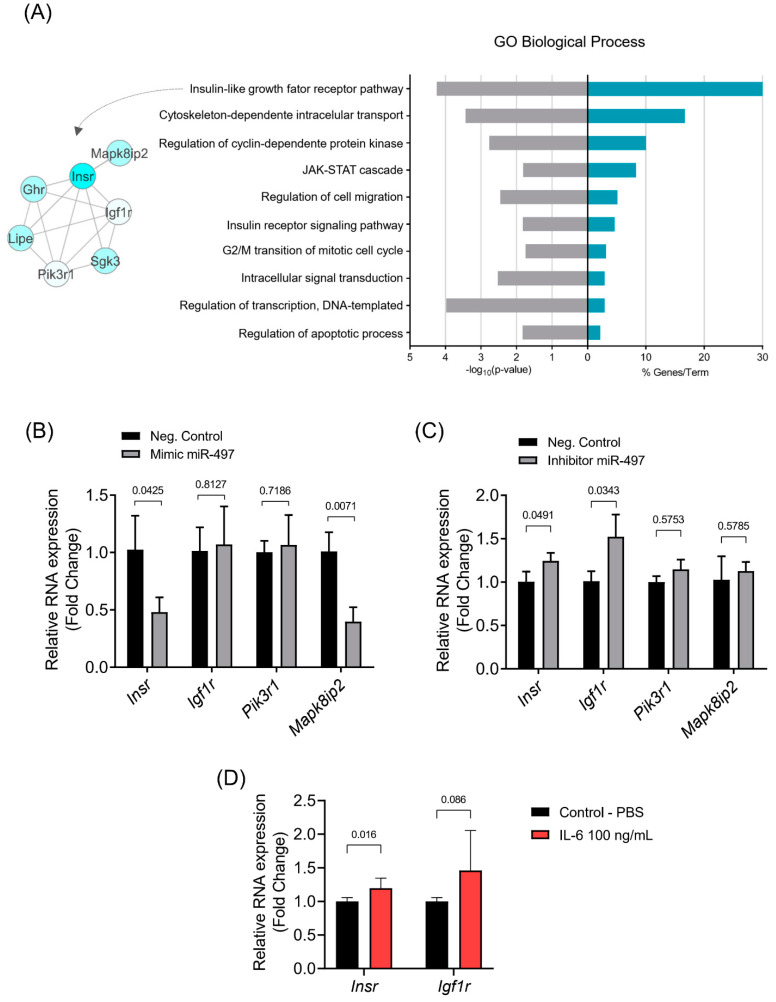
Interleukin-6 (IL-6) is a pro-inflammatory cytokine associated with skeletal muscle wasting in cancer cachexia. The control of gene expression by microRNAs (miRNAs) in muscle wasting involves the regulation of thousands of target transcripts. However, the miRNA-target networks associated with IL6-induced muscle atrophy remain to be characterized. Here, we show that IL-6 promotes the atrophy of C2C12 myotubes and changes the expression of 20 miRNAs (5 up-regulated and 15 down-regulated). Gene Ontology analysis of predicted miRNAs targets revealed post-transcriptional regulation of genes involved in cell differentiation, apoptosis, migration, and catabolic processes. Next, we performed a meta-analysis of miRNA-published data that identified miR-497-5p, a down-regulated miRNAs induced by IL-6, also down-regulated in other muscle-wasting conditions. We used miR-497-5p mimics and inhibitors to explore the function of miR-497-5p in C2C12 myoblasts and myotubes. We found that miR-497-5p can regulate the expression of the cell cycle genes CcnD2 and CcnE1 without affecting the rate of myoblast cellular proliferation. Notably, miR-497-5p mimics induced myotube atrophy and reduced Insr expression. Treatment with miR-497-5p inhibitors did not change the diameter of the myotubes but increased the expression of its target genes Insr and Igf1r. These genes are known to regulate skeletal muscle regeneration and hypertrophy via insulin-like growth factor pathway and were up-regulated in cachectic muscle samples. Our miRNA-regulated network analysis revealed a potential role for miR-497-5p during IL6-induced muscle cell atrophy and suggests that miR-497-5p is likely involved in a compensatory mechanism of muscle atrophy in response to IL-6.
Keywords: Interleukin-6; inflammation; microRNAs; muscle wasting.
Conflict of interest statement
The authors declare no conflict of interest.
Figures


Similar articles
-
MicroRNA 322 Aggravates Dexamethasone-Induced Muscle Atrophy by Targeting IGF1R and INSR.Int J Mol Sci. 2020 Feb 7;21(3):1111. doi: 10.3390/ijms21031111. Int J Mol Sci. 2020. PMID: 32046161 Free PMC article.
-
Specific miRNAs are associated with human cancer cachexia in an organ-specific manner.J Cachexia Sarcopenia Muscle. 2023 Jun;14(3):1381-1394. doi: 10.1002/jcsm.13224. Epub 2023 Apr 6. J Cachexia Sarcopenia Muscle. 2023. PMID: 37021483 Free PMC article.
-
Regulation of IRS1/Akt insulin signaling by microRNA-128a during myogenesis.J Cell Sci. 2013 Jun 15;126(Pt 12):2678-91. doi: 10.1242/jcs.119966. Epub 2013 Apr 19. J Cell Sci. 2013. PMID: 23606743 Free PMC article.
-
The Pathway to Cancer Cachexia: MicroRNA-Regulated Networks in Muscle Wasting Based on Integrative Meta-Analysis.Int J Mol Sci. 2019 Apr 22;20(8):1962. doi: 10.3390/ijms20081962. Int J Mol Sci. 2019. PMID: 31013615 Free PMC article. Review.
-
Regulation of muscle atrophy by microRNAs: 'AtromiRs' as potential target in cachexia.Curr Opin Clin Nutr Metab Care. 2018 Nov;21(6):423-429. doi: 10.1097/MCO.0000000000000503. Curr Opin Clin Nutr Metab Care. 2018. PMID: 30198917 Review.
Cited by
-
Role of noncoding RNAs in pancreatic ductal adenocarcinoma associated cachexia.Am J Physiol Cell Physiol. 2022 Dec 1;323(6):C1624-C1632. doi: 10.1152/ajpcell.00424.2022. Epub 2022 Oct 24. Am J Physiol Cell Physiol. 2022. PMID: 36280389 Free PMC article. Review.
-
The Role of Non-Coding RNAs in Regulating Cachexia Muscle Atrophy.Cells. 2024 Sep 27;13(19):1620. doi: 10.3390/cells13191620. Cells. 2024. PMID: 39404384 Free PMC article. Review.
-
miR-222 Is Involved in the Amelioration Effect of Genistein on Dexamethasone-Induced Skeletal Muscle Atrophy.Nutrients. 2022 Apr 29;14(9):1861. doi: 10.3390/nu14091861. Nutrients. 2022. PMID: 35565830 Free PMC article.
-
Muscle and Bone Defects in Metastatic Disease.Curr Osteoporos Rep. 2022 Oct;20(5):273-289. doi: 10.1007/s11914-022-00741-y. Epub 2022 Aug 22. Curr Osteoporos Rep. 2022. PMID: 35994202 Free PMC article. Review.
-
Epigenetics of Skeletal Muscle Atrophy.Int J Mol Sci. 2024 Jul 31;25(15):8362. doi: 10.3390/ijms25158362. Int J Mol Sci. 2024. PMID: 39125931 Free PMC article. Review.
References
-
- Gallagher I.J., Stephens N.A., MacDonald A.J., Skipworth R.J.E., Husi H., Greig C.A., Ross J.A., Timmons J.A., Fearon K.C.H. Suppression of skeletal muscle turnover in cancer cachexia: Evidence from the transcriptome in sequential human muscle biopsies. Clin. Cancer Res. 2012;18:2817–2827. doi: 10.1158/1078-0432.CCR-11-2133. - DOI - PubMed
Publication types
MeSH terms
Substances
Grants and funding
- 141919/2016-7 to PPF/National Council for Scientific and Technological Development
- PDSE 88881.187095/2018-01 to PPF/Coordenação de Aperfeicoamento de Pessoal de Nível Superior
- 311530/2019-2 to RFC/National Council for Scientific and Technological Development
- T32 HL007572/HL/NHLBI NIH HHS/United States
- #12/11666-7 to PPF/São Paulo Research Foundation
LinkOut - more resources
Full Text Sources
Miscellaneous
