. 2021 Dec 20;10(12):3593.
doi: 10.3390/cells10123593.

p66α Suppresses Breast Cancer Cell Growth and Migration by Acting as Co-Activator of p53

Affiliations

p66α Suppresses Breast Cancer Cell Growth and Migration by Acting as Co-Activator of p53

Qun Zhang et al. Cells. .

Abstract

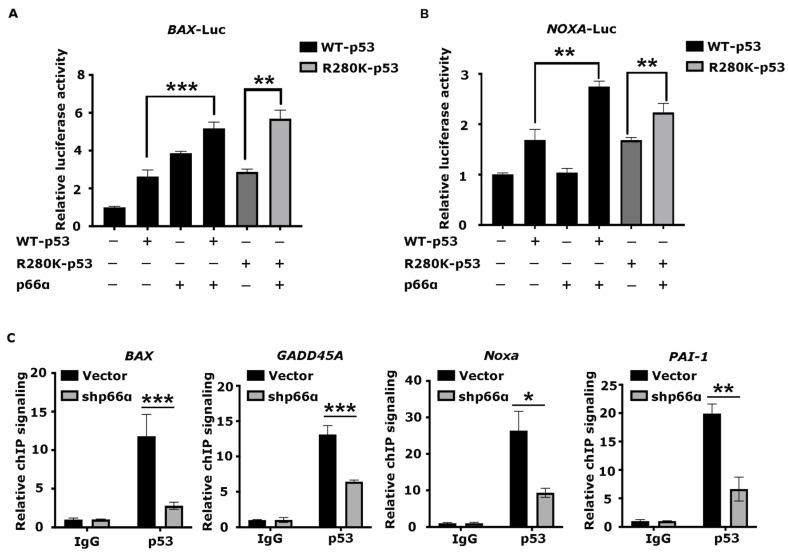
p66α is a GATA zinc finger domain-containing transcription factor that has been shown to be essential for gene silencing by participating in the NuRD complex. Several studies have suggested that p66α is a risk gene for a wide spectrum of diseases such as diabetes, schizophrenia, and breast cancer; however, its biological role has not been defined. Here, we report that p66α functions as a tumor suppressor to inhibit breast cancer cell growth and migration, evidenced by the fact that the depletion of p66α results in accelerated tumor growth and migration of breast cancer cells. Mechanistically, immunoprecipitation assays identify p66α as a p53-interacting protein that binds the DNA-binding domain of p53 molecule predominantly via its CR2 domain. Depletion of p66α in multiple breast cells results in decreased expression of p53 target genes, while over-expression of p66α results in increased expression of these target genes. Moreover, p66α promotes the transactivity of p53 by enhancing p53 binding at target promoters. Together, these findings demonstrate that p66α is a tumor suppressor by functioning as a co-activator of p53.

Keywords: breast cancer; cell growth; metastasis; migration; p53; p66α.


Conflict of interest statement

The authors declare no conflict of interest.

Figures

Figure 1
Figure 1
p66α inhibits breast cancer cell growth. (A) Kaplan-Meier plot of the relapse-free survival of patients with breast cancer stratified by p66α. (B) Western blot assays showed that p66α was effectively depleted in the MCF-7 cell line. (C) Cell growth curves of p66α knockdown MCF-7 cells and control cells. (D) Western blot assays showed that p66α was over-expressed in the MCF-7 cells. (E) Cell growth curves of MCF-7 cells overexpressing p66α or mock vector. (F) Western blot assays showed the depletion of p66α in the MDA-MB-231 cells. (G) The cell growth curves of p66α knockdown MDA-MB-231 cells and mock cells. (H) Western blot assays showed the expression of p66α in MDA-MB-231 cells. (I) The cell growth curves of MDA-MB-231 cells overexpressing p66α or mock control. (J) Tumor size of subcutaneous tumor formation assay. Knockdown of p66α in MDA-MB-231 cells promoted cell growth in vivo (n = 7). (K) statistical results of (J). * p < 0.05, ** p < 0.01, *** p < 0.001.
Figure 2
Figure 2
p66α suppresses breast cancer cell migration and metastasis. (A) Transwell assays demonstrated that knockdown p66α increased migration in MCF-7 cells (20×, scale bar: 100 μm). (B) Quantification analyses of cell migration abilities of p66α knockdown or vector MCF-7 cells. *** p < 0.001. (C) Transwell assays showed that an increase in p66α levels reduced migration in MCF-7 cells (20×, scale bar: 100 μm). (D) Quantification analyses of cell migration abilities of MCF-7 cells overexpressing p66α or vector. *** p < 0.001. (E) Depletion of p66α increased cell migration in MDA-MB-231 cells. (20×, scale bar: 100 μm). (F) Quantification analyses of cell migration abilities of p66α knockdown MDA-MB-231 cells. * p < 0.05. (G) Transwell assays showed that an increase in p66α levels reduced MDA-MB-231 cells migration (20×, scale bar: 100 μm). (H) Quantification analyses of cell migration abilities of MDA-MB-231 cells overexpressing p66α. *** p < 0.001. (I) MDA-MB-231-Luc cells stably expressing control vector or p66α shRNA were injected into the tail vein of female nude mice. Luciferase signal intensities of lung metastases in each group (n = 10) were recorded every two weeks. * p < 0.05. (J) Representative luciferase signal images of lung metastases at the sixth week. (K) Representative images of metastatic nodules in the lung. (L) H&E staining of lung tissue in nude mice, which were injected cells as indicated. The metastatic foci in the shp66α group were dramatically increased compared to the control group (10×, scale bar: 200 μm).
Figure 3
Figure 3
p66α directly binds the DNA-binding domain of p53. (A) The exogenously expressed Flag-p66α and GFP-p53 proteins interacted in HEK-293T cells. Immunoprecipitation was performed by using Flag M2 beads to enrich p66α, and Western blotting was probed with the anti-GFP antibody. (B) The exogenously expressed Flag-p53 and HA-p66α proteins interacted in HEK-293T cells. Immunoprecipitation was performed with Flag M2 beads to enrich p53, Western blotting was probed with the anti-HA antibody. (C) The exogenously expressed Flag-p66α and endogenous p53 proteins interacted in HEK293T cells. Immunoprecipitation was performed with Flag M2 beads, and Western blot was performed with monoclonal antip53 antibody. (D) Subcellular localization of p66α and p53 in HeLa cells. The plasmids encoding Flag-p66α and GFP-p53 were transiently transfected into HeLa cells, and the immunofluorescent images were taken with confocal microscopy. (E) Diagrams of full-length p66α and p66α deletion mutants. The CR1 and CR2 are the highly conserved regions in p66α. The CR2 domain contains a GATA-type zinc finger motif. (F) p53 mainly interacted with the CR2 domain of p66α, but there was also a weak interaction between p53 and CR1 domain. The asterisk “*” means nonspecific bands. (G) Diagrams of full-length p53 and p53 deletion mutants. (H) The region between 100 and 291 amino acid residues of p53 bound p66α. In vitro translated p66α protein was subjected to GST pulldown assays using the purified GST fusion p53 proteins.
Figure 4
Figure 4
p66α promotes the expression of transactivated p53 target genes via p53. (A) qRT-PCR assays verified the mRNA level of p66α in MCF-7 shVector and shp66α cells. (B) The repression of p66α decreased the mRNA level of p53 target genes in MCF-7 cells. *** p < 0.001. (C) qRT-PCR assays verified the mRNA level of p66α in Flag-p66α overexpressing MCF-7 cells. (D) Overexpression of p66α increased the mRNA levels of p53 downstream genes in MCF-7 cells. ** p < 0.01, *** p < 0.001. (E) Western blot assays verified the protein levels of p53, p66α in p66α overexpressing MCF-7 cells after the depression of p53. (F) qRT-PCR assays of the mRNA level of p53 downstream genes after the depression of p53 in p66α overexpressing MCF-7 cells. “ns” indicates no significant difference (p > 0.05). (G) qRT-PCR assays verified the mRNA level of p66α in MDA-MB-231 shVector and shp66α cells. (H) Repression of p66α decreased the mRNA level of p53 downstream genes in MDA-MB-231 cells. ** p < 0.01, *** p < 0.001. (I) qRT-PCR assays verified the mRNA level of p66α in MDA-MB-231 Flag-p66α overexpressing cells. (J) Overexpressing p66α induced the mRNA level of p53 downstream genes. *** p < 0.001. (K) Western blot assays verified the protein levels of p53, p66α in p66α overexpressing MDA-MB-231cells after the depression of p53. (L) qRT-PCR assays of the mRNA level of p53 downstream genes after the depression of p53 in p66α overexpressing MDA-MB-231 cells. “ns” indicates no significant difference (p > 0.05). All data were shown as mean ± S.D. from three independent experiments.
Figure 5
Figure 5
p66α promotes the transactivity of p53 by enhancing p53 binding at target promoters (A) Luciferase assays were performed in HEK-293T cells knocking down of p53. The value was normalized to β-gal. Both p53WT and p53R280K synergistically worked with p66α to transactivate the BAX promoter. (B) Luciferase assays showed that both p53WT and p53R280K synergistically worked with p66α to transactivate the NOXA promoter. (C) ChIP assays were performed in MDA-MB-231-shp66α and shVector cells using an antibody specific to p53. The enriched DNA fragments were amplified by qRT-PCR assays. * p < 0.05, ** p < 0.01, *** p < 0.001. All data were shown as mean ± S.D. from three independent experiments.
Figure 6
Figure 6
High expression of p66α and p53 is positively correlated with and predicts a good prognosis in breast cancer. (A) Kaplan-Meier plot of the relapse-free survival of patients with breast cancer in whole data sets stratified by p53 expression. (B) Scatter plot showed that p66α and p53 were positively correlated in breast cancer. The p value was calculated via Pearson’s ranking correlation coefficient analysis. BRCA: breast invasive carcinoma (TCGA database). TPM: Transcripts Per Kilobase of exon per Million mapped reads. (C) Schematic model for p66α mediated p53 transactivating genes expression. p66α interacted with p53 and promoted the transcriptional activation ability of p53 by enhancing p53 binding in target promoters, including genes that control cell growth, such as BAX, GADD45A, and NOXA, and that control cell migration such as PAI-1.

Similar articles

Cited by

References

    1. Brackertz M., Boeke J., Zhang R., Renkawitz R. Two highly related p66 proteins comprise a new family of potent transcriptional repressors interacting with MBD2 and MBD3. J. Biol. Chem. 2002;277:40958–40966. doi: 10.1074/jbc.M207467200. - DOI - PubMed
    1. Eom K.S., Cheong J.S., Lee S.J. Structural Analyses of Zinc Finger Domains for Specific Interactions with DNA. J. Microbiol. Biotechnol. 2016;26:2019–2029. doi: 10.4014/jmb.1609.09021. - DOI - PubMed
    1. Miller J., McLachlan A.D., Klug A. Repetitive zinc-binding domains in the protein transcription factor IIIA from Xenopus oocytes. EMBO J. 1985;4:1609–1614. doi: 10.1002/j.1460-2075.1985.tb03825.x. - DOI - PMC - PubMed
    1. Schulz R.A. GATA transcription factors in heart and blood cell development and disease. Semin. Cell Dev. Biol. 2005;16:69. doi: 10.1016/j.semcdb.2004.11.003. - DOI - PubMed
    1. Patient R.K., McGhee J.D. The GATA family (vertebrates and invertebrates) Curr. Opin. Genet. Dev. 2002;12:416–422. doi: 10.1016/S0959-437X(02)00319-2. - DOI - PubMed

Publication types

MeSH terms

Substances