. 2021 Nov 30;11(12):1794.
doi: 10.3390/biom11121794.

Exploring the Value of BRD9 as a Biomarker, Therapeutic Target and Co-Target in Prostate Cancer

Affiliations

Exploring the Value of BRD9 as a Biomarker, Therapeutic Target and Co-Target in Prostate Cancer

Nafisa Barma et al. Biomolecules. .

Abstract

Background and aims: Despite recent advances in advanced prostate cancer treatments, clinical biomarkers or treatments for men with such cancers are imperfect. Targeted therapies have shown promise, but there remain fewer actionable targets in prostate cancer than in other cancers. This work aims to characterise BRD9, currently understudied in prostate cancer, and investigate its co-expression with other genes to assess its potential as a biomarker and therapeutic target in human prostate cancer.

Materials and methods: Omics data from a total of 2053 prostate cancer patients across 11 independent datasets were accessed via Cancertool and cBioPortal. mRNA M.expression and co-expression, mutations, amplifications, and deletions were assessed with respect to key clinical parameters including survival, Gleason grade, stage, progression, and treatment. Network and pathway analysis was carried out using Genemania, and heatmaps were constructed using Morpheus.

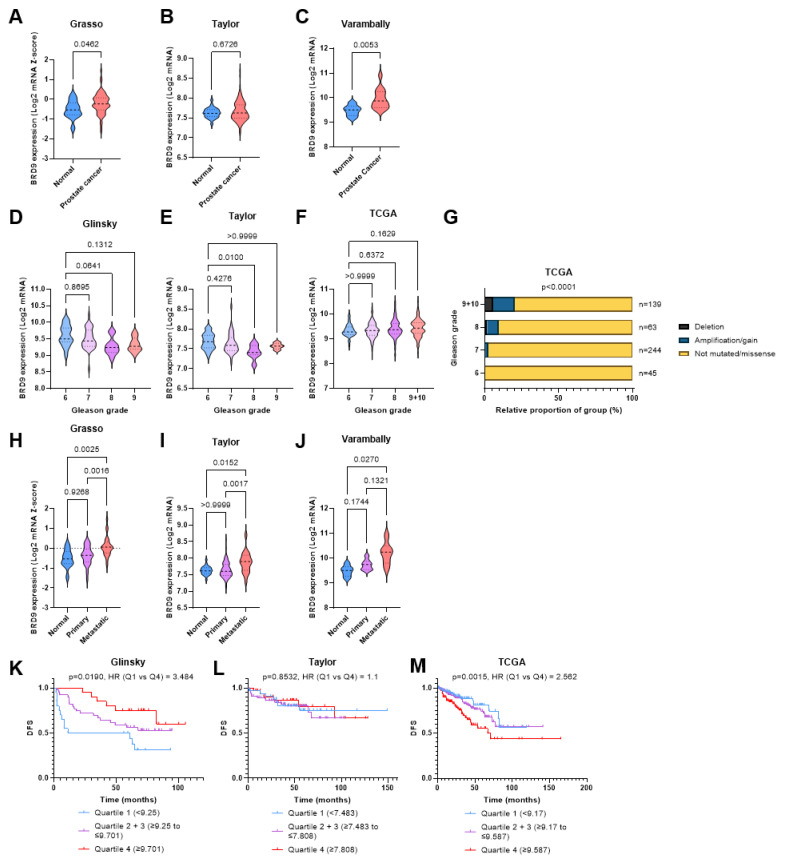
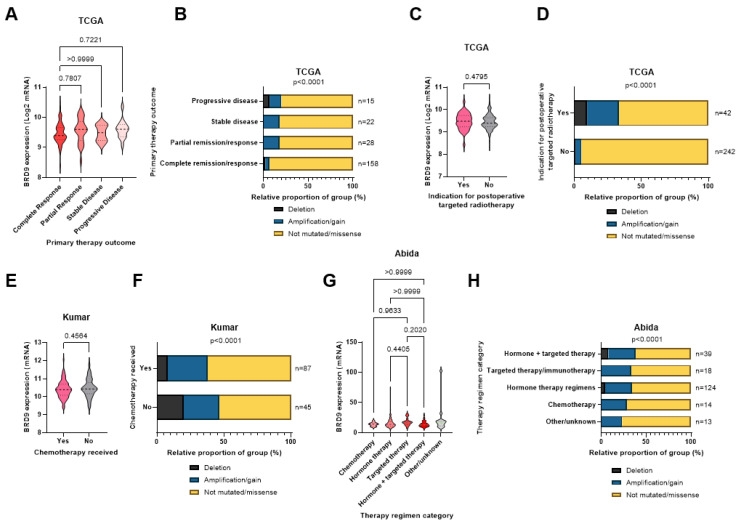
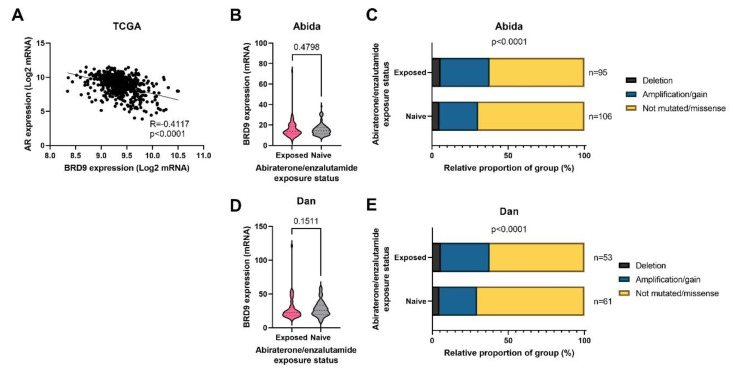
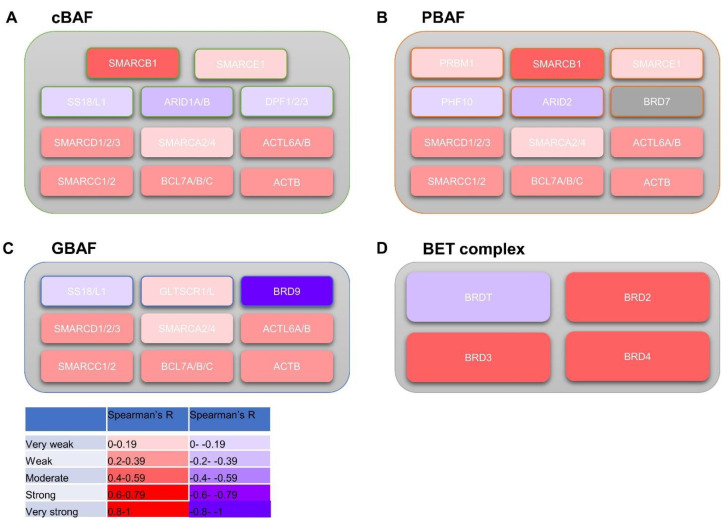
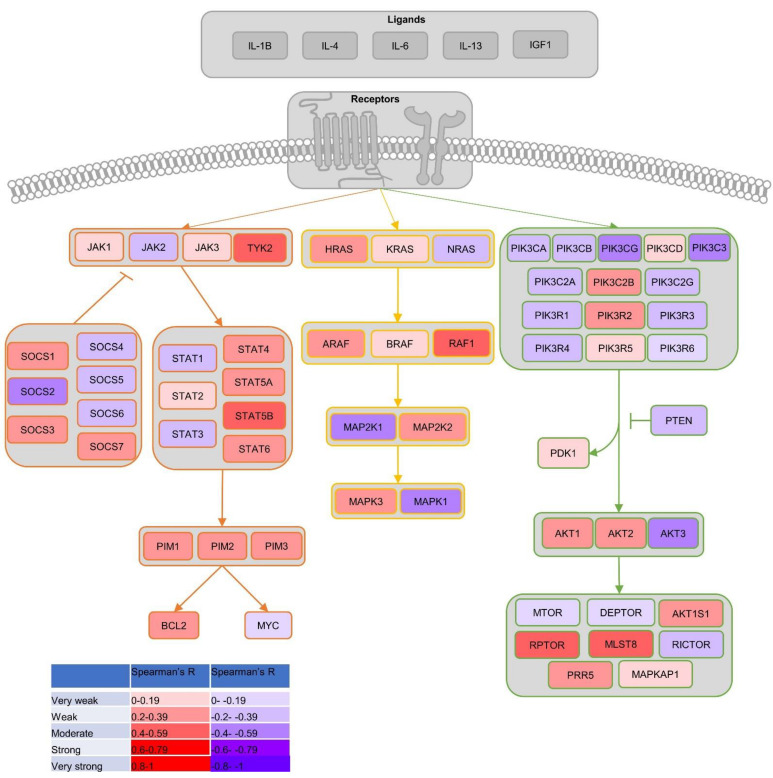
Results: BRD9 is overexpressed in prostate cancer patients, especially those with metastatic disease. BRD9 expression did not differ in patients treated with second generation antiandrogens versus those who were not. BRD9 is co-expressed with many genes in the SWI/SNF and BET complexes, as well as those in common signalling pathways in prostate cancer.

Summary and conclusions: BRD9 has potential as a diagnostic and prognostic biomarker in prostate cancer. BRD9 also shows promise as a therapeutic target, particularly in advanced prostate cancer, and as a co-target alongside other genes in the SWI/SNF and BET complexes, and those in common prostate cancer signalling pathways. These promising results highlight the need for wider experimental inhibition and co-targeted inhibition of BRD9 in vitro and in vivo, to build on the limited inhibition data available.

Keywords: BRD9; SWI/SNF; prostate cancer; targeted therapy.


Conflict of interest statement

The authors declare no conflict of interest.

Figures

Figure 1
Figure 1
BRD9 as a diagnostic and prognostic biomarker in cancer omics cohorts. (A) Violin plot showing BRD9 expression in normal and PCa patients in the Grasso cohort. p-value was obtained using Welch’s t-test. (B) Violin plot showing BRD9 expression in normal and PCa patients in the Taylor cohort. p-value was obtained using Mann-Whitney U test. (C) Violin plot showing BRD9 expression in normal and PCa patients in the Varambally cohort. p-value was obtained using Welch’s t-test. (D) Violin plot showing how BRD9 expression varies with Gleason grade in the Glinsky cohort. p-values were obtained using Dunnett’s T3 post-hoc test. (E) Violin plot showing how BRD9 expression varies with Gleason grade in the Taylor cohort. p-values were obtained using Dunn’s post-hoc test. (F) Violin plot showing how BRD9 expression varies with Gleason grade in the TCGA cohort. p-values were obtained using Dunnett’s T3 post-hoc test. (G) Stacked bar chart showing BRD9 mutation distribution at different Gleason grades and the number of patients at each grade in the TCGA cohort. p-value was obtained via Fisher’s exact test using the Monte Carlo simulation. Grades 9 and 10 have been combined due to an n = 4 sample size at grade 10. (H) Violin plot showing how BRD9 expression varies with cancer progression in the Grasso cohort. p-values were obtained using Dunn’s post-hoc test. (I) Violin plot showing how BRD9 expression varies with cancer progression in the Taylor cohort. p-values were obtained using Dunn’s post-hoc test. (J) Violin plot showing how BRD9 expression varies with cancer progression in the Varambally cohort. p-values were obtained using Dunnett’s T3 post-hoc test. (K) DFS shown via KM survival curve in the Glinsky cohort. p value was obtained from a Mantel-Cox test and HR was calculated from a cox regression model by comparing the highest and lowest quartiles of BRD9 expression. (L) DFS shown via KM survival curve in the Taylor cohort. p value was obtained from a Mantel-Cox test and HR was calculated from a cox regression model by comparing the highest and lowest quartiles of BRD9 expression. (M) DFS shown via KM survival curve in the TCGA cohort. p value was obtained from a Mantel-Cox test and HR was calculated from a cox regression model by comparing the highest and lowest quartiles of BRD9 expression. Gleason grade (1–5) increases with more aggressive and less well-differentiated cancer. Overall grade (6–10) is the sum score of the two most prevalent grades in the sample. Y axis scales on violin plots vary due to experimental variation.
Figure 2
Figure 2
BRD9 as a predictive biomarker in PCa in cancer omics cohorts. (A) Violin plot showing how BRD9 expression varies with primary therapy outcome in the TCGA cohort. p-values were obtained using Dunn’s post-hoc test. (B) Stacked bar chart showing BRD9 mutation distribution across primary therapy outcomes and the number of patients in each sample in the TCGA cohort. p-value was obtained via Fisher’s exact test using the Monte Carlo simulation. (C) Violin plot showing BRD9 expression in patients indicated for adjuvant radiotherapy (left) and those who were not (right) in the TCGA cohort. p-value was obtained using a Mann Whitney U test. (D) Stacked bar chart showing BRD9 mutation distribution in patients who were and were not indicated for adjuvant radiotherapy and the number of patients in each sample in the TCGA cohort. p-value was obtained using Fisher’s exact test. (E) Violin plot showing BRD9 expression in patients who received chemotherapy (left) and those who did not (right) in the Kumar cohort. p-value was obtained using a Mann Whitney U test. (F) Stacked bar chart showing BRD9 mutation distribution in patients who did and did not receive chemotherapy and the number of patients in each sample in the Kumar cohort. p-value was obtained via Fisher’s exact test using the Monte Carlo simulation. (G) Violin plot showing how BRD9 expression varies with therapy regimen in the Abida cohort. p-values were obtained using Dunn’s post-hoc test. (H) Stacked bar chart showing BRD9 mutation distribution in patients across therapy regimens the number of patients in each sample in the TCGA cohort. p-value was obtained using Fisher’s exact test. Regimen categories were combined as above due to small sample sizes (n) of various individual regimens. Y axis scales on violin plots vary due to experimental variation.
Figure 3
Figure 3
BRD9 as a potential drug target in CRPC in cancer omics cohorts. (A) Scatterplot with line of best fit showing the correlation between BRD9 and AR expression in the TCGA cohort. Spearman’s R and its associated two-tailed p-value have been calculated. (B) Violin plot showing BRD9 expression in who patients were and were not treated with the second generation antiandrogens abiraterone and enzalutamide in the Abida cohort. p-value was obtained using a Mann Whitney U test. (C) Stacked bar chart showing BRD9 mutation distribution in patients who were and were not treated with the second generation antiandrogens abiraterone and enzalutamide and the number of patients in each sample in the Abida cohort. p-value was obtained using Fisher’s exact test. (D) Violin plot showing BRD9 expression in who patients were and were not treated with the second generation antiandrogens abiraterone and enzalutamide in the Dan cohort. p-value was obtained using a Mann Whitney U test. (E) Stacked bar chart showing BRD9 mutation distribution in patients who were and were not treated with the second generation antiandrogens abiraterone and enzalutamide and the number of patients in each sample in the Dan cohort. p-value was obtained using Fisher’s exact test. Y axis scales on violin plots vary due to experimental variation.
Figure 4
Figure 4
An overview of BRD9 correlation with genes composing the SWI/SNF and BET complexes. Heatmap diagrams showing mean significant Spearman’s R BRD9 correlation from datasets with gene subunits composing SWI/SNF subcomplexes (cBAF, PBAF, GBAF) and BET complex. (A) Heatmap diagram showing mean significant Spearman’s R BRD9 correlation from datasets with gene subunits composing the cBAF subcomplex. (B) Heatmap diagram showing mean significant Spearman’s R BRD9 correlation from datasets with gene subunits composing the PBAF subcomplex. (C) Heatmap diagram showing mean significant Spearman’s R BRD9 correlation from datasets with gene subunits composing the GBAF subcomplex. SWI/SNF diagrams adapted from Centore et al.’s Figure 1 [15]. Image created using Microsoft PowerPoint. (D) Heatmap diagram showing mean significant Spearman’s R BRD9 correlation from datasets with gene subunits composing the BET complex.
Figure 5
Figure 5
An overview of BRD9 correlation with common signalling pathways involved in PCa. Flowchart signalling pathway diagram/heatmap showing mean significant Spearman’s R BRD9 correlation from datasets with genes in the JAK-STAT, MAPK and PI3K-AKT-mTOR signalling pathways. Adapted and expanded from Luzczak et al.’s Figure 2 [57]. Image created using Microsoft PowerPoint.
Figure 6
Figure 6
The potential of ERG as a co-target with BRD9. (A) Gene network map showing the associations between BRD9 and ERG. (B) Scatterplot with line of best fit showing the correlation between BRD9 and ERG expression in the TCGA cohort. (C) Violin plot showing BRD9 expression in who patients were ERG (TMPRSS2-ETS fusion) positive (right) and negative (left) in the Barbieri cohort. p-value was obtained using a Mann Whitney U test. (D) Violin plot showing BRD9 expression in who patients were ERG positive (right) and negative (left) in the Gerhauser cohort. p-value was obtained using a Mann Whitney U test. (E) Violin plot showing BRD9 expression in who patients were ERG positive (right) and negative (left) in the Taylor cohort. p-value was obtained using a Mann Whitney U test. (F) Violin plot showing BRD9 expression in who patients were ERG positive (right) and negative (left) in the Abida cohort. p-value was obtained using a Mann Whitney U test. (G) Stacked bar chart showing BRD9 mutation distribution in patients who were ERG positive and negative and the number of patients in each sample in the Abida cohort. p-value was obtained using Fisher’s exact test. Y axis scales on violin plots vary due to experimental variation. Gene network map created using https://genemania.org/. (accessed on 19 April 2021).

References

    1. Rawla P. Epidemiology of Prostate Cancer. World J. Oncol. 2019;10:63–89. doi: 10.14740/wjon1191. - DOI - PMC - PubMed
    1. Bray F., Ferlay J., Soerjomataram I., Siegel R.L., Torre L.A., Jemal A. Global cancer statistics 2018: GLOBOCAN estimates of incidence and mortality worldwide for 36 cancers in 185 countries. CA Cancer J. Clin. 2018;68:394–424. doi: 10.3322/caac.21492. - DOI - PubMed
    1. Prostate Cancer UK About Prostate Cancer. [(accessed on 19 April 2021)]. Available online: https://prostatecanceruk.org/prostate-information/about-prostate-cancer.
    1. Prostate Cancer UK Prostate Cancer UK’s Best Practice Pathway TREATMENT. Prostate Cancer UK, 2019. [(accessed on 19 April 2021)]. Available online: https://prostatecanceruk.org/media/1fknrpz5/treatmentpathwaypathwaycomme....
    1. NICE Information about PSA Testing. [(accessed on 19 April 2021)]. Available online: https://cks.nice.org.uk/topics/prostate-cancer/diagnosis/psa-testing/#:~....

MeSH terms