. 2021 Dec 3;9(12):1827.
doi: 10.3390/biomedicines9121827.

Repetitive Trans Spinal Magnetic Stimulation Improves Functional Recovery and Tissue Repair in Contusive and Penetrating Spinal Cord Injury Models in Rats

Affiliations

Repetitive Trans Spinal Magnetic Stimulation Improves Functional Recovery and Tissue Repair in Contusive and Penetrating Spinal Cord Injury Models in Rats

Amandine Robac et al. Biomedicines. .

Abstract

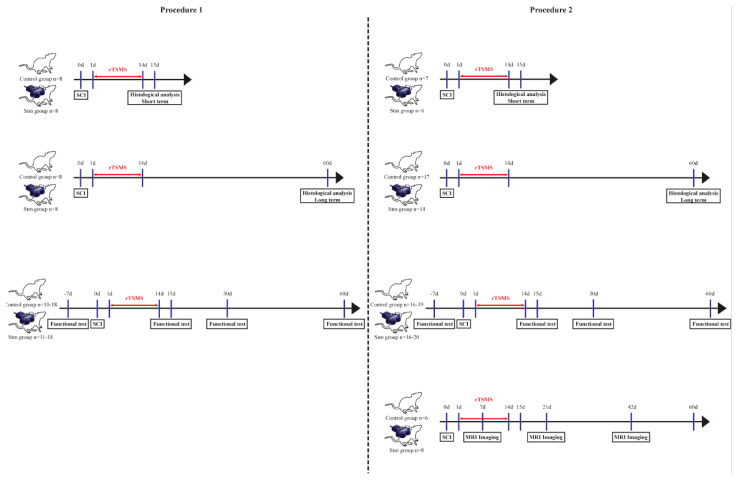
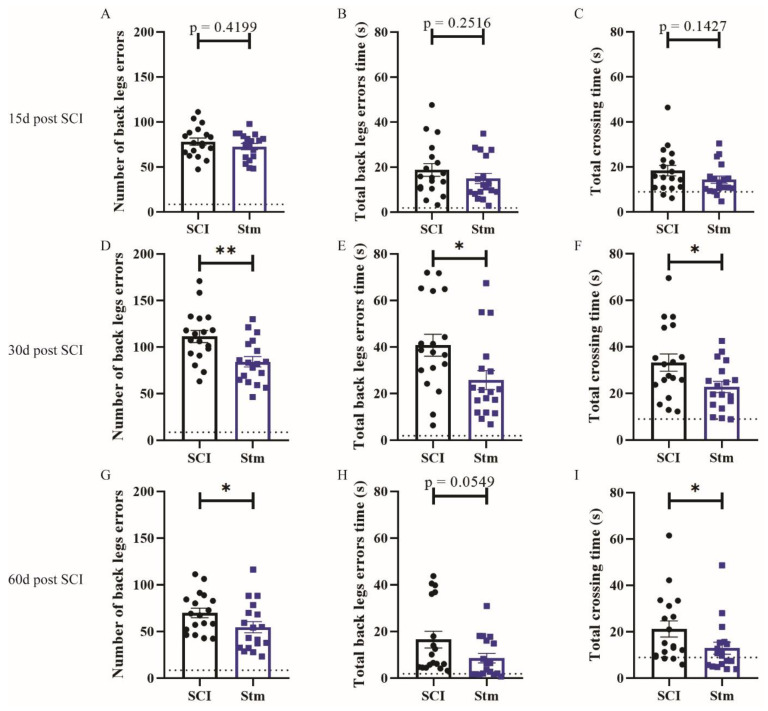
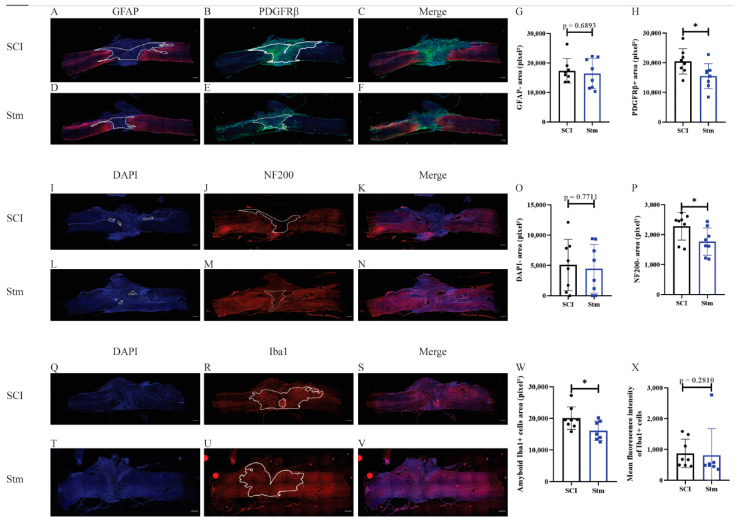
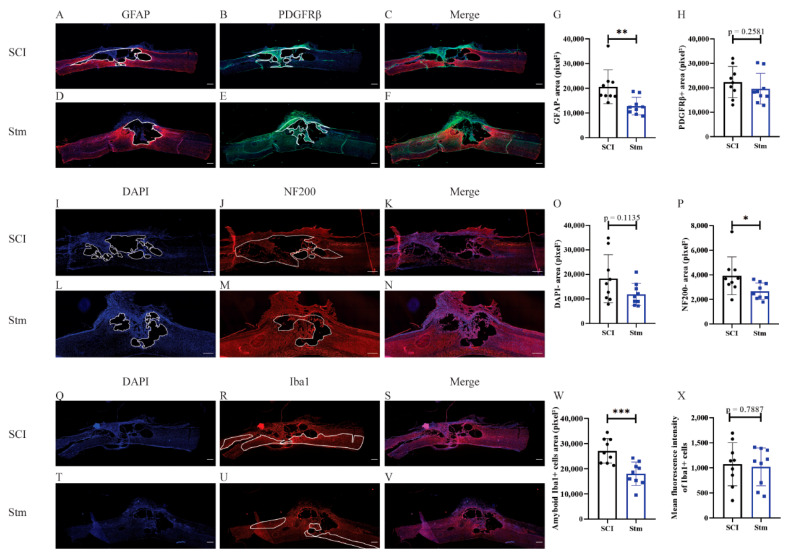
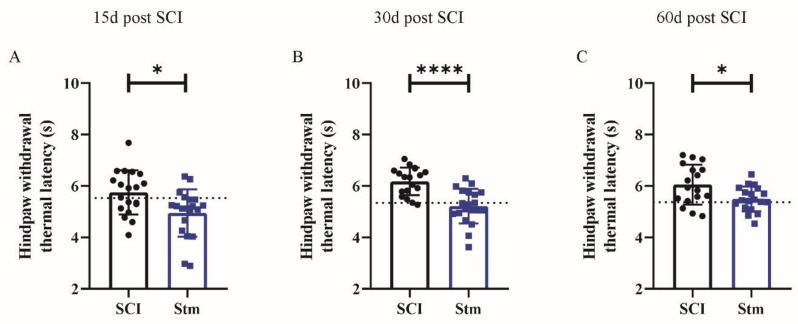
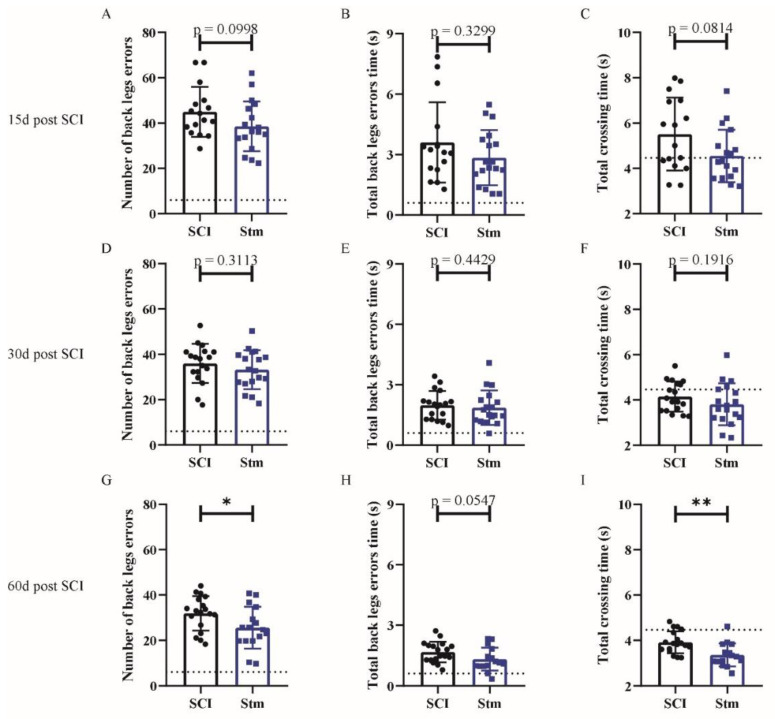
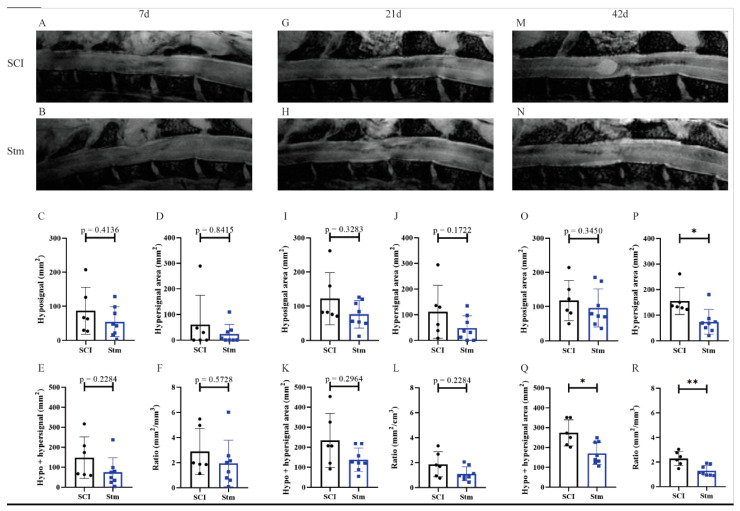
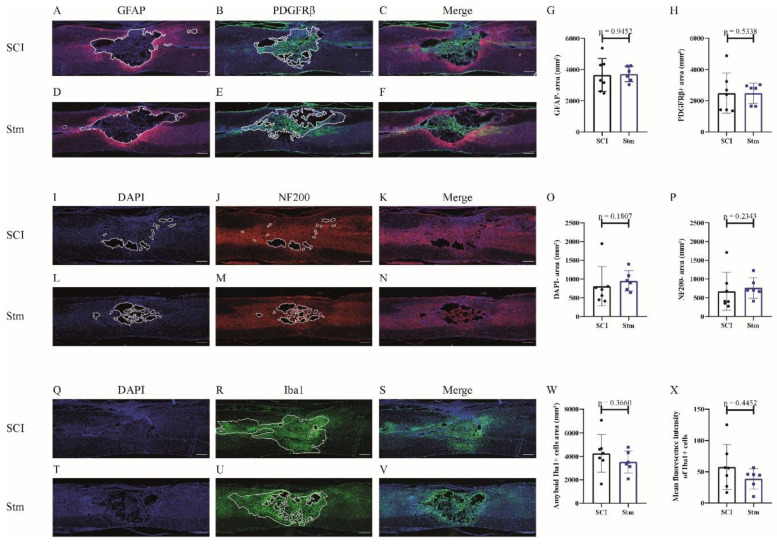
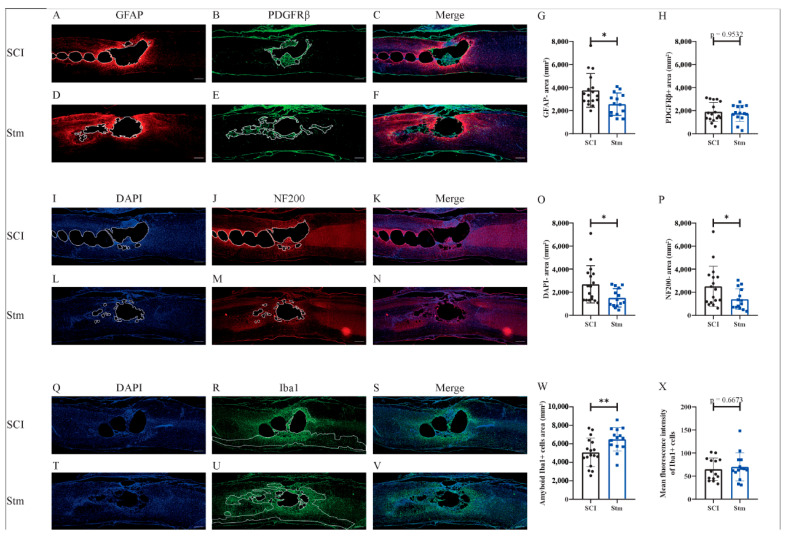
Spinal cord injury (SCI) is an incurable condition in which the brain is disconnected partially or completely from the periphery. Mainly, SCIs are traumatic and are due to traffic, domestic or sport accidents. To date, SCIs are incurable and, most of the time, leave the patients with a permanent loss of sensitive and motor functions. Therefore, for several decades, researchers have tried to develop treatments to cure SCI. Among them, recently, our lab has demonstrated that, in mice, repetitive trans-spinal magnetic stimulation (rTSMS) can, after SCI, modulate the lesion scar and can induce functional locomotor recovery non-invasively. These results are promising; however, before we can translate them to humans, it is important to reproduce them in a more clinically relevant model. Indeed, SCIs do not lead to the same cellular events in mice and humans. In particular, SCIs in humans induce the formation of cystic cavities. That is why we propose here to validate the effects of rTSMS in a rat animal model in which SCI leads to the formation of cystic cavities after penetrating and contusive SCI. To do so, several techniques, including immunohistochemical, behavioral and MRI, were performed. Our results demonstrate that rTSMS, in both SCI models, modulates the lesion scar by decreasing the formation of cystic cavities and by improving axonal survival. Moreover, rTSMS, in both models, enhances functional locomotor recovery. Altogether, our study describes that rTSMS exerts positive effects after SCI in rats. This study is a further step towards the use of this treatment in humans.

Keywords: cystic cavities and functional recovery; glial scar; magnetic stimulation; rehabilitation; spinal cord injury.


Conflict of interest statement

The authors declare that they have no competing interests.

Figures

Figure 1
Figure 1
Experimental paradigms illustrating the timelines of the major experimental manipulations.
Figure 2
Figure 2
rTSMS treatment induces locomotor recovery after a complete transection of the spinal cord in rats. Quantification of locotronic evaluation at (AC) 15 days, (DF) 30 days and (GI) 60 days after SCI. Parameters are (A,D,G) number of back-legs errors, (B,E,H) total back-legs errors’ time and (C,F,I) total crossing time. Quantifications are expressed as average ± SD; n = 18 animals per group. Dashed lines correspond to the baseline parameters obtained during locotronic habituation (7 days before SCI). Quantifications are expressed as average ± SD. Statistical evaluations are based on the Mann–Whitney test (* = p < 0.05 and ** = p < 0.01).
Figure 3
Figure 3
rTSMS treatment enhances tissue repair after a complete transection of the spinal cord 15 days after SCI in rats. At day 15, immunohistological analyses were performed. (AF,IN,QV) Representative pictures of sagittal spinal cord sections of (AC,IK,QS) SCI and (DF,LN,TV) Stm (rTSMS treated) animals. Sections were stained with (A,D) GFAP, (B,E) PDGFRβ, (I,L,Q,T) DAPI, (J,M) NF200 and (R,U) Iba1. (G) Quantification of astrocytic-negative area (GFAP-). (H) Quantification of fibrosis-positive area (PDGFRβ+). (O) Quantification of DAPI-negative area (DAPI-). (P) Quantification of NF200-negative area (NF200-). (W) Quantification of Iba1-amyboid-positive cells’ area (Iba1+) and (X) quantification of Iba1+ mean fluorescence intensity. Scale bars are 200 µm; n = 8 animals per group. Quantifications are expressed as average ± SD. Statistical evaluations are based on the Mann–Whitney test (* = p < 0.05).
Figure 4
Figure 4
rTSMS treatment enhances tissue repair after a complete transection of the spinal cord 60 days after SCI in rats. At day 60, immunohistological analyses were performed. (AF,IN,QT,U,V) Representative pictures of sagittal spinal cord sections of (AC,IK,QS) SCI and (DF,LN,TV) Stm (rTSMS treated) animals. Sections were stained with (A and D) GFAP, (B and E) PDGFRβ, (I,L,Q,T) DAPI, (J,M) NF200 and (R,U) Iba1. (G) Quantification of astrocytic-negative area (GFAP-). (H) Quantification of fibrosis-positive area (PDGFRβ+). (O) Quantification of DAPI-negative area (DAPI-). (P) Quantification of NF200-negative area (NF200-). (W) Quantification of Iba1 amyboid-positive cells’ area (Iba1+) and (X) quantification of Iba1+ mean fluorescence intensity. Scale bars are 200 µm; n = 8 animals per group. Quantifications are expressed as average ± SD. Statistical evaluations are based on the Mann–Whitney test (* = p < 0.05, ** = p < 0.01 and *** = p < 0.001).
Figure 5
Figure 5
rTSMS treatment modulate sensitive recovery after SCI in rats. Quantification of hindpaw withdrawal thermal latency at (A) 15 days, (B) 30 days and (C) 60 days after SCI. Quantifications are expressed as average ± SD; n = 19 animals per SCI group and n = 20 animals per STM group at 15 days, n = 18 animals per SCI group and n = 20 animals per STM group at 30 days and n = 17 animals per SCI group and n = 19 animals per Stm group 60 days after SCI. Dashed lines correspond to the baseline parameters obtained with non-injured animals. Statistical evaluations were based on the Mann–Whitney test (* = p < 0.05 and **** = p < 0.0001).
Figure 6
Figure 6
rTSMS treatment induces locomotor recovery after contusive SCI in rats. Quantification of locotronic evaluation at (AC) 15 days, (DF) 30 days and (GI) 60 days after SCI. Parameters are (A,D,G) number of back-leg errors, (B,E,H) total back-leg errors’ time and (C,F,I) total crossing time. Quantifications are expressed as average ± SD; n = 16 animals per SCI group and n = 18 animals per Stm group at 15 days, n = 18 animals per SCI group and n = 18 animals per Stm group at 30 days and n = 18 animals per SCI group and n = 16 animals per Stm group 60 days after SCI. Dashed lines correspond to the baseline parameters obtained during locotronic habituation (7 days before SCI). Quantifications are expressed as average ± SD. Statistical evaluations are based on the Mann–Whitney test (* = p < 0.05 and ** = p < 0.01).
Figure 7
Figure 7
MRI analyses show that rTSMS treatment decreases cystic cavities and increases spinal cord spared tissue. At (AF) 7, (GL) 21 and (MR) 42 days, MRI experiments were performed. Representative images of sagittal spinal cord sections recorded with MRI of (A,G,M) SCI and (B,H,N) Stm (rTSMS treated) animals. Quantification of hyposignal area (C) 7, (I) 14 and (O) 42 days after SCI. Quantification of hypersignal area (D) 7, (J) 14 and (P) 42 days after SCI. Quantification of hypo + hypersignal area (E) 7, (K) 14 and (Q) 42 days after SCI. Quantification of ratio lesioned tissue (F) 7, (L) 14 and (R) 42 days after SCI; n = 6 animals per control group and n= 8 per Stm group. Quantifications are expressed as average ± SD. Statistical evaluations are based on the Mann–Whitney test (* = p < 0.05 and ** = p < 0.01).
Figure 8
Figure 8
rTSMS treatment does not have effect on tissue repair after contusive SCI in rats 15 days after SCI. At day 15, immunohistological analyses were performed. (AV) Representative pictures of sagittal spinal cord sections of (AC,IK,QS) SCI and (DF,LN,TV) Stm (rTSMS treated) animals. Sections were stained with (A,D) GFAP, (B,E) PDGFRβ, (I,L,Q,T) DAPI, (J,M) NF200 and (R and U) Iba1. (G) Quantification of astrocytic-negative area (GFAP-). (H) Quantification of fibrosis-positive area (PDGFRβ+). (O) Quantification of DAPI-negative area (DAPI-). (P) Quantification of NF200-negative area (NF200-). (W) Quantification of Iba1-amyboid-positive cells’ area (Iba1+) and (X) quantification of Iba1+ mean fluorescence intensity. Scale bars are 200 µm; n = 7 animals per SCI group and n = 6 animals per Stm group. Quantifications are expressed as average ± SD. Statistical evaluations are based on the Mann–Whitney test.
Figure 9
Figure 9
rTSMS treatment enhances tissue repair after contusive SCI in rats 60 days after SCI. At day 60, immunohistological analyses were performed. (AF,IN,QV) Representative pictures of sagittal spinal cord sections of (AC,IK,QS) SCI and (DF,LN,TV) Stm (rTSMS treated) animals. Sections were stained with (A,D) GFAP, (B,E) PDGFRβ, (I,L,Q,T) DAPI, (J,M) NF200 and (R,U) Iba1. (G) Quantification of astrocytic-negative area (GFAP-). (H) Quantification of fibrosis-positive area (PDGFRβ+). (O) Quantification of DAPI-negative area (DAPI-). (P) Quantification of NF200-negative area (NF200-). (W) Quantification of Iba1-amyboid-positive cells’ area (Iba1+) and (X) quantification of Iba1+ mean fluorescence intensity. Scale bars are 200 µm; n = 17 animals per SCI group and n = 14 per Stm group. Quantifications are expressed as average ± SD. Statistical evaluations are based on the Mann–Whitney test (* = p < 0.05 and ** = p < 0.01).

References

    1. Guérout N. Plasticity of the injured spinal cord. Cells. 2021;10:1886. doi: 10.3390/cells10081886. - DOI - PMC - PubMed
    1. Hejrati N., Fehlings M.G. A review of emerging neuroprotective and neuroregenerative therapies in traumatic spinal cord injury. Curr. Opin. Pharmacol. 2021;60:331–340. doi: 10.1016/j.coph.2021.08.009. - DOI - PubMed
    1. Brockie S., Hong J., Fehlings M.G. The role of microglia in modulating neuroinflammation after spinal cord injury. Int. J. Mol. Sci. 2021;22:9706. doi: 10.3390/ijms22189706. - DOI - PMC - PubMed
    1. Grégoire C.-A., Goldenstein B.L., Floriddia E.M., Barnabé-Heider F., Fernandes K.J.L. Endogenous neural stem cell responses to stroke and spinal cord injury. Glia. 2015;63:1469–1482. doi: 10.1002/glia.22851. - DOI - PubMed
    1. Göritz C., Dias D.O., Tomilin N., Barbacid M., Shupliakov O., Frisén J. A pericyte origin of spinal cord scar tissue. Science. 2011;333:238–242. doi: 10.1126/science.1203165. - DOI - PubMed

LinkOut - more resources