. 2021 Dec 9;13(24):6202.
doi: 10.3390/cancers13246202.

Loss of microRNA-135b Enhances Bone Metastasis in Prostate Cancer and Predicts Aggressiveness in Human Prostate Samples

Affiliations

Loss of microRNA-135b Enhances Bone Metastasis in Prostate Cancer and Predicts Aggressiveness in Human Prostate Samples

Mireia Olivan et al. Cancers (Basel). .

Abstract

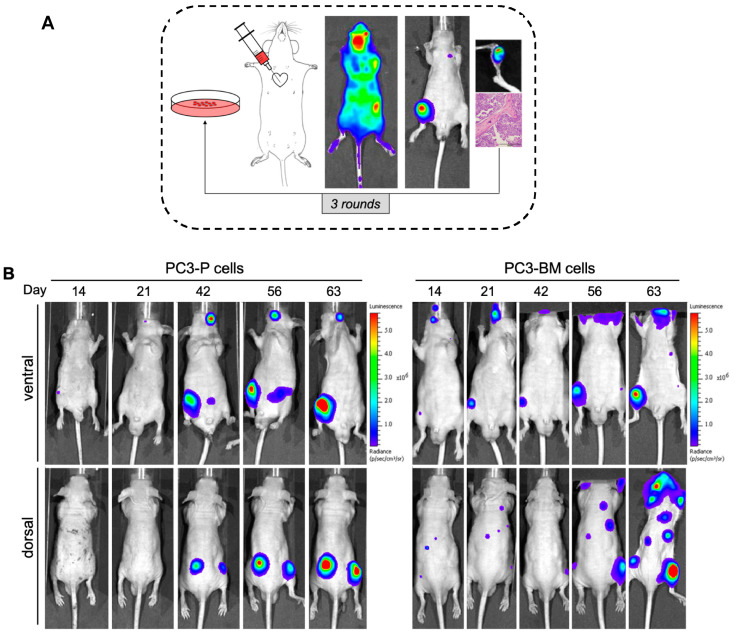
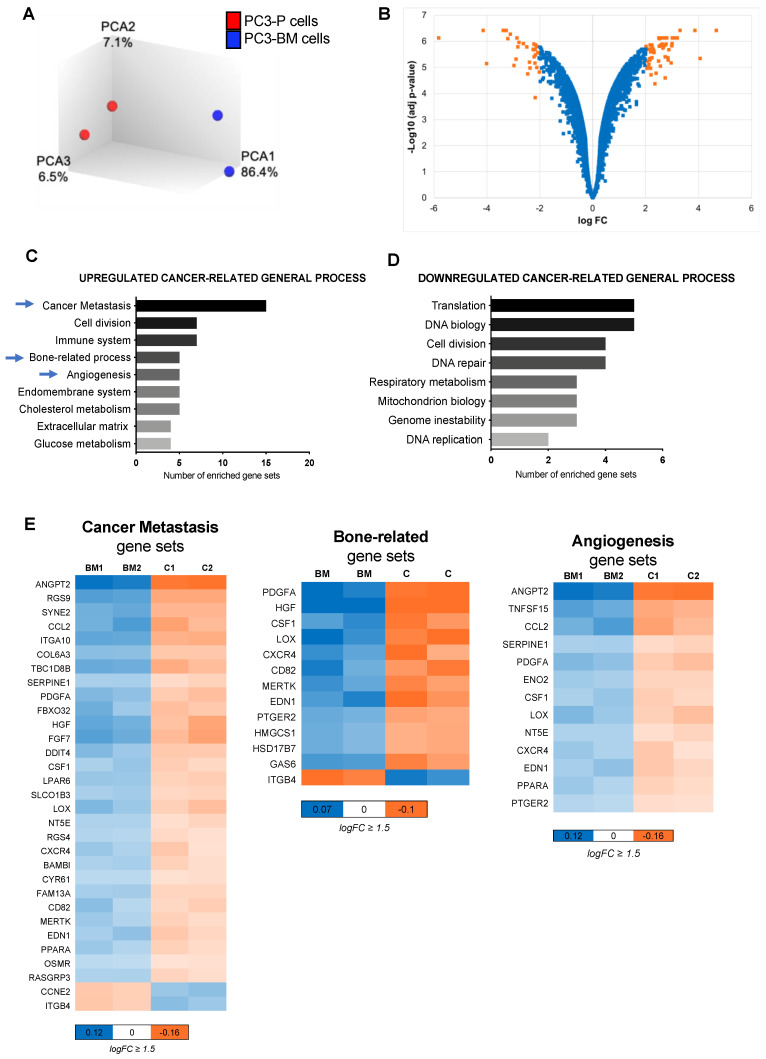
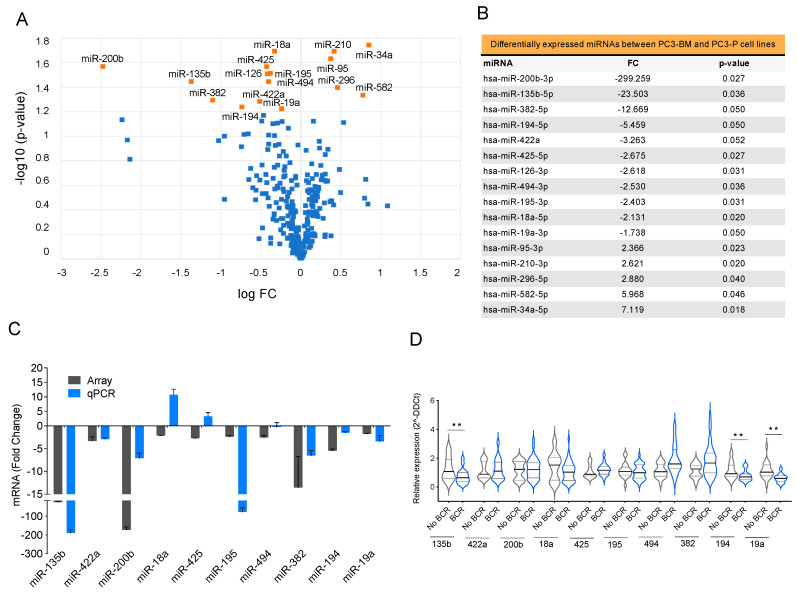
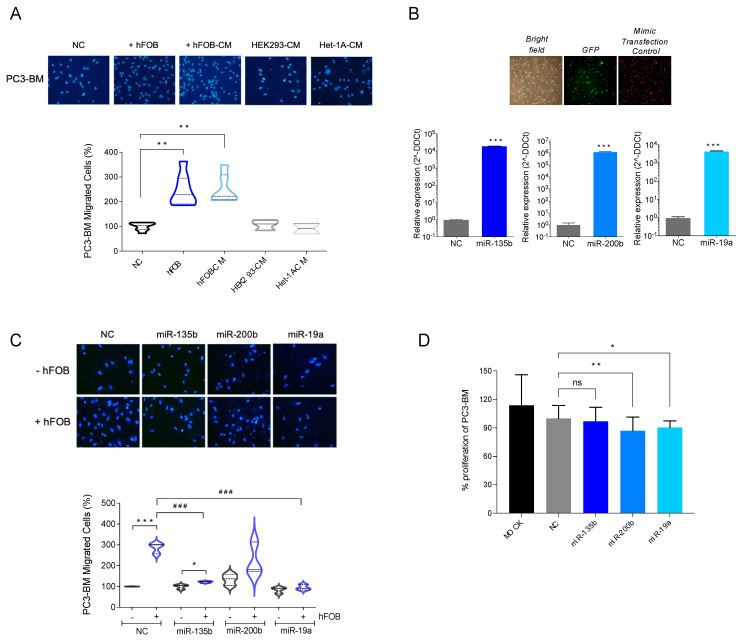
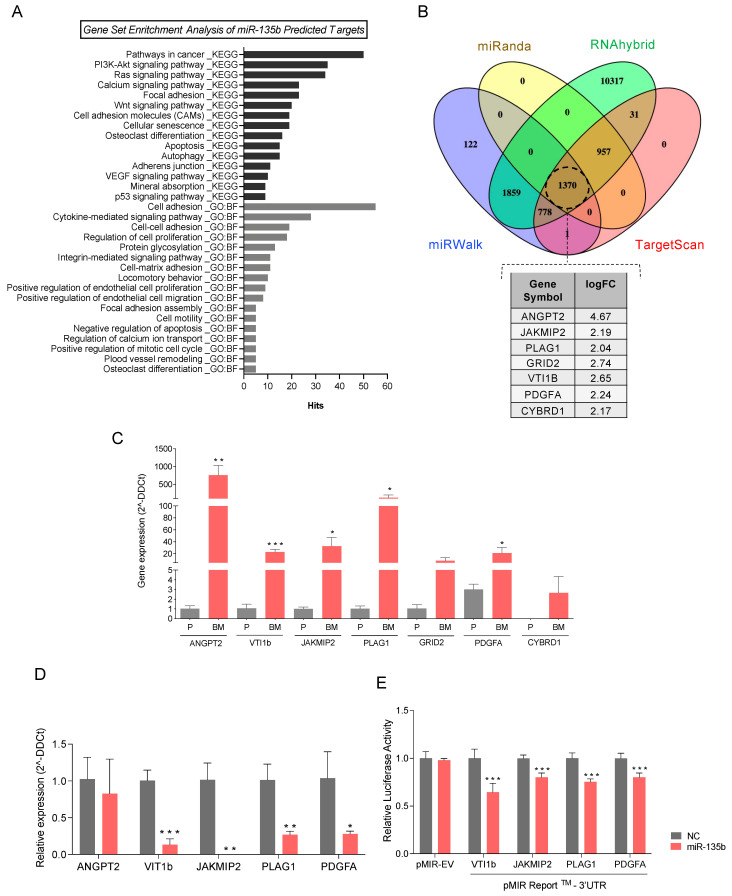
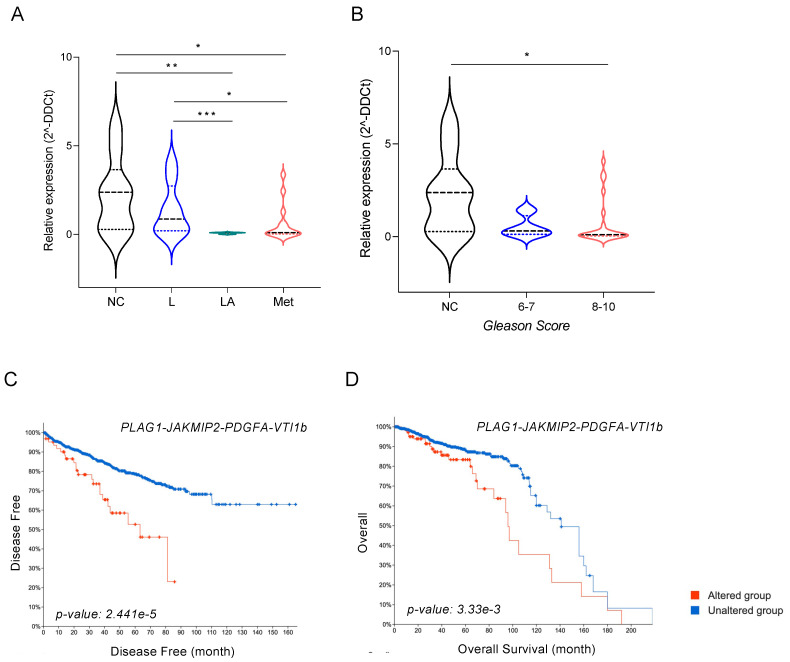
About 70% of advanced-stage prostate cancer (PCa) patients will experience bone metastasis, which severely affects patients' quality of life and progresses to lethal PCa in most cases. Hence, understanding the molecular heterogeneity of PCa cell populations and the signaling pathways associated with bone tropism is crucial. For this purpose, we generated an animal model with high penetrance to metastasize to bone using an intracardiac percutaneous injection of PC3 cells to identify PCa metastasis-promoting factors. Using genomic high-throughput analysis we identified a miRNA signature involved in bone metastasis that also presents potential as a biomarker of PCa progression in human samples. In particular, the downregulation of miR-135b favored the incidence of bone metastases by significantly increasing PCa cells' migratory capacity. Moreover, the PLAG1, JAKMIP2, PDGFA, and VTI1b target genes were identified as potential mediators of miR-135b's role in the dissemination to bone. In this study, we provide a genomic signature involved in PCa bone growth, contributing to a better understanding of the mechanisms responsible for this process. In the future, our results could ultimately translate into promising new therapeutic targets for the treatment of lethal PCa.

Keywords: bone metastasis; miRNA-135b; miRNAs; prostate cancer.


Conflict of interest statement

The authors declare that they have no conflicts of interest.

Figures

Figure 1
Figure 1
Selection of human PC3 prostate tumor cells with increased bone metastatic phenotype. (A) View of the sequential method for the in vivo selection of PCa cells with bone tropism. (B) Representative bioluminescence imaging (BLI) of the metastatic distribution pattern of parental and PC3-BM cells over time. (C) Incidence of bone metastases for PC3 cells in long bones after the indicated rounds of in vivo selection. Results are expressed as the percentages of metastases in long bones per total number of long bones in analyzed mice. (D) Distribution and incidence of metastases in the different isolated bones. Results are expressed as the percentages of metastases detected by BLI imaging per total number of animals injected in each round. (E) Representative micro-CT images and 3D modelling showing osteolytic lesions caused by PCa cells. Black and yellow arrows show the metastatic lesions.
Figure 1
Figure 1
Selection of human PC3 prostate tumor cells with increased bone metastatic phenotype. (A) View of the sequential method for the in vivo selection of PCa cells with bone tropism. (B) Representative bioluminescence imaging (BLI) of the metastatic distribution pattern of parental and PC3-BM cells over time. (C) Incidence of bone metastases for PC3 cells in long bones after the indicated rounds of in vivo selection. Results are expressed as the percentages of metastases in long bones per total number of long bones in analyzed mice. (D) Distribution and incidence of metastases in the different isolated bones. Results are expressed as the percentages of metastases detected by BLI imaging per total number of animals injected in each round. (E) Representative micro-CT images and 3D modelling showing osteolytic lesions caused by PCa cells. Black and yellow arrows show the metastatic lesions.
Figure 2
Figure 2
Gene expression analysis of the bone metastatic subclone. (A) Principal component analysis illustrates segregation of distinct expression profiles of bone metastatic subclone PC3-BM and PC3-P cell lines. (B) Volcano plot of differential expression analysis of PC3-BM compared with PC3-P cell line. (C,D) Analysis of cancer-related gene sets using the transcriptome data. Graphs represent the total number of statistically significant up-and down-regulated enriched gene sets after multi-testing Benjamini–Hochberg correction, with FDR < 0.05, assigned to different cancer-related general process. (E) Heat maps indicating the genes included in the most relevant enriched gene sets for bone metastasis development. The color key shows relative expression levels of the differentially expressed genes, BM: PC3-BM and C: PC3-P cells.
Figure 3
Figure 3
Selection of miRNAs with potential roles in bone metastasis (A) Volcano plot of miRNA profiling analysis of PC3-BM compared with PC3-P cell line. (B) Differentially expressed miRNAs between PC3-BM and PC3-P cell line. The table represents the statistically significant deregulated microRNAs by t-Student analysis with p-value ≤ 0.05 and FC > 1.5. (C) RT-qPCR analysis validation of the microarray results. (D) Relative miRNA expression levels in primary tumors from PCa patients with and without biochemical recurrence (BCR) after radical prostatectomy. RNU48 was used as an endogenous control for all miRNA expression analyses. Values that are significantly different by t-test analysis are indicated by ** < 0.01.
Figure 4
Figure 4
Functional study of selected miRNAs. (A) Boyden chamber migration assay. hFOB: human osteoblast cell line. CM: conditioned media. (B) Relative miRNA expressions of miR-135b, miR-200b and miR-19a in transfected cells compared to cells transfected with mimic. Confirmed to have minimal sequence identity with miRNAs in human (negative control: NC). Images are representative of PC3-BM cells transduced with the firefly luciferase gene-coding region cloned upstream of the green fluorescent protein (GFP). Red fluorescence was used to monitor miRNA transfection efficiency of Dy547-labelled miRIDIAN microRNA Mimic Transfection Control. (C) Boyden chamber migration assays with PC3-MB transfected cells with NC or with miR-135b, miR-200, and miR-19a microRNA mimics and stablishing co-culture system with hFOB. (D) Proliferation assay of PC3-BM non-transfected (MOCK) or after NC, miR-135b, miR-200, and miR-19a transfection at 96 h (n = 6/condition). All bar graphs and plots represent the mean ± SEM of three independent experiments. Values that are significantly different by t-test analysis are indicated by * < 0.05, ** < 0.01, and *** < 0.001 or ### < 0.001, ns: no statistically significant. P: PC3 cells; BM: PC3-BM cells; hFOB: osteoblast cell line; CM: conditioned media.
Figure 5
Figure 5
MiRNA-135b target genes involved in bone metastasis. (A) Cancer-and metastasis-related enriched gene sets with p-value ≤ 0.01 from miRNA-135b predicted-target genes. KEGG pathways and GO term (biological function: BF) gene sets were downloaded from the miRWalk platform and used for the pathways analysis. (B) Venn diagram illustrating the overlap among the miR-135b-predicted target genes of four different algorithms (TargetScan, miRanda, miRWalk and RNAhybrid) using miRWalk platform. The table shows those target genes significantly over-expressed in the transcriptomic data of PC3-BM compared with PC3-P found in common with the predicted target gene set. (C) RT-qPCR analyses of genes that are predicted targets of miR-135b in PC3-BM compared with PC3-P. (D) Relative mRNA expression levels of the indicated putative miR-135b target genes at 48h post-transfection with miR-135b mimic and miR-Control (NC) in PC3-B©ells. (E) Luciferase assay performed in phoenix cells co-transfected with the indicated 3′UTR luciferase-reporter vectors and miR-135b mimic or miR-Control (NC). Graph represents luciferase activity normalized to the renilla internal control (n = 5). All bar graphs represent the mean ± SEM. Values that are significantly different by t-test analysis from NC group are indicated by * < 0.05, ** < 0.01, and *** < 0.001.
Figure 6
Figure 6
miR-135b and its targets JAKMIP2, PLAG1, and PDGFA as prognostic biomarkers. (A) Relative expression levels of miR-135b in plasma from healthy controls (NC) and patients with localized PCa (L; T1-2N0M0), locally advanced PCa (LA; T3-4N0M0), and metastatic PCa (M; T1-4N0-1M1). (B) Relative expression levels of miR-135b in plasma from healthy controls (NC) and patients with different Gleason scores. (C) Correlation between disease-free time (in months) and (D) overall survival with the expression levels of miR-135b-validated targets. Patients’ data were retrieved from different PCa studies and TCGA Repository using the cBioportal Visualization platform. Values that are significantly different by Mann–Whitney U test analysis are indicated by * < 0.05, ** < 0.01, and *** < 0.001.

References

    1. Ferlay J., Ervik M., Lam F., Colombet M., Mery L., Piñeros M., Znaor A., Soerjomataram I.B.F. Global Cancer Observatory: Cancer Today. International Agency for Research on Cancer; Lyon, France: 2020. [(accessed on 30 April 2021)]. Available online: https://gco.iarc.fr/today.
    1. Tsuzuki S., Park S.H., Eber M.R., Peters C., Shiozawa Y. Skeletal complications in cancer patients with bone metastases. Int. J. Urol. 2016;23:825–832. doi: 10.1111/iju.13170. - DOI - PMC - PubMed
    1. Yadav S.S., Stockert J.A., Hackert V., Yadav K.K., Tewari A.K. Intratumor Heterogeneity in Prostate Cancer. Urol. Oncol. Semin. Orig. Investig. 2018;36:349–360. doi: 10.1016/j.urolonc.2018.05.008. - DOI - PubMed
    1. Diaz-Cano S.J. Tumor Heterogeneity: Mechanisms and Bases for a Reliable Application of Molecular Marker Design. Int. J. Mol. Sci. 2012;13:1951–2011. doi: 10.3390/ijms13021951. - DOI - PMC - PubMed
    1. Weilbaecher K.N., Guise T.A., McCauley L.K. Cancer to bone: A fatal attraction. Nat. Rev. Cancer. 2011;11:411–425. doi: 10.1038/nrc3055. - DOI - PMC - PubMed