. 2021 Dec 10;13(24):6215.
doi: 10.3390/cancers13246215.

Increased Replication Stress Determines ATR Inhibitor Sensitivity in Neuroblastoma Cells

Affiliations

Increased Replication Stress Determines ATR Inhibitor Sensitivity in Neuroblastoma Cells

David King et al. Cancers (Basel). .

Abstract

Despite intensive high-dose multimodal therapy, high-risk neuroblastoma (NB) confers a less than 50% survival rate. This study investigates the role of replication stress in sensitivity to inhibition of Ataxia telangiectasia and Rad3-related (ATR) in pre-clinical models of high-risk NB. Amplification of the oncogene MYCN always imparts high-risk disease and occurs in 25% of all NB. Here, we show that MYCN-induced replication stress directly increases sensitivity to the ATR inhibitors VE-821 and AZD6738. PARP inhibition with Olaparib also results in replication stress and ATR activation, and sensitises NB cells to ATR inhibition independently of MYCN status, with synergistic levels of cell death seen in MYCN expressing ATR- and PARP-inhibited cells. Mechanistically, we demonstrate that ATR inhibition increases the number of persistent stalled and collapsed replication forks, exacerbating replication stress. It also abrogates S and G2 cell cycle checkpoints leading to death during mitosis in cells treated with an ATR inhibitor combined with PARP inhibition. In summary, increased replication stress through high MYCN expression, PARP inhibition or chemotherapeutic agents results in sensitivity to ATR inhibition. Our findings provide a mechanistic rationale for the inclusion of ATR and PARP inhibitors as a potential treatment strategy for high-risk NB.

Keywords: ATR; MYCN; PARP; neuroblastoma; replication stress.


Conflict of interest statement

N.J.C. has received research funding from Aguoron Pharmaceuticals and Pfizer for the development of rucaparib, BioMarin for studies on talazoparib and Tesaro for studies with niraparib and paid consultancy from Abbvie for veliparib. Newcastle University receives royalty income from the sales of rucaparib that are shared with contributors to its development, including N.J.C., N.J.C. has also received research funding from Vertex Pharmaceuticals and is currently in receipt of funding from Merck KGaA for work on ATR inhibitors and holds a patent for a pharmacodynamic biomarker of ATR inhibition (WO2014055756A1). All other authors declare no conflict of interest.

Figures
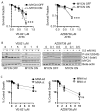
Figure 1
Figure 1
MYCN expression increases sensitivity to ATR inhibitors: (A) Survival fraction of SHEP-Tet21/N NB cell line with MYCN ON or OFF as measured by clonogenic survival assay 14 days post treatment with ATR inhibitors VE-821 and AZD6783. Statistical significance was calculated using the Student’s t-test, comparing MYCN OFF and MYCN ON cells at 1 µM. Mean and standard deviation of 3 independent repeats are shown. *** = p < 0.001. (B) Western blot of CHK1 activation (CHK1 serine 345 phosphorylation) 24 h post co-treatment with hydroxyurea (HU) and ATR inhibitor in the SHEP-Tet21/N NB cell line with MYCN ON or OFF. (C) Percentage control growth of IMR5/75 shMYCN NB cell line in response to increasing concentrations of VE-821 and AZD6738 with MYCN-amplified (MNA ct) or depleted MYCN (MNA kd) as measured by XTT cell proliferation assay. Mean and standard deviation of 3 independent repeats are shown. * = p < 0.05 and ns = non significant.
Figure 2
Figure 2
MYCN expression perturbs replication forks in NB cells and this is exacerbated upon ATR inhibition. (A) Number of RPA foci/cell in SHEP-Tet21/N cells with MYCN ON or MYCN OFF 24 h post treatment with 0.5 μM VE-821 or DMSO control. Data are pooled from three independent repeats for each repeat n > 50 cells, lines indicate median value, independent repeats are shown in Supplementary Figure S1. (B) Example RPA images. Scale bar = 10 μm (C) DNA fibre analysis of replication fork speed and stalling in VE-821 treated SHEP-Tet21/N cells with MYCN ON and MYCN OFF. Cells were incubated in 0.5 µM VE-821 or DMSO control and then pulse labelled with CldU, for 20 min, and label switched to IdU for 20 min. Example images of replication forks are shown. (D) DNA fibre length (µm) (CIdU). (E) Percentage fork stalling, calculated as a % of CIdU only labelled tracts (red) from continuous forks (CIdU (red) and IdU (green) labelled tracts) and (F) Percentage new origin firing, calculated as % of IdU only labelled tracts (green) from continuous forks (CIdU (red) and IdU (green) labelled tracts. For (DF), at least 100 forks were counted on each of three separate occasions, (D) shows pooled data (means of individual repeats is shown in Supplementary Figure S2), (E,F) show means of 3 independent repeats. Statistical significance was calculated using the Mann–Whitney U test (pooled data) and Student’s t-test (means). Throughout, *, ** and **** represent p < 0.05, <0.01 and <0.0001, respectively and ns = non significant.
Figure 3
Figure 3
PARP inhibition activates ATR and sensitises NB cells to ATR inhibitors independent of MYCN expression. (A) example images and mean cell intensity of phosph-ATR(Thr1989) in SHEP-Tet21/N cells with MYCN ON or MYCN OFF 24 h post treatment with 1 μM PARP inhibitor Olaparib or DMSO control. n > 80 cells. Scale bar = 10 μm. (B) Survival fraction of SHEP-Tet21/N NB cell line with MYCN ON or OFF as measured by clonogenic survival assay 14 days post treatment with ATR inhibitors VE-821 and (C) AZD6783 with or without 0.5 µM Olaparib. (D) Growth inhibition (% control growth) of the IMR5/75 shMYCN cell line in MYCN ON and knock down (KD) states measured by XTT cell proliferation assay post treatment with ATR inhibitors VE-821 and (E) AZD6783 with or without 1 µM Olaparib for 72 h. Statistical significance and sensitisation factor was calculated using the Student’s t-test, comparing MYCN OFF and MYCN ON cells at 1 µM. Mean and standard deviation of 3 independent repeats are shown. *, ** and *** = p < 0.05, 0.01 and 0.001 respectively. Sensitisation factor was calculated in each case as the fold change in survival or growth between with and without PARPi at 1 µM ATRi.
Figure 4
Figure 4
Co-treatment with PARP and ATR inhibitors increases replication stress and DNA damage. DNA fibre analysis of replication fork speed and stalling in VE-821/Olaparib treated SHEP-1 cells. Cells were incubated in 0.5 µM VE-821 and or 0.5 µM Olaparib or DMSO control and then pulse labelled with CldU, for 20 min, and label switched to IdU for 20 min. (A) DNA fibre length (µm) (CIdU), (B) Percentage fork stalling, calculated as a % of CIdU only labelled tracts (red) from continuous forks (CIdU (red) and IdU (green) labelled tracts) and (C) Percentage new origin firing, calculated as % of IdU only labelled tracts (green) from continuous forks (CIdU (red) and IdU (green) labelled tracts. For (AC), at least 100 forks were counted on each of three separate occasions, (A) shows pooled data (means of individual repeats is shown in Supplementary Figure S4), (B,C) show means of 3 independent repeats. (D) DNA damage; alkaline COMET assay of VE-821/Olaparib treated SHEP-1 cells incubated in 0.5 µM VE-821 and or 0.5 µM Olaparib or DMSO control for 24 h. Tail moment was calculated using CometScore software where at least 50 cells were analysed on each of three occasions. Pooled data are shown (means of individual repeats are shown in Supplementary Figure S4). (E) Representative COMET assay images. Images were obtained using the full spectrum function of the CometScore software. Cells were originally stained with SYBR Safe DNA gel stain. Statistical significance was calculated using the Mann–Whitney U test (pooled data) and Student’s t-test (means). Throughout, *, **, *** and **** represent p < 0.05, <0.01, <0.001 and <0.0001, respectively.
Figure 5
Figure 5
PARP inhibition induces accumulation of cells in S/G2, which is overcome by addition of an ATR inhibitor. Cell cycle profile of SHEP-Tet21/N cells with MYCN ON and MYCN OFF 24 h post treatment 0.5 µM VE-821 and or 0.5 µM Olaparib or DMSO control, mean and SEM of 5 independent repeats each representing 10,000 cells. Statistical significance was calculated using Student’s t-test (means). Throughout *, ** and *** represent p < 0.05, <0.01, and <0.001 respectively.
Figure 6
Figure 6
ATRi in combination with MYCN expression or PARPi results in increased mitotic aberrance, increased time in mitosis and increased cell death. Live cell imaging recorded over 12 h, starting 24 h post-treatment of SHEP-Tet21/N cells with MYCN ON and MYCN OFF with 0.5 µM VE-821 and/or 0.5 µM Olaparib or DMSO control. (A)Time spent in mitosis, (B) percentage cells undergoing aberrant mitosis and (C) percentage cells which died during mitosis. Mean and SD of 3 independent experiments (>50 cells) is shown. Statistical significance was calculated using Student’s t-test (means). Throughout *, **, *** and **** represent p < 0.05, <0.01, <0.001 and <0.0001, respectively.
Figure 7
Figure 7
ATRi sensitise MYCN-amplified (MNA) and non-amplified (non-MNA) cells to topotecan and temozolomide. Effect of 1 µM VE-821 (ATRi) on growth inhibition of (A) 5 nM topotecan (Topo) and (B) 50 µM temozolomide (TMZ) normalised to the effect of VE-821 alone and measured by XTT cell proliferation assay. Data shown are the mean + standard deviation of 3 individual experiments. Student’s t-test: * p < 0.05, ** p < 0.01 comparing TMZ to TMZ + ATRi in each cell line.

References

    1. Cohn S.L., Pearson A.D.J., London W.B., Monclair T., Ambros P.F., Brodeur G.M., Faldum A., Hero B., Iehara T., Machin D., et al. The international neuroblastoma risk group (INRG) classification system: An INRG task force report. J. Clin. Oncol. Off. J. Am. Soc. Clin. Oncol. 2009;27:289–297. doi: 10.1200/JCO.2008.16.6785. - DOI - PMC - PubMed
    1. Brodeur G.M., Seeger R.C., Schwab M., Varmus H.E., Bishop J.M. Amplification of N- myc in Untreated Human Neuroblastomas Correlates with Advanced Disease Stage. Science. 1984;224:1121–1124. doi: 10.1126/science.6719137. - DOI - PubMed
    1. Seeger R.C., Brodeur G.M., Sather H., Dalton A., Siegel S.E., Wong K.Y., Hammond D. Association of Multiple Copies of the N-mycOncogene with Rapid Progression of Neuroblastomas. N. Engl. J. Med. 1985;313:1111–1116. doi: 10.1056/NEJM198510313131802. - DOI - PubMed
    1. Basta N.O., Halliday G.C., Makin G., Birch J., Feltbower R., Bown N., Elliott M., Moreno L., Barone G., Pearson A.D., et al. Factors associated with recurrence and survival length following relapse in patients with neuroblastoma. Br. J. Cancer. 2016;115:1048–1057. doi: 10.1038/bjc.2016.302. - DOI - PMC - PubMed
    1. Maris J.M. Recent Advances in Neuroblastoma. N. Engl. J. Med. 2010;362:2202–2211. doi: 10.1056/NEJMra0804577. - DOI - PMC - PubMed

LinkOut - more resources