. 2021 Dec 17;13(24):6357.
doi: 10.3390/cancers13246357.

Orai1 Boosts SK3 Channel Activation

Affiliations

Orai1 Boosts SK3 Channel Activation

Adéla Tiffner et al. Cancers (Basel). .

Abstract

The interplay of SK3, a Ca2+ sensitive K+ ion channel, with Orai1, a Ca2+ ion channel, has been reported to increase cytosolic Ca2+ levels, thereby triggering proliferation of breast and colon cancer cells, although a molecular mechanism has remained elusive to date. We show in the current study, via heterologous protein expression, that Orai1 can enhance SK3 K+ currents, in addition to constitutively bound calmodulin (CaM). At low cytosolic Ca2+ levels that decrease SK3 K+ permeation, co-expressed Orai1 potentiates SK3 currents. This positive feedback mechanism of SK3 and Orai1 is enabled by their close co-localization. Remarkably, we discovered that loss of SK3 channel activity due to overexpressed CaM mutants could be restored by Orai1, likely via its interplay with the SK3-CaM binding site. Mapping for interaction sites within Orai1, we identified that the cytosolic strands and pore residues are critical for a functional communication with SK3. Moreover, STIM1 has a bimodal role in SK3-Orai1 regulation. Under physiological ionic conditions, STIM1 is able to impede SK3-Orai1 interplay by significantly decreasing their co-localization. Forced STIM1-Orai1 activity and associated Ca2+ influx promote SK3 K+ currents. The dynamic regulation of Orai1 to boost endogenous SK3 channels was also determined in the human prostate cancer cell line LNCaP.

Keywords: CRAC channel; Ca2+ activated K+ ion channels; LNCaP cells; Orai1; SK channels; SK3; STIM1; calmodulin.


Conflict of interest statement

The authors declare no conflict of interest.

Figures
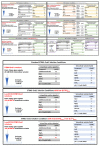
Figure A1
Figure A1
Solution conditions for SK3-Orai1 channel interplay. Throughout the investigations the solutions wer modified accordingly to the concentrations of different chemical compositions and named Symmetrical, Physiological and Standard SK3 solution conditions. For details please check the description in the Appendix A.
Figure 1
Figure 1
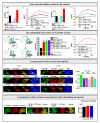
Characterization of SK3 and STIM1/Orai1 channel currents. (A) Time course of SK3 mediated whole—cell outward K+ currents at +30 mV using physiological solution conditions and recorded in the presence of different EGTA concentration in the pipette solution; (B) Block diagram depicts maximum current densities measured in (A); (C) Current–voltage relationship (I/V) corresponding to (B); (D) Time course of whole—cell inward currents at −74 mV of Orai1 in co-expression with STIM1 under physiological solution conditions. Inward currents activated upon passive store—depletion via 100 µM EGTA are shown in 2 mM followed by 10 mM extracellular Ca2+ solution; (E) I/V relationships corresponding to (D) in 10 mM extracellular Ca2+ solution; (F) Time courses of whole—cell inward currents at −74 mV of Orai1 in co-expression with STIM1 under standard STIM1/Orai1 solution conditions. Inward currents activated upon passive store—depletion via 100 μM EGTA compared to 20 mM EGTA are shown; (G) Respective I/V traces corresponding to (F); (H) Time course of SK3 + Orai1 mediated K+ currents recorded using standard STIM1/Orai1 solution conditions with either 100 μM or 20 mM EGTA in the pipette solution; (I) The I/V relationship corresponding to (H); (J) I/V relationship of SK3 + Orai1 mediated K+ currents recorded using standard STIM1/Orai1 solution conditions and 100 μM EGTA in the pipette solution before (black) and after (red) addition of SK channel blocker NS8593 (30 μM) and subsequent application of La3+ (10 µM). (inset) The remaining current upon NS8593 (red) displaying inward rectifying behavior was blocked by La3+ (blue). (K) The block diagram shows the current densities before and after application of SK channel blocker NS8593 for SK3, SK3 + Orai1, and SK3 + Orai1 + STIM1 n > 5 measured at +30 mV. The Mann–Whitney test was used for statistical comparison considering differences statistically significant at p < 0.05. The asterisk (*) highlights the statistical significance (p < 0.05) before and after application of SK channel blocker NS8593 to currents of SK3, SK3 + Orai1, and SK3 + Orai1 + STIM1 expressing cells. The asterisks (**), as also indicated by corresponding color (light orange), highlight the statistical significance (p < 0.05) between the currents recorded upon individual transfections of SK3, SK3 + Orai1, and SK3 + Orai1 + STIM1. All experiments in figure were performed in normal HEK 293 cells.
Figure 2
Figure 2
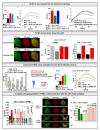
Orai1 enhances SK3 channel K+ currents. (A) Time course of K+ currents of SK3 expressing compared to SK3 and Orai1 or Orai1 E106Q co-expressing HEK 293 cells under physiological solution conditions. Pipette solution contains 100 µM EGTA and 144 mM K+ and bath solution contains 2 mM Ca2+ and 5 mM K+; (B) Block diagram with maximum current densities at t = 250 s corresponding to (A) and Orai1 + SK3 currents upon application of 10 μM La3+. The Mann–Whitney test was used for statistical comparison considering differences statistically significant at p < 0.05. The asterisk (*), as also indicated by the corresponding color (red), highlights the statistical significance of the currents recorded upon individual transfections of SK3, SK3 + Orai1, SK3 + Orai1 E106Q, SK3 + Orai1 upon application of 10 μM La3+. The currents of SK3, SK3 + Orai1 E106Q and SK3 + Orai1 upon application of 10 μM La3+ are significantly reduced when compared to SK3 + Orai1; (C) The I/V relationship of maximum currents measured in (A); (D) Time course experiment of HEK 293 cells expressing SK3 + Orai1 upon application of 0 mM Ca2+ and subsequent switch to 2 mM Ca2+ followed by 10 mM Ca2+ solution; (EG) Experiments identical to (AC) performed in STIM1/Orai1 DKO HEK 293 cells, (F) includes in addition SK3 + Orai1currents upon application of 10 µM GSK-7975A, 5 µM Cyppa and 5 µM Cyppa + 10µM La3+ and SK3 currents upon application of 5 µM Cyppa and 5 µM Cyppa + 10µM La3+. The Mann–Whitney test was used for statistical comparison considering differences statistically significant at p < 0.05. The asterisks (*), as also indicated by corresponding colors (black, red, blue, green, yellow, light purple, dark purple, light brown, dark brown), highlight the statistical significance of the currents recorded upon individual transfections of SK3, SK3 + Orai1, SK3 + Orai1 E106Q, SK3 + Orai1 upon application of 10 μM La3+, 10 µM GSK-7975A, 5 µM Cyppa and 5 µM Cyppa + 10µM La3+ and SK3 currents upon application of 5 µM Cyppa and 5 µM Cyppa + 10µM La3+. The asterisk of the particular color above the bar indicates the significance of p < 0.05 to the corresponding individual bar of the same color, respectively, which is applicable for each bar; (H) Maximum K+ currents of SK3 and SK3 + Orai1 expressing HEK 293 STIM1 DKO cells in response to different EGTA concentrations (100, 200, 300, 500, and 1000 µM) or 100 µM BAPTA in the pipette solution under physiological solution conditions. The Mann–Whitney test was used for statistical comparison considering differences statistically significant at p < 0.05. The asterisks (*), as also indicated by corresponding color (black), highlights the statistical significance of the currents recorded upon different EGTA or BAPTA concentration upon overexpression of either SK3 or SK3 + Orai1; (I) Co-localization studies in STIM1/Orai1 DKO HEK 293 cells performed with a pixel-by-pixel analysis and the corresponding block diagram showing the comparison of YFP-Orai1 with CFP-SK3 and YFP-Orai1 E106Q with CFP-SK3 (scale bar: 10 μm); (J) Western blots of wild-type and STIM1/Orai1 DKO HEK 293 cells upon overexpression of either SK3 and Orai1 or SK3 and STIM1 showing either the input of Orai1 detected with an anti-Orai1 antibody, input of STIM1 detected with an anti-STIM1 antibody, or co-immunoprecipitation of Orai1 and SK3 or STIM1 and SK3 detected with an anti-SK3 antibody. While experiments in (AD) were performed in normal HEK 293 cells, those in (EG) were performed in STIM1/Orai1 DKO HEK 293 cells. Western blots and Co-IP were performed in both normal and STIM1/Orai1 DKO HEK 293 cells as indicated.
Figure 3
Figure 3
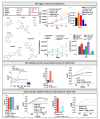
Orai1 overrules inhibitory effect of CaM mutants: (A) Block diagram with maximum current densities measured in STIM1/Orai1 DKO HEK 293 cells upon co-expression of CaMMUT with SK3 channel in the absence or presence of Orai1 in comparison to cells containing SK3 or SK3 + Orai1. The Mann–Whitney test was used for statistical comparison considering differences statistically significant at p < 0.05. The asterisks (*), as also indicated by corresponding colors (black, red, light purple), highlight the statistical significance of the currents recorded upon individual transfections of SK3, SK3 + CaMMUT, SK3 + CaMMUT + Orai1, SK3 + Orai1. The asterisk of the particular color above the bar indicates the significance of p < 0.05 to the corresponding individual bar of the same color, respectively, which is applicable for each bar; (B) I/V relationship corresponding to (A); (C) Block diagram with maximum current densities measured in STIM1/Orai1 DKO HEK 293 cells upon co-expression of CaM12 with SK3 channel in the absence or presence of Orai1 in comparison to cells containing SK3 or SK3 + Orai1. The Mann–Whitney test was used for statistical comparison considering differences statistically significant at p < 0.05. The asterisks (*), as also indicated by corresponding colors (black, red, cyan), highlight the statistical significance of the currents recorded upon individual transfections of SK3, SK3 + CaM12, SK3 + CaM12 + Orai1, SK3 + Orai1. The asterisk of the particular color above the bar indicates the significance of p < 0.05 to the corresponding individual bar of the same color, respectively, which is applicable for each bar; (D) I/V relationship corresponding to (C); Scheme represents the proposed structure of the single subunit of the SK channel with constitutively bound CaM. The subunit consists of 6 TM domains with the pore region located between the fifth and sixth segments. The opening mechanism of the channel is illustrated. Upon SK3 CaM point mutation the channel remains in the closed state; (E) Block diagram with maximum current densities measured upon expression of SK3 S441E, SK3 S441E + Orai1, SK3 S441E + CaM, and SK3 S441E + CaM + Orai1 compared to SK3, SK3 + Orai1, SK3 + CaM, and SK3 + CaM + Orai1 in STIM1/Orai1 DKO HEK 293 cells. The Mann–Whitney test was used for statistical comparison considering differences statistically significant at p < 0.05 The asterisks (*), as also indicated by corresponding colors (black, red, green, purple), highlight the statistical significance of the currents recorded upon individual transfections of SK3 S441E, SK3 S441E + Orai1, SK3 S441E + CaM, and SK3 S441E + CaM + Orai1 compared to SK3, SK3 + Orai1, SK3 + CaM, and SK3 + CaM + Orai1. The asterisk of the particular color above the bar indicates the significance of p < 0.05 to the corresponding individual bar of the same color, respectively, which is applicable for each bar; (F) I/V relationship of SK3 S441E, SK3 S441E + Orai1, SK3 S441W, and SK3 S441W + Orai1 compared to SK3 + Orai1; (G) Image series depict YFP-CaM with CFP-SK3 in STIM1/Orai1 DKO HEK 293 cells compared to YFP-CaMMUT or YFP-CaM12 with CFP-SK3, overlay and pixelwise calculated NFRET index for a representative cell (scale bar: 10 μm) in the absence (left) and presence (right) of Orai1; (H) Bar graph diagram depicting FRET of heterologously overexpressed CaM and SK3 in comparison to CaMMUT or CaM12 and SK3 in the presence or absence of Orai1. The asterisk highlights the statistical significance (p < 0.05). (I) Co-localization studies in STIM1/Orai1 DKO HEK 293 cells performed with a pixel-by-pixel analysis and the corresponding block diagram showing the comparison of YFP-Orai1 with CFP-SK3, YFP-Orai1 with CFP-SK3 S441E, and YFP-Orai1 with CFP-SK3 S441W (scale bar: 10 μm). All experiments in figure were performed in STIM1/Orai1 DKO HEK 293 cells.
Figure 4
Figure 4
Critical sites within Orai1 that mediate co-regulation with SK3. (A) Block diagram with maximum current densities measured in CRISPR/Cas9 STIM1/Orai1 DKO HEK 293 cells upon co-expression of Orai1 K85E or Orai1 L81K K85E with SK3 channel in comparison to cells containing SK3 or SK3 + Orai1. The Mann–Whitney test was used for statistical comparison considering differences statistically significant at p < 0.05. The asterisks (*), as also indicated by corresponding colors (red, green), highlight the statistical significance of the currents recorded upon individual transfections of SK3, SK3 + Orai1, SK3 + Orai1 K85E and Orai1 L81K K85E. The asterisk of the particular color above the bar indicates the significance of p < 0.05 to the corresponding individual bar of the same color, respectively, which is applicable for each bar; (B) I/V relationship corresponding to (A); (C) Block diagram with maximum current densities measured in STIM1/Orai1 DKO HEK 293 cells upon co-expression of Orai1 E173K or Orai1 L174D with SK3 channel in comparison to cells containing SK3 or SK3 + Orai1. The Mann–Whitney test was used for statistical comparison considering differences statistically significant at p < 0.05. The asterisks (*), as also indicated by corresponding colors (black, red, pink), highlight the statistical significance of the currents recorded upon individual transfections of SK3, SK3 + Orai1, SK3 + Orai1 E173K and Orai1 L174D. The asterisk of the particular color above the bar indicates the significance of p < 0.05 to the corresponding individual bar of the same color, respectively, which is applicable for each bar; (D) The I/V relationship corresponding to (C); (E) Co-localization block diagram performed in STIM1/Orai1 DKO HEK 293 cells with a pixel-by-pixel analysis showing the comparison of YFP-Orai1 K85E with CFP-SK3, and YFP-Orai1 L174D with CFP-SK3.; (F) Block diagram with maximum current densities measured in STIM1/Orai1 DKO HEK 293 cells upon co-expression of Orai1 Δ1-78, Orai1 79-281, or Orai1 1-281 with SK3 channel in comparison to cells containing SK3 or SK3 + Orai1. The Mann–Whitney test was used for statistical comparison considering differences statistically significant at p < 0.05. The asterisks (*), as also indicated by corresponding colors (red), highlight the statistical significance of the currents recorded upon individual transfections of SK3, SK3 + Orai1, SK3 + Orai1 Δ1-78, SK3 + Orai1 79-281 and SK3 + Orai1 1-281. The asterisk of the particular color above the bar indicates the significance of p < 0.05 to the corresponding individual bar of the same color, respectively, which is applicable for each bar; (G) The I/V relationship corresponding to (F); (H) Co-localization studies performed in STIM1/Orai1 DKO HEK 293 cells with a pixel-by-pixel analysis showing the comparison of YFP-Orai1 79-281 with CFP-SK3 and YFP-Orai1 with CFP-SK3 and the corresponding block diagram showing additionally YFP-Orai1 Δ1-78 with CFP-SK3 (scale bar: 10 μm); (I) Block diagram with maximum current densities measured upon co-expression of SK3 with Orai1 Δ1-26/Δ1-38/Δ1-47/Δ1-64/Δ1-71/Δ1-72/Δ1-74/Δ1-78 in comparison to SK3 and SK3 + Orai1. The Mann–Whitney test was used for statistical comparison considering differences statistically significant at p < 0.05. The red asterisk represents the significance in relation to SK3 + Orai1, while the black asterisk shows the significance in relation to SK3; (J) Block diagram with maximum current densities measured upon co-expression of SK3 with Orai1 Δ74-76, Orai1 Δ75-76, Orai1 R77A K78A, and Orai1 R83A K85A R87A in comparison to SK3 and SK3 + Orai1. The Mann–Whitney test was used for statistical comparison considering differences statistically significant at p < 0.05. The red asterisk represents the significance in relation to SK3 + Orai1. All experiments in figure were performed in STIM1/Orai1 DKO HEK 293 cells.
Figure 5
Figure 5
Functional coupling of STIM1 to Orai1 interferes with the SK3–Orai1 interplay. (A) Block diagram with maximum current densities measured in STIM1/Orai1 DKO HEK 293 cells upon co-expression of Orai1 L273D with SK3 channel in comparison to cells containing SK3 or SK3 + Orai1. The Mann–Whitney test was used for statistical comparison considering differences statistically significant at p < 0.05. The asterisks (*), as also indicated by corresponding colors (red, light blue), highlight the statistical significance of the currents recorded upon individual transfections of SK3, SK3 + Orai1, SK3 + Orai1 L273D. The asterisk of the particular color above the bar indicates the significance of p < 0.05 to the corresponding individual bar of the same color, respectively, which is applicable for each bar; (B) I/V relationship corresponding to (A); (C) Block diagram with maximum current densities measured in STIM1/Orai1 DKO HEK 293 cells upon co-expression of Orai1 L273D, SK3, and STIM1 in comparison to cells containing SK3 + Orai1 or SK3 + Orai1 + STIM1. The Mann–Whitney test was used for statistical comparison considering statistically significant differences at p < 0.05. The asterisks (*), as also indicated by corresponding colors (red, blue), highlight the statistical significance of the currents recorded upon individual transfections of SK3, SK3 + Orai1 + STIM1, SK3 + Orai1 L273D + STIM1. The asterisk of the particular color above the bar indicates the significance of p < 0.05 to the corresponding individual bar of the same color, respectively, which is applicable for each bar; (D) I/V relationship corresponding to (C); I Co-localization studies with a pixel-by-pixel analysis showing mCherry-STIM1, CFP-SK3, and YFP-Orai1 before and after application of thapsigargin; (F) The Pearson correlation coefficient (R-factor) gives a value for co-localizatiI(E) before and after thapsigargin treatment. An asterisk (*) indicates a significant difference in co-localization of SK3 and Orai1 before compared to after application of thapsigargin (t-test: p < 0.05). The control experiment of SK3 + Orai1 in the absence of STIM1 does not reveal a significant difference before compared to after thapsigargin treatment; (G) The Pearson correlation coefficient (R-factor) gives a value for co-localization of Orai1 + STIM1 before and after thapsigargin treatment in the absence compared to the presence of SK3 channel. An asterisk (*) indicates a significant difference in co-localization of STIM1 + Orai1 after application of thapsigargin (t-test: p < 0.05) in the presence of SK3; (H) Maximum K+ currents of SK3, SK3 + Orai1, and SK3 + Orai1 + STIM1 expressing STIM1/Orai1 DKO HEK 293 cells in response to different EGTA concentrations in the pipette solution (100, 200, 300, 500, and 1000 µM) under physiological solution conditions; (I) Block diagram with maximum current densities measured in STIM1/Orai1 DKO HEK 293 cells upon co-expression of SK3 + Orai1 + STIM1 in comparison to cells containing SK3 or SK3 + Orai1 upon application of physiological SK3 solution conditions with high [Ca2+]extra of 10 mM (as indicated by the scheme left to the block diagram). The Mann–Whitney test was used for statistical comparison considering differences statistically significant at p < 0.05. The asterisks (*), as also indicated by corresponding colors (red, green), highlight the statistical significance of the currents recorded upon individual transfections of SK3, SK3 + Orai1, SK3 + Orai1 + STIM1. The asterisk of the particular color above the bar indicates the significance of p < 0.05 to the corresponding individual bar of the same color, respectively, which is applicable for each bar; (J) I/V relationship corresponding to (I); (K) Block diagram with maximum current densities measured in STIM1/Orai1 DKO HEK 293 cells upon co-expression of SK3, Orai1, and STIM1 L251S/Y361S/L373/L373, A376S/A376K/R426L/1-474/Δ400-403/L402D/400AADA403 in comparison to cells containing SK3, SK3 + Orai1, or SK3 + Orai1 + STIM1. The Mann–Whitney test was used for statistical comparison considering differences statistically significant at p < 0.05. The red asterisk represents the significance in relation to SK3 + Orai1, while the black asterisk shows the significance in relation to SK3 and the green asterisk indicates the significant difference to SK3 + Orai1 + STIM1; (L) Co-localization studies with a pixel-by-pixel analysis showing mCherry-STIM1 L251S or mCherry-STIM1 L373S, CFP-SK3, and YFP-Orai1 before and after application of thapsigargin; (M) The Pearson correlation coefficient (R-factor) gives a value for co-localization of (L) and additional STIM1 double mutant mCherry-STIM1 L373S co-expressed with CFP-SK3 and YFP-Orai1, all compared to mCherry-STIM1 WT, CFP-SK3, and YFP-Orai1 before and after thapsigargin treatment. An asterisk indicates a significant difference in co-localization of SK3 and Orai1 before compared to after application of thapsigargin (t-test: p < 0.05). All experiments in figure were performed in STIM1/Orai1 DKO HEK 293 cells.
Figure 6
Figure 6
SK3–Orai1 interplay in LNCaP cells: Inset table and chemical structures represent the used agonist and antagonist of SK and Orai1 channels. (A) Cell viability of LNCaP cells after 24, 48, 72, and 96 h upon the treatment with SK3 channel agonist 10 μM Cyppa, 5 μM NS309, and antagonist 30 μM NS8593, 10 mM 4-AP detected via MTS assay; (B) Block diagram represents the cell proliferation of LNCaP cells after 96 h upon conditions described in (A). The Mann–Whitney test was used for statistical comparison considering differences statistically significant at p < 0.05. The black asterisk represents the significance in relation to normal cell growth; (C) Cell viability of LNCaP cells after 24/48/72 and 96 h upon the treatment with Orai1 channel blocker 10 μM La3+, 30 μM La3+, 100 μM GSK7975A, 100 μM Synta66, the combination of Orai1 blocker 10 μM La3+ with SK3 channel antagonist 30 μM NS8593 and 10 µM BTP2 detected via MTS assay; (D) Block diagram represents the cell proliferation of LNCaP cells after 96 h upon conditions described in (C). The Mann–Whitney test was used for statistical comparison considering differences statistically significant at p < 0.05. The black asterisk represents the significance in relation to normal cell growth; (E) Time course of LNCaP currents of endogenously expressed SK3 channel in the absence or presence of Orai1 or Orai1 E106Q. Pipette solution contains 100 µM EGTA and 144 mM K+ and bath solution contains 2 mM Ca2+ and 5 mM K+; (F) Block diagram with maximum current densities corresponding to (E). The Mann–Whitney test was used for statistical comparison considering differences statistically significant at p < 0.05. The light red asterisk indicates the significance to Orai1; (G) I/V relationship of maximum currents measured in (E); (H) Block diagram with maximum current densities measured in LNCaP cells upon co-expression of CaM or CaMMUT with Orai1 in comparison to cells containing Orai1 or CaMMUT. The Mann–Whitney test was used for statistical comparison considering differences statistically significant at p < 0.05. The asterisks (*), as also indicated by corresponding colors (red, green, purple, grey), highlight the statistical significance of the currents recorded upon individual transfections of Orai1, CaM, Orai1 + CaM, CaMMUT and Orai1 + CaMMUT. The asterisk of the particular color above the bar indicates the significance of p < 0.05 to the corresponding individual bar of the same color, respectively, which is applicable for each bar; (I) The I/V relationship corresponding to (H); (J) Block diagram with maximum current densities measured in LNCaP cells upon co-expression of CaM12 with Orai1 in comparison to cells containing only Orai1 or CaM12. The Mann–Whitney test was used for statistical comparison considering differences statistically significant at p < 0.05. The asterisks (*), as also indicated by corresponding colors (red, orange, cyan), highlight the statistical significance of the currents recorded upon individual transfections of Orai1, CaM12 and Orai1 + CaM12. The asterisk of the particular color above the bar indicates the significance of p < 0.05 to the corresponding individual bar of the same color, respectively, which is applicable for each bar; (K) The I/V relationship corresponding to (J). All experiments in figure were performed in LNCaP cells.

References

    1. Berridge M.J., Bootman M.D., Roderick H.L. Calcium signalling: Dynamics, homeostasis and remodelling. Nat. Rev. Mol. Cell Biol. 2003;4:517–529. doi: 10.1038/nrm1155. - DOI - PubMed
    1. Berridge M.J., Lipp P., Bootman M.D. The versatility and universality of calcium signalling. Nat. Rev. Mol. Cell Biol. 2000;1:11–21. doi: 10.1038/35036035. - DOI - PubMed
    1. Rosado J.A., Sage S.O. The actin cytoskeleton in store-mediated calcium entry. J. Physiol. 2000;526:221–229. doi: 10.1111/j.1469-7793.2000.t01-2-00221.x. - DOI - PMC - PubMed
    1. Jardin I., Diez-Bello R., Lopez J.J., Redondo P.C., Salido G.M., Smani T., Rosado J.A. TRPC6 Channels Are Required for Proliferation, Migration and Invasion of Breast Cancer Cell Lines by Modulation of Orai1 and Orai3 Surface Exposure. Cancers. 2018;10:331. doi: 10.3390/cancers10090331. - DOI - PMC - PubMed
    1. Rosado J.A. Calcium Entry Pathways in Non-excitable Cells. Preface. Adv. Exp. Med. Biol. 2016;898:VII–VIII. - PubMed

LinkOut - more resources