. 2021 Dec 18;13(24):6360.
doi: 10.3390/cancers13246360.

D-Mannose Slows Glioma Growth by Modulating Myeloperoxidase Activity

Affiliations

D-Mannose Slows Glioma Growth by Modulating Myeloperoxidase Activity

Negin Jalali Motlagh et al. Cancers (Basel). .

Abstract

Host immune response in the tumor microenvironment plays key roles in tumorigenesis. We hypothesized that D-mannose, a simple sugar with anti-inflammatory properties, could decrease oxidative stress and slow glioma progression. Using a glioma stem cell model in immunocompetent mice, we induced gliomas in the brain and tracked MPO activity in vivo with and without D-mannose treatment. As expected, we found that D-mannose treatment decreased the number of MPO+ cells and slowed glioma progression compared to PBS-treated control animals with gliomas. Unexpectedly, instead of decreasing MPO activity, D-mannose increased MPO activity in vivo, revealing that D-mannose boosted the MPO activity per MPO+ cell. On the other hand, D-glucose had no effect on MPO activity. To better understand this effect, we examined the effect of D-mannose on bone marrow-derived myeloid cells. We found that D-mannose modulated MPO activity via two mechanisms: directly via N-glycosylation of MPO, which boosted the MPO activity of each molecule, and indirectly by increasing H2O2 production, the main substrate for MPO. This increased host immune response acted to reduce tumor size, suggesting that increasing MPO activity such as through D-mannose administration may be a potential new therapeutic direction for glioma treatment.

Keywords: D-mannose; MPO activity; glioma; leukocytes.


Conflict of interest statement

The authors declare no conflict of interest.

Figures

Figure 1
Figure 1
Tumor size characterized by bioluminescence (BLI) and T2-weighted MR imaging. (A) Representative BLI images performed at the third week after glioma induction for the D-mannose-treated and PBS-treated groups. (B) Quantification of tumor sizes on BLI (n = 8–9 per group). (C) Representative T2-weighted MRI images performed at the fourth week after glioma induction for the two groups. Arrows indicate the tumors. (D) Quantification of tumor sizes (n = 8–9 per group). Data are shown as mean ± standard errors of measurements.
Figure 2
Figure 2
MPO-Gd MR imaging, and MPO protein level and activity in glioma mice. (A) Representative MRI of glioma mice performed before and at 75 min after MPO-Gd administration (n = 3 per group). (B) Comparison of contrast-to-noise ratios (CNR) in animals with D-mannose treatment and control group. (C) Ex vivo measurements of MPO protein level and MPO activity from brain tissues from glioma-bearing mice (n = 7 per group). Data are shown as mean ± SEM.
Figure 3
Figure 3
Decrease in MPO+ cells in brains of D-mannose-treated mice. (A) Representative flow cytometry histograms comparing the number of MPO+ cells between D-mannose-treated and PBS-control group (light blue: negative control (unstained), dark blue: D-mannose-treated, and red: PBS-treated). (B) Quantification of the number of MPO+ cells as a percentage of CD11b+ leukocytes (n = 9–10 mice per group). Data are shown as mean ± SEM.
Figure 4
Figure 4
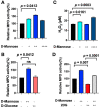
Biochemical analysis of PMA-stimulated mouse bone marrow-derived leukocytes. (A) Relative MPO activities were normalized to untreated leukocytes samples (+ = 1 mg/mL, ++ = 2 mg/mL, ++++ = 4 mg/mL). (B) Comparison of MPO activity with and without D-mannose and D-glucose (++ = 2 mg/mL). ns = not significant. (C) The amount of H2O2 produced by leukocytes was measured under similar conditions as in (A). (D) Comparison of MPO activity produced by leukocytes with and without D-mannose and 2-deoxy-D-glucose (2DG). All data are in mean ± SEM.

References

    1. De Cordova S., Shastri A., Tsolaki A.G., Yasmin H., Klein L., Singh S.K., Kishore U. Molecular Heterogeneity and Immunosuppressive Microenvironment in Glioblastoma. Front. Immunol. 2020;11:1402. doi: 10.3389/fimmu.2020.01402. - DOI - PMC - PubMed
    1. Fine H.A. Radiotherapy plus adjuvant temozolomide for the treatment of glioblastoma—A paradigm shift. Nat. Clin. Pract. Oncol. 2005;2:334–335. doi: 10.1038/ncponc0204. - DOI - PubMed
    1. Ostrom Q.T., Bauchet L., Davis F.G., Deltour I., Fisher J.L., Langer C.E., Pekmezci M., Schwartzbaum J.A., Turner M.C., Walsh K.M., et al. The epidemiology of glioma in adults: A “state of the science” review. Neuro. Oncol. 2014;16:896–913. doi: 10.1093/neuonc/nou087. - DOI - PMC - PubMed
    1. Balkwill F., Mantovani A. Inflammation and cancer: Back to Virchow? Lancet. 2001;357:539–545. doi: 10.1016/S0140-6736(00)04046-0. - DOI - PubMed
    1. Roma-Rodrigues C., Mendes R., Baptista P.V., Fernandes A.R. Targeting Tumor Microenvironment for Cancer Therapy. Int. J. Mol. Sci. 2019;20:840. doi: 10.3390/ijms20040840. - DOI - PMC - PubMed