. 2021 Dec 18;13(24):6363.
doi: 10.3390/cancers13246363.

Blood Bacterial DNA Load and Profiling Differ in Colorectal Cancer Patients Compared to Tumor-Free Controls

Affiliations

Blood Bacterial DNA Load and Profiling Differ in Colorectal Cancer Patients Compared to Tumor-Free Controls

Massimiliano Mutignani et al. Cancers (Basel). .

Abstract

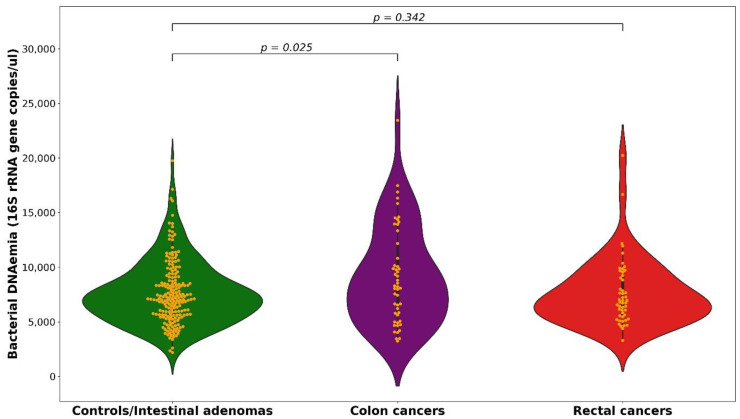
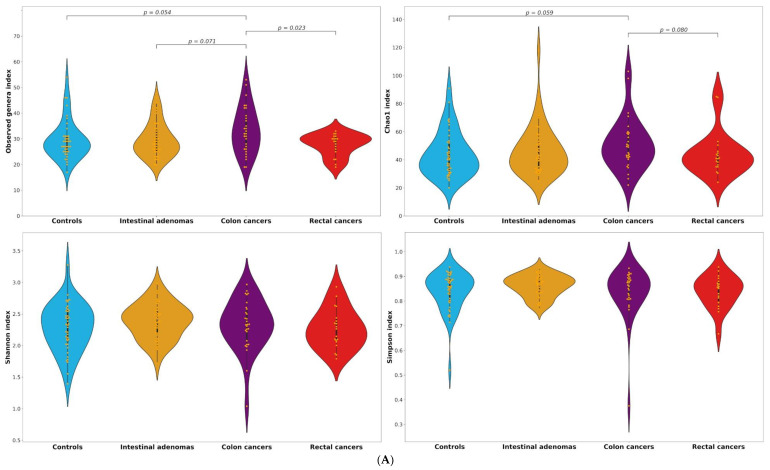
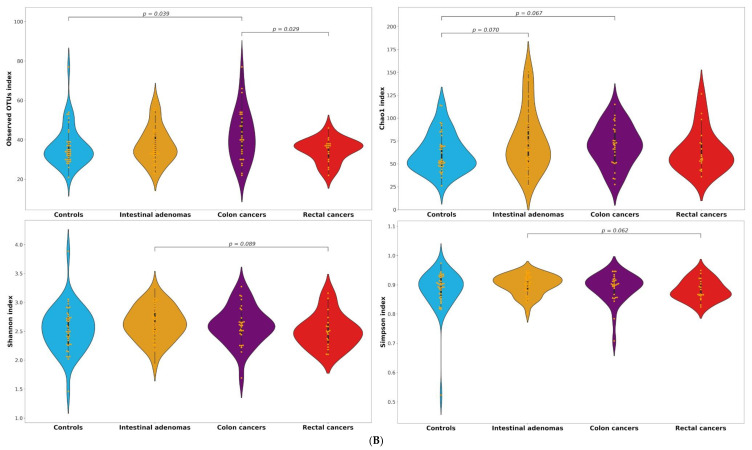
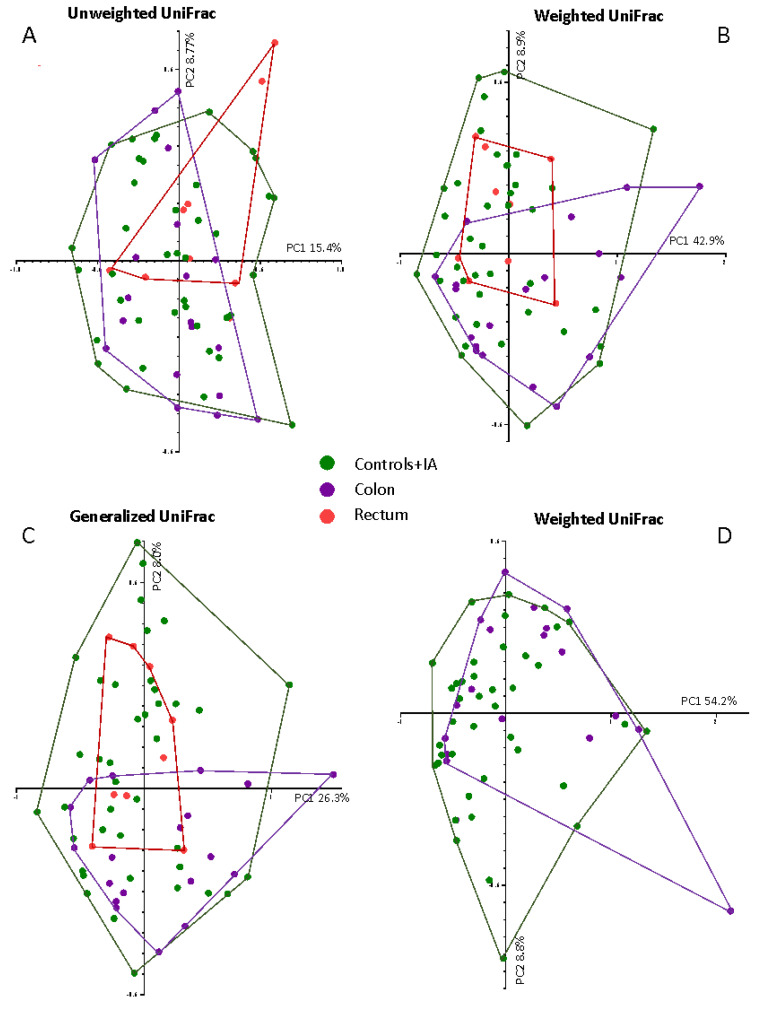
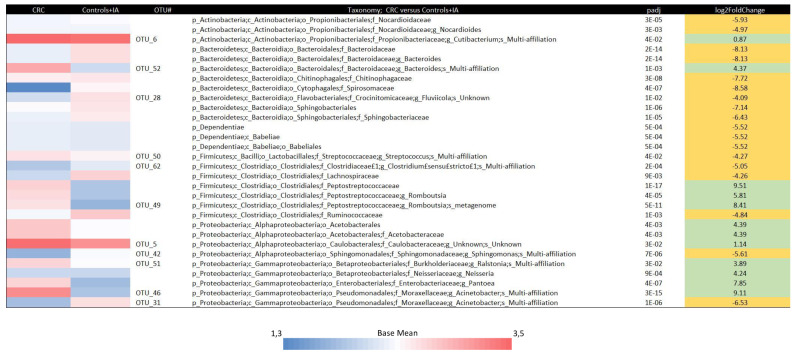
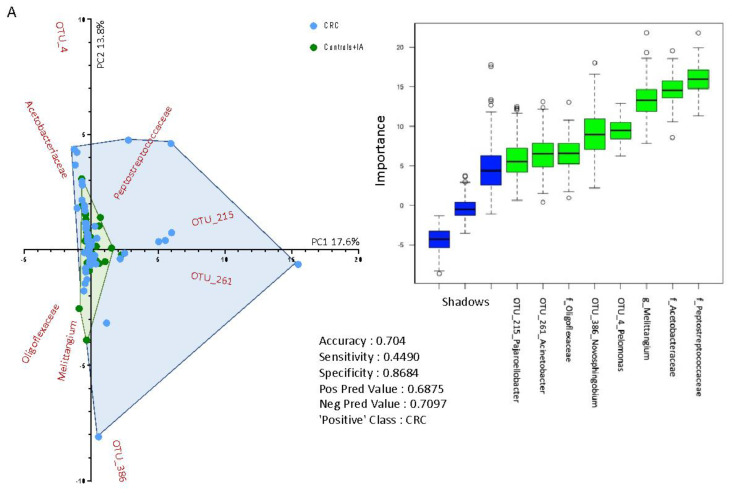
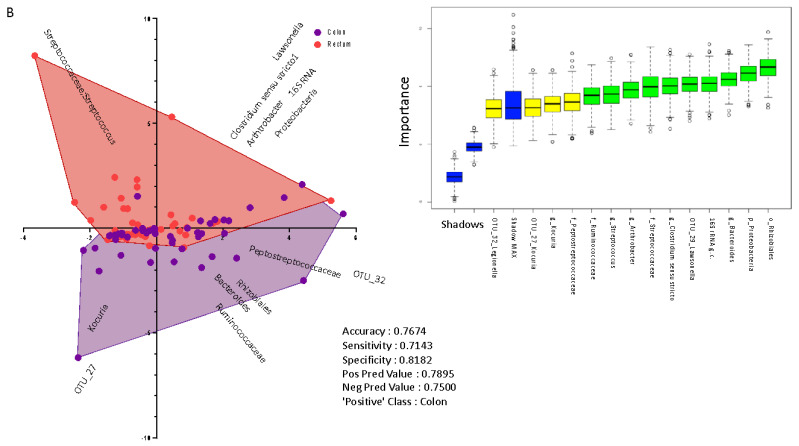
Inflammation and immunity are linked to intestinal adenoma (IA) and colorectal cancer (CRC) development. The gut microbiota is associated with CRC risk. Epithelial barrier dysfunction can occur, possibly leading to increased intestinal permeability in CRC patients. We conducted a case-control study including 100 incident histologically confirmed CRC cases, and 100 IA and 100 healthy subjects, matched to cases by center, sex and age. We performed 16S rRNA gene analysis of blood and applied conditional logistic regression. Further analyses were based on negative binomial distribution normalization and Random Forest algorithm. We found an overrepresentation of blood 16S rRNA gene copies in colon cancer as compared to tumor-free controls. For high levels of gene copies, community diversity was higher in colon cancer cases than controls. Bacterial taxa and operational taxonomic unit abundances were different between groups and were able to predict CRC with an accuracy of 0.70. Our data support the hypothesis of a higher passage of bacteria from gastrointestinal tract to bloodstream in colon cancer. This result can be applied on non-invasive diagnostic tests for colon cancer control.

Keywords: bacterial 16S rRNA gene; bacterial translocation; case-control study; colon cancer diagnoses; microbiome.


Conflict of interest statement

The authors declare no conflict of interest.

Figures

Figure 1
Figure 1
Distribution of 16S rRNA gene copies per µL of whole blood among controls/intestinal adenomas, colon and rectal cancers.
Figure 2
Figure 2
(A) Distributions of observed, Chao1, Shannon and Simpson alpha-diversity indices among controls, intestinal adenomas, colon and rectal cancers for genera among the highest two quintiles of 16S rRNA gene copies. (B) Distributions of observed, Chao1, Shannon and Simpson alpha-diversity indices among controls, intestinal adenomas, colon and rectal cancers for the operational taxonomic units (OTUs) among the highest two quintiles of 16S rRNA gene copies.
Figure 2
Figure 2
(A) Distributions of observed, Chao1, Shannon and Simpson alpha-diversity indices among controls, intestinal adenomas, colon and rectal cancers for genera among the highest two quintiles of 16S rRNA gene copies. (B) Distributions of observed, Chao1, Shannon and Simpson alpha-diversity indices among controls, intestinal adenomas, colon and rectal cancers for the operational taxonomic units (OTUs) among the highest two quintiles of 16S rRNA gene copies.
Figure 3
Figure 3
β-diversity of controls and intestinal adenoma (Controls + IA) group, colon cancer (Colon) and rectal cancer (Rectum) among subjects into the fifth quintile of 16S rRNA gene copies. The figure shows the UniFrac ®-diversity in all the three variants: (A) Unweighted UniFrac; (B) Weighted UniFrac; (C) generalized UniFrac for all the three groups: Controls + IA, Colon and Rectum. Panel (D) shows the Weighted Unifrac for Controls + IA and colon cancers after post-hoc analyses.
Figure 4
Figure 4
Different taxa between colorectal cancer (CRC) cases and controls and intestinal adenomas (IA) group by DESeq2 analyses. The taxonomic lineage of each taxon is shown: p, phylum; c, class; o, order; f, family; g, genus; OTU#, Operational Taxonomic Unit. The first two columns show the logarithmic transformation of normalized base mean value for each group. The “padj” column shows the p-value for heterogeneity between groups adjusted for multi-testing analyses. Positive fold changes (shown on a green background) designate taxon overrepresentation in the CRC group. Negative fold changes (shown on a yellow background) designate taxon underrepresentation in the CRC group.
Figure 5
Figure 5
Biplot of predictive variables discriminating (A) colorectal cancer (CRC) versus control and intestinal adenoma (IA) subjects; (B) colon versus rectal cancer cases, using Random Forest algorithm. The boxplot on the right side of each figure shows the importance (based on mean accuracy level) of the variables by Boruta feature selection. The shadows are part of the Boruta algorithm and show the max, medium and lowest level of mean accuracy, using the same dataset with group labels shuffled. The table in the middle part of each figure shows the Random Forest results considering the ‘Positive’ Class as indicated.
Figure 5
Figure 5
Biplot of predictive variables discriminating (A) colorectal cancer (CRC) versus control and intestinal adenoma (IA) subjects; (B) colon versus rectal cancer cases, using Random Forest algorithm. The boxplot on the right side of each figure shows the importance (based on mean accuracy level) of the variables by Boruta feature selection. The shadows are part of the Boruta algorithm and show the max, medium and lowest level of mean accuracy, using the same dataset with group labels shuffled. The table in the middle part of each figure shows the Random Forest results considering the ‘Positive’ Class as indicated.

Similar articles

Cited by

References

    1. Sung H., Ferlay J., Siegel R.L., Laversanne M., Soerjomataram I., Jemal A., Bray F. Global cancer statistics 2020: Globocan estimates of incidence and mortality worldwide for 36 cancers in 185 countries. CA Cancer J. Clin. 2021;71:209–249. doi: 10.3322/caac.21660. - DOI - PubMed
    1. Ait Ouakrim D., Pizot C., Boniol M., Malvezzi M., Boniol M., Negri E., Bota M., Jenkins M.A., Bleiberg H., Autier P. Trends in colorectal cancer mortality in europe: Retrospective analysis of the who mortality database. BMJ. 2015;351:h4970. doi: 10.1136/bmj.h4970. - DOI - PMC - PubMed
    1. Carioli G., Bertuccio P., Boffetta P., Levi F., La Vecchia C., Negri E., Malvezzi M. European cancer mortality predictions for the year 2020 with a focus on prostate cancer. Ann. Oncol. 2020;31:650–658. doi: 10.1016/j.annonc.2020.02.009. - DOI - PubMed
    1. Vogelstein B., Papadopoulos N., Velculescu V.E., Zhou S.B., Diaz L.A., Kinzler K.W. Cancer genome landscapes. Science. 2013;339:1546–1558. doi: 10.1126/science.1235122. - DOI - PMC - PubMed
    1. Terzic J., Grivennikov S., Karin E., Karin M. Inflammation and colon cancer. Gastroenterology. 2010;138:2101–2114.e5. doi: 10.1053/j.gastro.2010.01.058. - DOI - PubMed