. 2021 Dec 20;13(24):6383.
doi: 10.3390/cancers13246383.

hsa_circ_0001275 Is One of a Number of circRNAs Dysregulated in Enzalutamide Resistant Prostate Cancer and Confers Enzalutamide Resistance In Vitro

Affiliations

hsa_circ_0001275 Is One of a Number of circRNAs Dysregulated in Enzalutamide Resistant Prostate Cancer and Confers Enzalutamide Resistance In Vitro

Marvin C J Lim et al. Cancers (Basel). .

Abstract

Background: Enzalutamide is part of the treatment regimen for metastatic castration-resistant prostate cancer (MCRPC). However, both intrinsic and acquired resistance to the drug remain substantial clinical quandaries. circRNAs, a novel type of non-coding RNA, have been identified in a number of cancers including prostate cancer and have been associated with cancer development and progression. circRNAs have shown great potential as clinically useful blood-based 'liquid biopsies' and as therapeutic targets in prostate cancer. The aim of this study was to examine the role of circRNA transcripts in enzalutamide-resistant prostate cancer cells and assess their utility as biomarkers.

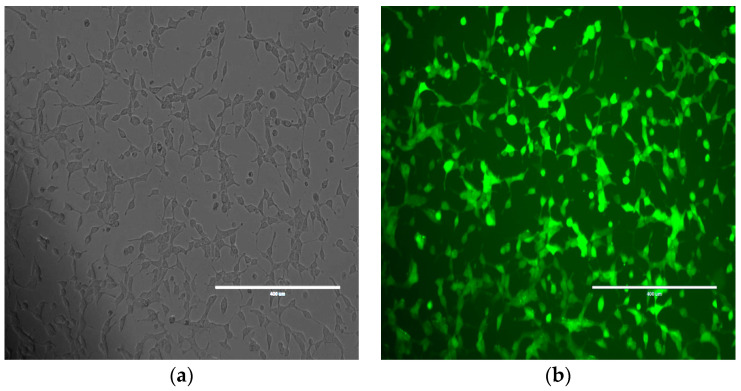
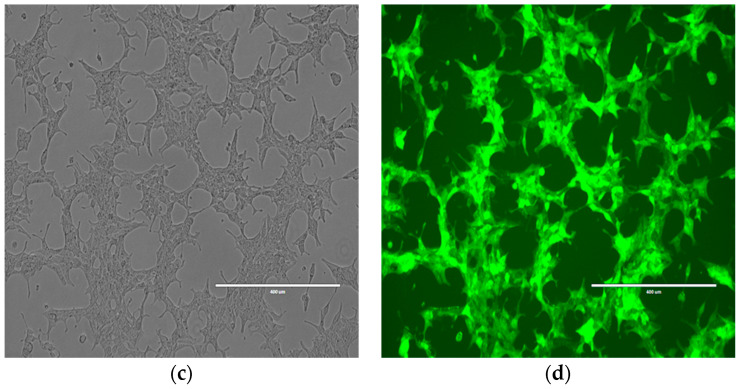
Methods: An isogenic cell line model of enzalutamide resistance was subjected to circRNA microarray profiling. Several differentially expressed circRNAs, along with their putative parental genes were validated using reverse transcription-quantitative polymerase chain reaction (RT-qPCR). circRNAs of interest were stably overexpressed in the control cell line and drug sensitivity was assessed using an ELISA-based proliferation assay. The candidate circRNA, hsa_circ_0001275, was measured in patient plasma samples using RT-droplet digital PCR (RT-ddPCR).

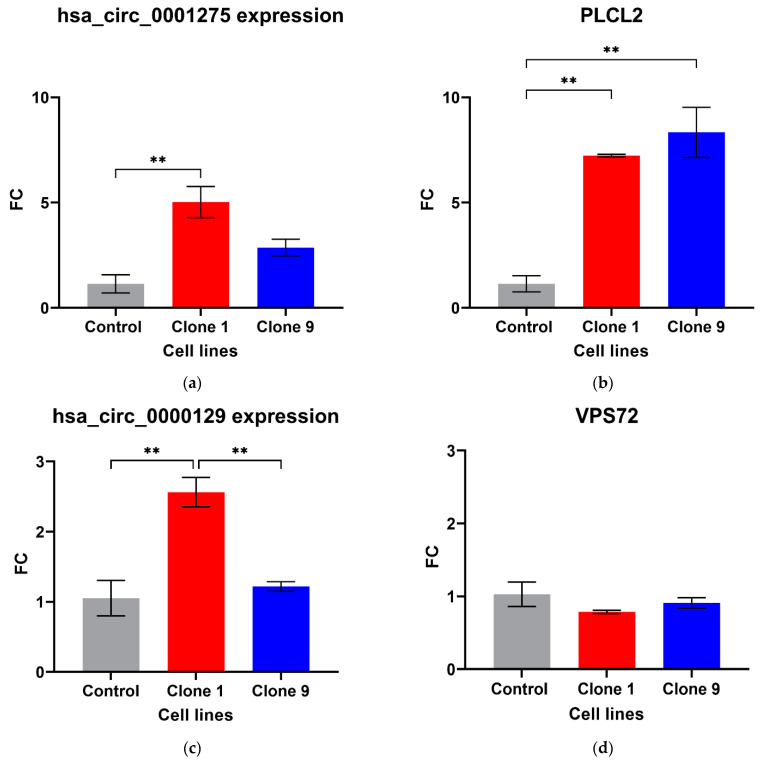
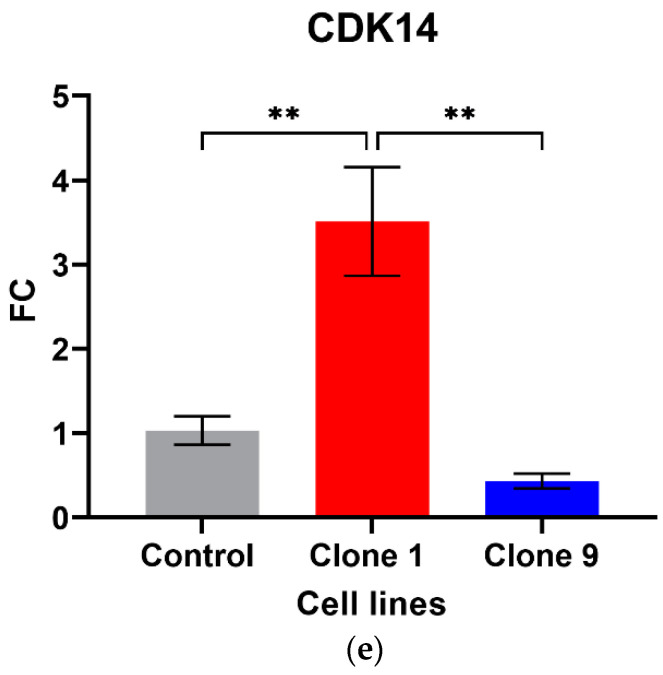
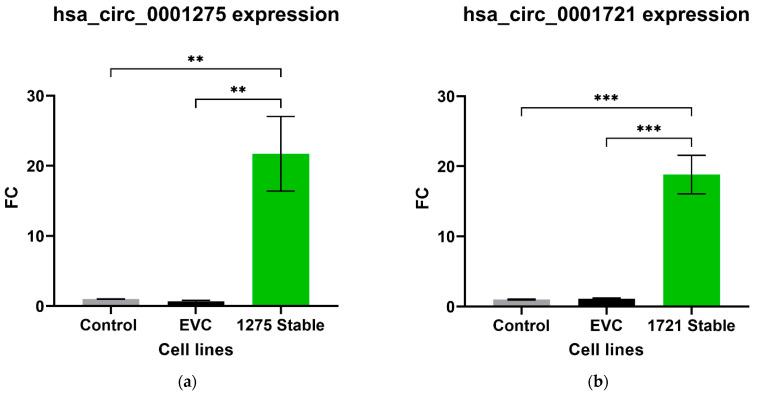
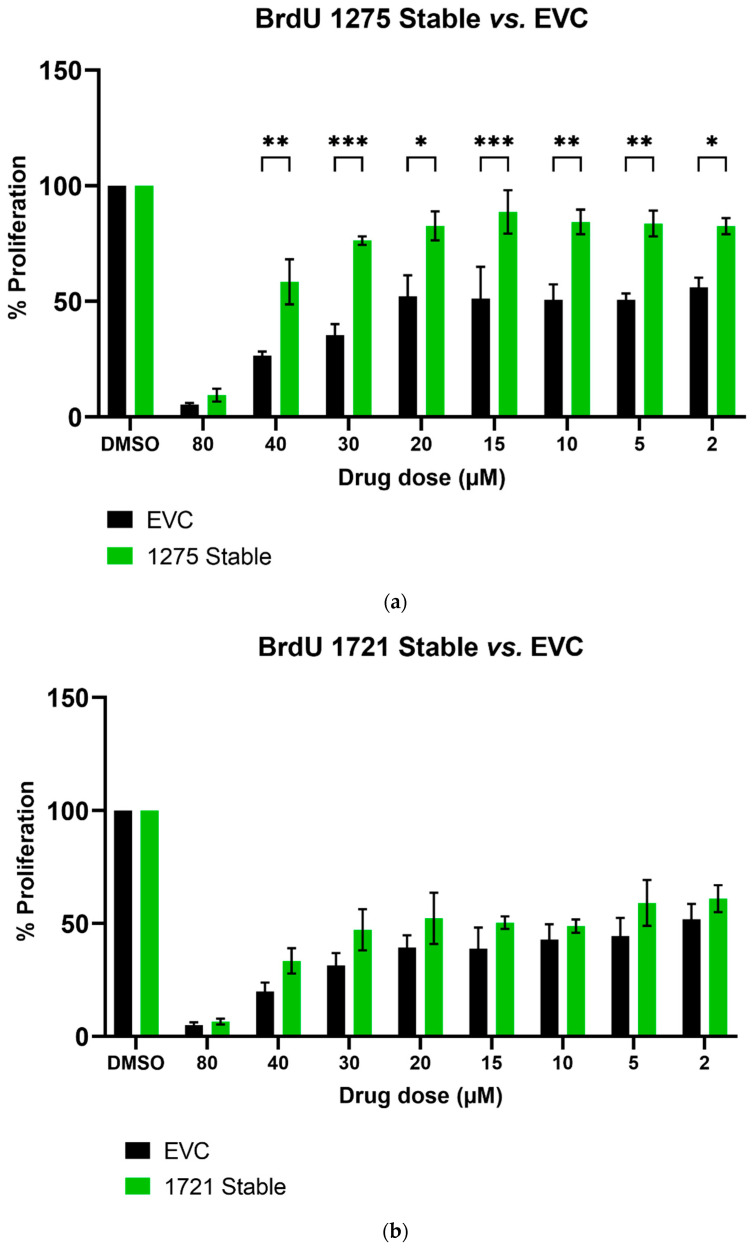
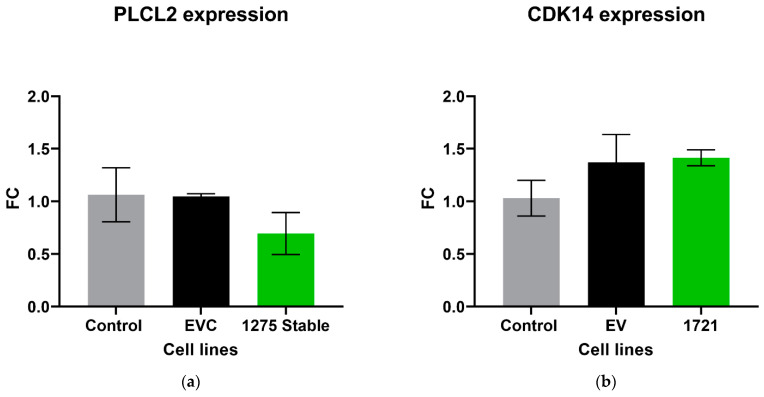
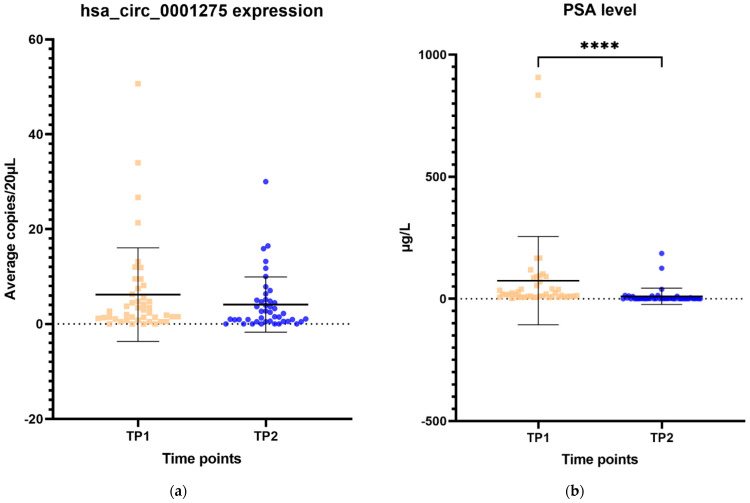
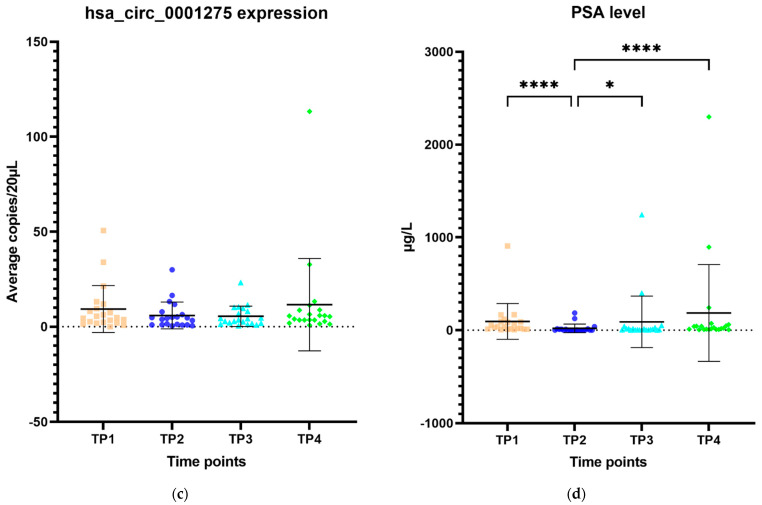
Results: hsa_circ_0001275 and its parental gene, PLCL2, were significantly up-regulated in strongly resistant clones vs. control (p < 0.05). Overexpression of hsa_circ_0001275 in the control cell line resulted in increased resistance to enzalutamide (p < 0.05). While RT-ddPCR analysis of hsa_circ_0001275 expression in plasma samples of 44 clinical trial participants showed a trend that mirrored the stages of disease activity (as defined by PSA level), the association did not reach statistical significance.

Conclusions: Our data suggest that increased levels of hsa_circ_0001275 contribute to enzalutamide resistance. hsa_circ_0001275 plasma expression showed a trend that mirrors the PSA level at specific disease time points, indicating that circRNAs mirror disease recurrence and burden and may be associated with enzalutamide resistance.

Keywords: circRNA (circular RNA); enzalutamide resistance; prostate cancer.


Conflict of interest statement

The authors declare no conflict of interest. The funders had no role in the design of the study; in the collection, analyses, or interpretation of data; in the writing of the manuscript, or in the decision to publish the results.

Figures

Figure 1
Figure 1
Validation of circRNAs and associated parental genes in the enzalutamide panel (a) hsa_circ_0001275, (b) PLCL2 parental gene, (c) hsa_circ_0000129, (d) VPS72 parental gene, (e) CDK14 parental gene for hsa_circ_0001721 (the circRNA expression has been previously presented [29]). Data graphed as the mean ± SEM (n = 3). Data were analysed using an ordinary one-way ANOVA followed by a Tukey’s post hoc test. (** p ≤ 0.01).
Figure 1
Figure 1
Validation of circRNAs and associated parental genes in the enzalutamide panel (a) hsa_circ_0001275, (b) PLCL2 parental gene, (c) hsa_circ_0000129, (d) VPS72 parental gene, (e) CDK14 parental gene for hsa_circ_0001721 (the circRNA expression has been previously presented [29]). Data graphed as the mean ± SEM (n = 3). Data were analysed using an ordinary one-way ANOVA followed by a Tukey’s post hoc test. (** p ≤ 0.01).
Figure 2
Figure 2
Representative images of Control cell line transfected with hsa_circ_0001275 using (a) bright field and (b) fluorescence microscopy and hsa_circ_0001721 using (c) bright field and (d) fluorescence microscopy. All scale bars are 400 µm. All images are 10× magnification.
Figure 2
Figure 2
Representative images of Control cell line transfected with hsa_circ_0001275 using (a) bright field and (b) fluorescence microscopy and hsa_circ_0001721 using (c) bright field and (d) fluorescence microscopy. All scale bars are 400 µm. All images are 10× magnification.
Figure 3
Figure 3
Relative expression of (a) hsa_circ_0001275 and (b) hsa_circ_0001721 in the stably transfected cell line compared to Control and EVC cell lines. Data graphed as the mean ± SEM (n = 3). Data were analysed using an ordinary one-way ANOVA followed by a Tukey’s post hoc test. (** p ≤ 0.01, *** p ≤ 0.001).
Figure 4
Figure 4
The effect of enzalutamide on the proliferative rate of EVC and cell line overexpressing (a) hsa_circ_0001275 (1275 Stable) and (b) hsa_circ_0001721 (1721 Stable). Proliferation was measured using BrdU ELISA. Data graphed as the mean ± SEM (n = 3). Analysis was performed using a two-way ANOVA followed by a Šídák’s post hoc test. (* p ≤ 0.05, ** p ≤ 0.01, *** p ≤ 0.001). Dimethyl sulfoxide (DMSO).
Figure 5
Figure 5
Relative expression of (a) PLCL2 in the stably transfected cell line which overexpressed hsa_circ_0001275 (1275 Stable) and (b) CDK14 in the stably transfected cell line which overexpressed hsa_circ_0001721 (1721 Stable). Data graphed as the mean ± SEM (n = 3). Data were analysed using an ordinary one-way ANOVA followed by a Tukey’s post hoc test.
Figure 6
Figure 6
Scatter plot of hsa_circ_0001275 level in plasma samples and PSA level. (a) hsa_circ_0001275 level in plasma samples and (b) PSA level of all 44 patients with first 2 available time points. Data graphed as mean ± SD (n = 44) and analysed using the Wilcoxon signed-rank test. (c) hsa_circ_0001275 level in plasma samples and (d) PSA level of 21 patients with all 4 time points available. Data graphed as the mean ± SD (n = 21) and analysed using one-way ANOVA with Friedman post hoc test. (* p ≤ 0.05, **** p ≤ 0.0001). Plasma at TP1 was selected as baseline prior to enzalutamide treatment, plasma at TP2 was selected during PSA nadir, plasma at TP3 was selected when PSA first progressed and plasma at TP4 was selected on second PSA progression.
Figure 6
Figure 6
Scatter plot of hsa_circ_0001275 level in plasma samples and PSA level. (a) hsa_circ_0001275 level in plasma samples and (b) PSA level of all 44 patients with first 2 available time points. Data graphed as mean ± SD (n = 44) and analysed using the Wilcoxon signed-rank test. (c) hsa_circ_0001275 level in plasma samples and (d) PSA level of 21 patients with all 4 time points available. Data graphed as the mean ± SD (n = 21) and analysed using one-way ANOVA with Friedman post hoc test. (* p ≤ 0.05, **** p ≤ 0.0001). Plasma at TP1 was selected as baseline prior to enzalutamide treatment, plasma at TP2 was selected during PSA nadir, plasma at TP3 was selected when PSA first progressed and plasma at TP4 was selected on second PSA progression.

References

    1. Siegel R.L., Miller K.D., Jemal A. Cancer statistics, 2020. CA Cancer J. Clin. 2020;70:7–30. doi: 10.3322/caac.21590. - DOI - PubMed
    1. Noone A.M., Howlader N., Krapcho M., Miller D., Brest A., Yu M., Ruhl J., Tatalovich Z., Mariotto A., Lewis D.R., et al. SEER Cancer Statistics Review 1975–2015. National Cancer Institute; Bethesda, MD, USA: Apr, 2018.
    1. Schulman C.C., Altwein J.E., Zlotta A.R. Treatment options after failure of local curative treatments in prostate cancer: A controversial issue. BJU Int. 2000;86:1014–1022. doi: 10.1046/j.1464-410x.2000.00941.x. - DOI - PubMed
    1. Pound C.R., Partin A.W., Epstein J.I., Walsh P.C. Prostate-specific antigen after anatomic radical retropubic prostatectomy. Patterns of recurrence and cancer control. Urol. Clin. N. Am. 1997;24:395–406. doi: 10.1016/S0094-0143(05)70386-4. - DOI - PubMed
    1. Moul J.W. Prostate specific antigen only progression of prostate cancer. J. Urol. 2000;163:1632–1642. doi: 10.1016/S0022-5347(05)67511-8. - DOI - PubMed