. 2021 Dec 6;9(12):2516.
doi: 10.3390/microorganisms9122516.

Comparative Analysis of Salmon Cell Lines and Zebrafish Primary Cell Cultures Infection with the Fish Pathogen Piscirickettsia salmonis

Affiliations

Comparative Analysis of Salmon Cell Lines and Zebrafish Primary Cell Cultures Infection with the Fish Pathogen Piscirickettsia salmonis

Javiera Ortiz-Severín et al. Microorganisms. .

Abstract

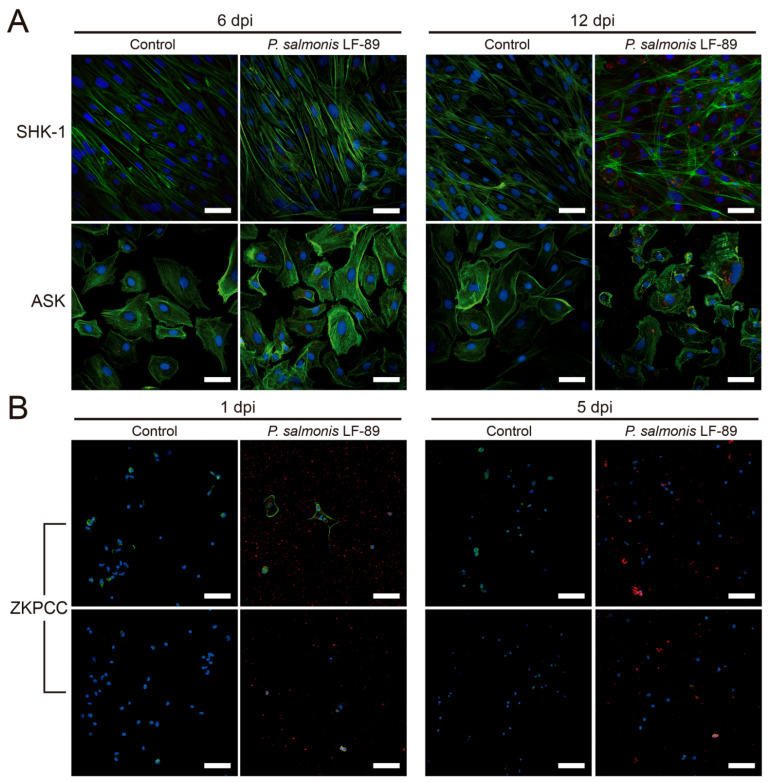
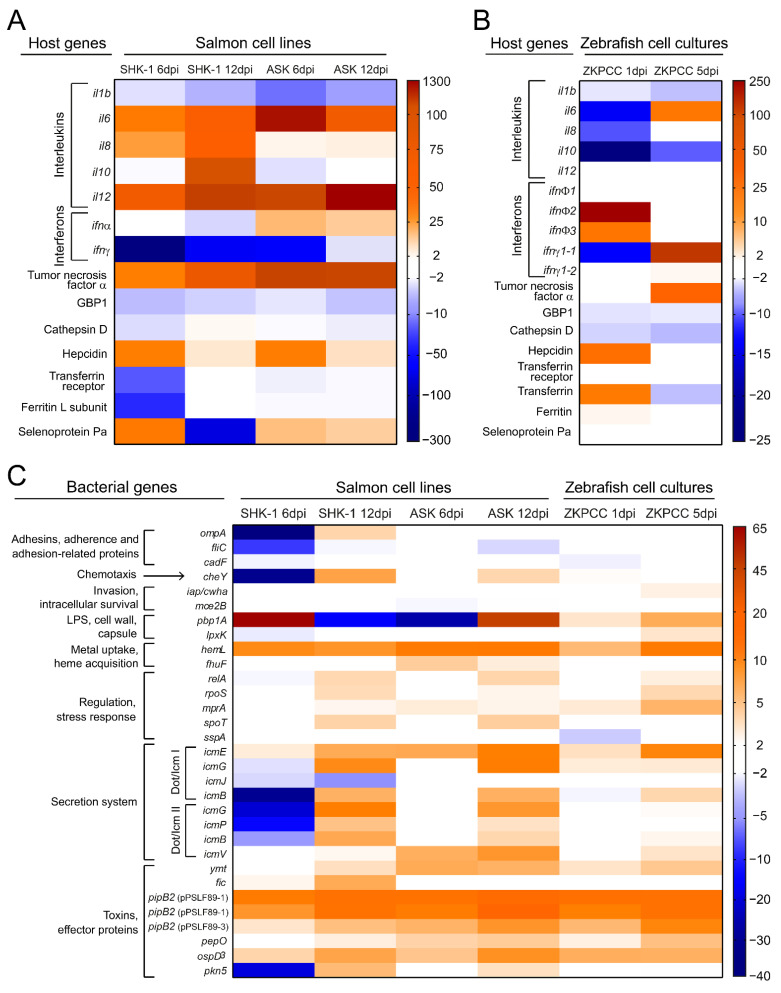
Piscirickettsia salmonis is the etiologic agent of piscirickettsiosis, a disease that causes significant losses in the salmon farming industry. In order to unveil the pathogenic mechanisms of P. salmonis, appropriate molecular and cellular studies in multiple cell lines with different origins need to be conducted. Toward that end, we established a cell viability assay that is suitable for high-throughput analysis using the alamarBlue reagent to follow the distinct stages of the bacterial infection cycle. Changes in host cell viability can be easily detected using either an absorbance- or fluorescence-based plate reader. Our method accurately tracked the infection cycle across two different Atlantic salmon-derived cell lines, with macrophage and epithelial cell properties, and zebrafish primary cell cultures. Analyses were also carried out to quantify intracellular bacterial replication in combination with fluorescence microscopy to visualize P. salmonis and cellular structures in fixed cells. In addition, dual gene expression analysis showed that the pro-inflammatory cytokines IL-6, IL-12, and TNFα were upregulated, while the cytokines IL1b and IFNγ were downregulated in the three cell culture types. The expression of the P. salmonis metal uptake and heme acquisition genes, together with the toxin and effector genes ospD3, ymt, pipB2 and pepO, were upregulated at the early and late stages of infection regardless of the cell culture type. On the other hand, Dot/Icm secretion system genes as well as stationary state and nutrient scarcity-related genes were upregulated only at the late stage of P. salmonis intracellular infection. We propose that these genes encoding putative P. salmonis virulence factors and immune-related proteins could be suitable biomarkers of P. salmonis infection. The infection protocol and cell viability assay described here provide a reliable method to compare the molecular and cellular changes induced by P. salmonis in other cell lines and has the potential to be used for high-throughput screenings of novel antimicrobials targeting this important fish intracellular pathogen.

Keywords: P. salmonis virulence; cell culture viability; host–pathogen interaction; infection biomarkers; kidney primary cell culture; salmon cell lines; zebrafish.


Conflict of interest statement

The authors declare no conflict of interest.

Figures

Figure 1
Figure 1
Standardization of cellular viability assays. Schematic representation of the protocol to monitor cell viability with alamarBlue in SHK-1 and ASK salmon cell lines (A), and for zebrafish kidney primary cell cultures (ZPCC) (C). Incubation with alamarBlue was carried out for 4, 6, 8, 24 and 48 h before fluorescence quantifications, at 16 °C for the cell lines and 20 °C for the ZKPCC. Fluorescence (in arbitrary units) emitted by different number of seeded cells is shown for the cell lines in (B) and ZKPCC in (D). Fluorescence was measured at 530–550 nm for excitation and 600 nm for emission. Red arrows indicate the number of cells and the incubation time chosen for subsequent experiments and correspond to 10,000 cells and 8 h of alamarBlue incubation for cell the lines, and 300,000 cells with 24 h of incubation for the zebrafish cultures (ZKPCC). The detection limit corresponds to the last fluorescence measurement different than zero; in the selected conditions, the detection limit was ~150 cells for SHK-1, ~250 cells for ASK and ~30,000 for the kidney primary culture cells. Viability of cells over time, measured as fluorescence emitted after reduction of alamarBlue in the selected conditions for each cell type, is shown for the three types of cultures in (E).
Figure 2
Figure 2
Effect of P. salmonis infection in the viability of SHK-1, ASK and zebrafish primary cell cultures. (A) Viability assay and infection protocol for SHK-1 and ASK cell lines. After a three-day incubation period with the bacteria, cultures were washed with fresh media supplemented with gentamicin to kill extracellular bacteria, and the cell viability was monitored over time. SHK-1 (B) or ASK (D) viability over time measured by alamarBlue, and percent viability (the measured viability of a culture at a given time point relative to the viability of cells at day 0 after gentamicin treatment) is shown in the graphs. An average of three independent assays with six wells each, with the correspondent standard deviation, is shown. Asterisks represent statistically significant differences between control and infected cultures at each time point (** p < 0.01, *** p < 0.001, **** p < 0.0001). Representative microphotographs of SHK-1 (C) or ASK (E) cultures 12 dpi with P. salmonis or bacterial culture media as control. Red arrowheads indicate examples of vacuoles. Image with 100× amplification, bar represents 100 µm. (F) Viability assay and infection protocol for ZKPCC. After 1 day of incubation with the bacteria, the cells were washed with fresh media supplemented with gentamicin to kill extracellular bacteria and the cell viability was monitored over time. (G) ZKPCC cell viability over time measured by alamarBlue. Percent viability represents the measured viability of a culture at a given time point relative to the viability of cells at day 0. The average of three independent assays with five wells each, with the correspondent standard deviation, is shown. Asterisks represent statistically significant differences between control and infected cultures at each time point (* p < 0.05, ** p < 0.01). (H) Representative microphotographs of ZKPCC at 5 dpi to P. salmonis or bacterial culture media as a control. Image with 400× amplification, bar represents 500 µm.
Figure 3
Figure 3
Identification of mpx-, mpeg-1- and nos2a-expressing cells in zebrafish kidney primary cell cultures. Relative gene expression was quantified after 1- and 5-dpi with P. salmonis or culture medium as control. Gene expression is expressed as relative to the housekeeping genes. Dotted lines indicate non-significant changes in expression levels (between 0.5- and 2-fold). Asterisks show significant differences compared to control samples (two-way ANOVA with Fisher’s post-test for multiple comparisons, * p < 0.05).
Figure 4
Figure 4
P. salmonis quantification inside infected cell cultures. The expression of bacterial housekeeping genes recF and rho in salmon cell lines (SHK-1 and ASK) or primary cell cultures (ZKPCC) at early- and late-stage infections (6 and 12 dpi for cell lines, and 1 and 5 dpi for ZKPCC) was quantified. Total number of bacteria was inferred from a standard curve (number of bacteria vs. Ct). (A) Number of intracellular bacteria at early- and late-stage infections in the three cell cultures. An unpaired t-test between early- and late-infection stages was performed for each cell culture, asterisks show statistical differences (* p < 0.05, *** p < 0.001 and **** p < 0.0001). (B) Fold-change of intracellular bacteria between early- and late-stage infections in the three cell cultures. A one-way ANOVA with Tukey’s multiple comparisons test was performed, asterisks show statistical differences (*** p < 0.001).
Figure 5
Figure 5
Immunofluorescence microscopy of P. salmonis-infected salmon cell lines and zebrafish primary cell cultures. (A) P. salmonis-infected and mock-infected (control) salmon cell lines SHK-1 and ASK were fixated before fluorescence staining after 6 and 12 dpi. (B) P. salmonis-infected and mock-infected (control) zebrafish primary cultures (ZKPCC) were fixated after 1 and 5 dpi. Both panels show representative images of zebrafish cells with different cell types. For the three cultures, cellular actin was stained with phalloidin in green (Alexa Fluor 488®), and the nucleus in blue with DAPI. Polyclonal antibodies against P. salmonis and a secondary antibody coupled with Alexa Fluor 594® marked the bacteria in red. Bar represents 50 µm. Images obtained at each channel are provided in Figure S3.
Figure 6
Figure 6
Host and pathogen biomarker’s gene expression during P. salmonis infection. Heat map showing relative transcript abundance of immune-related genes in P. salmonis-infected cultures and virulence factor genes in P. salmonis at early- and late-stage infections. (A) Expression level of host biomarkers in SHK-1 and ASK cell lines at 6- and 12-dpi. (B) Expression level of host biomarkers in ZKPCC at 1- and 5-dpi. In (A,B), the gene expression of cell cultures infected with P. salmonis is presented as relative to uninfected cell cultures. (C) The gene expression of P. salmonis biomarkers during infection inside cell cultures is presented as relative to P. salmonis growing in Austral-SRS medium. The average of ΔΔCt values for three independent replicates is shown in all heat maps, and non-significant values (between +2- and −2-fold changes) are shown in white.

Similar articles

Cited by

References

    1. Fryer J.L., Lannan C.N., Giovannoni S.J., Wood N.D. Piscirickettsia salmonis gen. nov., sp. nov., the causative agent of an epizootic disease in salmonid fishes. Int. J. Syst. Bacteriol. 1992;42:120–126. doi: 10.1099/00207713-42-1-120. - DOI - PubMed
    1. Mauel M.J., Giovannoni S.J., Fryer J.L. Phylogenetic analysis of Piscirickettsia salmonis by 16S, internal transcribed spacer (ITS) and 23S ribosomal DNA sequencing. Dis. Aquat. Organ. 1999;35:115–123. doi: 10.3354/dao035115. - DOI - PubMed
    1. Almendras F.E., Fuentealba I.C. Salmonid rickettsial septicemia caused by Piscirickettsia salmonis: A review. Dis. Aquat. Organ. 1997;29:137–144. doi: 10.3354/dao029137. - DOI
    1. Rozas M., Enríquez R., Enr R. Piscirickettsiosis and Piscirickettsia salmonis in fish: A review. J. Fish Dis. 2014;37:163–188. doi: 10.1111/jfd.12211. - DOI - PubMed
    1. Mauel M.J., Miller D.L. Piscirickettsiosis and piscirickettsiosis-like infections in fish: A review. Vet. Microbiol. 2002;87:279–289. doi: 10.1016/S0378-1135(02)00085-8. - DOI - PubMed

LinkOut - more resources