. 2021 Dec 17;26(24):7660.
doi: 10.3390/molecules26247660.

Synthesis and Characterization of Andrographolide Derivatives as Regulators of βAPP Processing in Human Cells

Affiliations

Synthesis and Characterization of Andrographolide Derivatives as Regulators of βAPP Processing in Human Cells

Arpita Dey et al. Molecules. .

Abstract

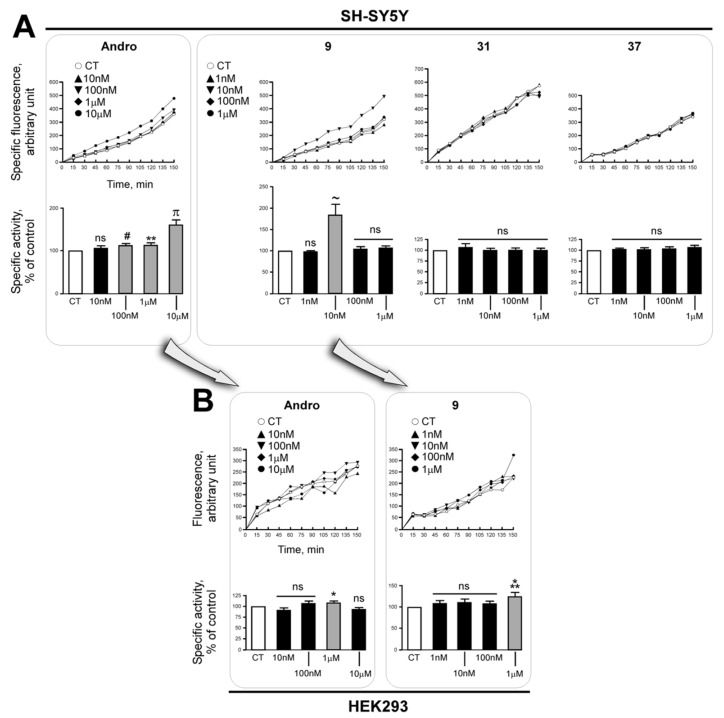
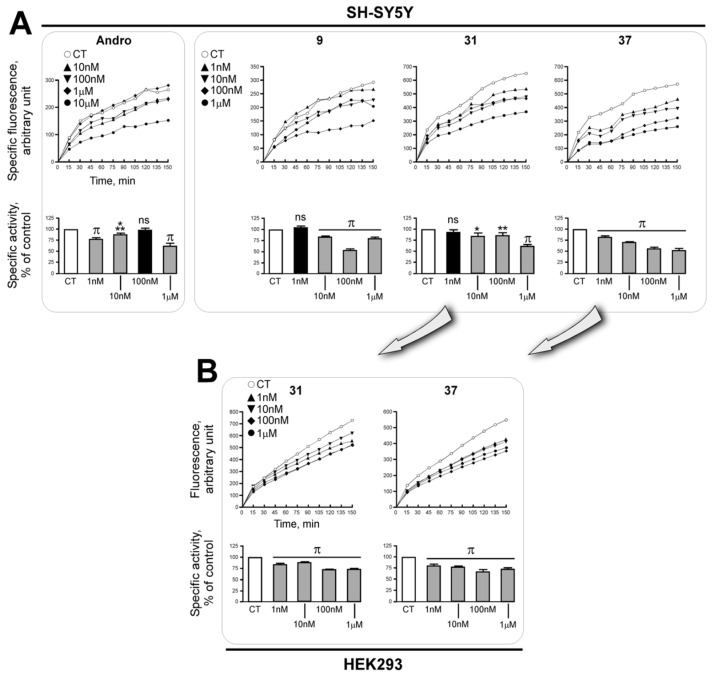
Alzheimer's disease (AD) is a devastating neurodegenerative disorder, one of the main characteristics of which is the abnormal accumulation of amyloid peptide (Aβ) in the brain. Whereas β-secretase supports Aβ formation along the amyloidogenic processing of the β-amyloid precursor protein (βAPP), α-secretase counterbalances this pathway by both preventing Aβ production and triggering the release of the neuroprotective sAPPα metabolite. Therefore, stimulating α-secretase and/or inhibiting β-secretase can be considered a promising anti-AD therapeutic track. In this context, we tested andrographolide, a labdane diterpene derived from the plant Andrographis paniculata, as well as 24 synthesized derivatives, for their ability to induce sAPPα production in cultured SH-SY5Y human neuroblastoma cells. Following several rounds of screening, we identified three hits that were subjected to full characterization. Interestingly, andrographolide (8,17-olefinic) and its close derivative 14α-(5',7'-dichloro-8'-quinolyloxy)-3,19-acetonylidene (compound 9) behave as moderate α-secretase activators, while 14α-(2'-methyl-5',7'-dichloro-8'-quinolyloxy)-8,9-olefinic compounds 31 (3,19-acetonylidene) and 37 (3,19-diol), whose two structures are quite similar although distant from that of andrographolide and 9, stand as β-secretase inhibitors. Importantly, these results were confirmed in human HEK293 cells and these compounds do not trigger toxicity in either cell line. Altogether, these findings may represent an encouraging starting point for the future development of andrographolide-based compounds aimed at both activating α-secretase and inhibiting β-secretase that could prove useful in our quest for the therapeutic treatment of AD.

Keywords: Alzheimer’s disease; andrographolide; neuroprotection; α-secretase; β-secretase; βAPP.


Conflict of interest statement

The authors declare no conflict of interest.

Figures

Scheme 1
Scheme 1
Reagents and conditions: (a) Ph3P, DIAD with 4, 5, or 6 by Mitsunobu reaction; (b) MeOH/H2O (4/1), TsOH·H2O, 20 °C.
Scheme 2
Scheme 2
Reagents and conditions: (a) acylation (X = Cl) by Et3N and 4-nitrobenzoyl chloride in DCM; (b) Mitsunobu reaction (X = OH) by Ph3P, DIAD and 4-nitrobenzoic acid in THF; (c) 85% H3PO4; (d) anhydrous DCM, 2,2-dimethoxypropane, PPTS, 40 °C; (e) Li2CO3, MeOH; (f) 25 or 26, Ph3P, DIAD with 4, 5, or 6 by Mitsunobu reaction; (g) MeOH/H2O (4/1), TsOH·H2O, 20 °C.
Figure 1
Figure 1
Screening of andrographolide and andrographolide derivatives for sAPPα secretion, βAPP protein levels, and the ratio sAPPα/βAPP in SH-SY5Y cells. (A) illustrates the Western blot analysis of the screening. Bars in (B) (sAPPα production) and (C) (ratio of sAPPα to βAPP normalized with β-actin) correspond to the densitometric analyses, are expressed as a percentage of control (white bars, non-treated cells) and are the average of the comparison with two controls. The black circles indicate compounds selected for further characterization. The hatched black line in (A) indicates a splicing of the original gels.
Figure 2
Figure 2
Effect of andrographolide and the selected andrographolide derivatives on sAPPα secretion, βAPP protein levels and the ratio sAPPα/βAPP in SH-SY5Y cells. (A) illustrates one representative gel. Bars in (B) (sAPPα production), (C) (βAPP immunoreactivity normalized with β-actin), and (D) (ratio of sAPPα to βAPP normalized with β-actin) correspond to the densitometric analyses, are expressed as a percentage of control (white bars, non-treated cells), and are the means ±SE of 6 to 10 independent determinations. * p < 0.05; ** p < 0.03; *** p < 0.02; # p < 0.01; @ p < 0.001; ns, no statistical difference. The hatched black line in (A) indicates a splicing of the original gels.
Figure 3
Figure 3
Andrographolide and compounds 9, 31, and 37 do not trigger toxicity in SH-SY5Y cells. Cells were incubated without (control, white bar) or with three concentrations (100 nM, 1 μM, and 10 μM) of the four compounds for 24 h and cell viability was determined with the MTT assay. The results are expressed as the mean of quadruplicates and no statistical difference were observed.
Figure 4
Figure 4
Effects of andrographolide and compounds 9, 31, and 37 at different doses on sAPPα secretion, βAPP protein levels, and the ratio sAPPα/βAPP in human cells. Data presented in (A) (sAPPα production), (B) (βAPP immunoreactivity normalized with β-actin), and (C) (ratio of sAPPα to βAPP normalized with β-actin) are from experiments carried out in SH-SY5Y cells while data in (D) correspond to the results obtained for 37 in HEK293 cells. All bars are the densitometric analyses, are expressed as a percentage of control (white bars, non-treated cells) and are the means ±SE of 9 to 20 independent determinations. * p < 0.05; ** p < 0.03; *** p < 0.02; # p < 0.01; ~ p < 0.003; & p < 0.002; @ p < 0.001; $ p < 0.0002; π p < 0.0001 (gray bars); ns, no statistical difference (black bars). The upper parts of each panel illustrate representative gels.
Figure 5
Figure 5
Effects of andrographolide and compounds 9, 31, and 37 on ADAM10 and BACE1 expression in human cells. ADAM10 and BACE1 protein (AC) and mRNA (D,E) levels were measured (by Western blot and real-time qPCR, respectively) in the indicated cell lines following treatment without (control, white bar) or with various concentrations of the compounds (1 nM to 1 μM). Bars are the densitometric analyses, are expressed as a percentage of control (white bars, non-treated cells), and are the means ±SE of 11 to 18 (Western blots) and 4 (qPCR) independent determinations. * p < 0.03; ** p < 0.01 (gray bars); ns, no statistical difference (black bars). The upper parts of panels A and B illustrate representative gels.
Figure 6
Figure 6
Effects of andrographolide and compounds 9, 31, and 37 on the α-secretase catalytic activity in human cells. (A) The α-secretase catalytic activity (phenanthroline-sensitive hydrolysis of the fluorimetric substrate JMV2770) was measured on cultured SH-SY5Y cells in the absence (control, white circle/white bar) or in the presence of various concentrations of the compounds (10 nM to 10 μM for andrographolide; 1 nM to 1 μM for compounds 9, 31, and 37). (B) Experiments carried out with andrographolide and 9 under the same conditions on cultured HEK293 cells. The curves represent the mean specific fluorescence (from 2 to 3 independent experiments including two controls each) while bars in histograms are expressed as a percentage of control (white bars, non-treated cells) calculated from the linear parts of the curves (initial velocity) and are the means ±SE of 8 to 16 independent determinations. * p < 0.05; ** p < 0.03; *** p < 0.02; # p < 0.01; ~ p < 0.003; π p < 0.0001 (gray bars); ns, no statistical difference (black bars).
Figure 7
Figure 7
Effects of andrographolide and compounds 9, 31, and 37 on the β-secretase catalytic activity in human cells. (A) The β-secretase catalytic activity (JMV1197-sensitive hydrolysis of the fluorimetric substrate JMV2236) was measured in SH-SY5Y cell extracts in the absence (control, white circle/white bar) or in the presence of various concentrations of the compounds (1 nM to 1 μM for andrographolide; 1 nM to 1 mM for compounds 9, 31, and 37). (B) Experiments carried out with 31 and 37 under the same conditions in HEK293 cell extracts. The curves represent the mean specific fluorescence (from 2 to 3 independent experiments including two controls each) while bars in histograms are expressed as a percentage of control (white bars, non-treated cells) calculated from the linear parts of the curves (initial velocity) and are the means ±SE of 6 to 15 independent determinations. * p < 0.05; ** p < 0.03; *** p < 0.02; π p < 0.0001 (gray bars); ns, no statistical difference (black bars).

References

    1. Querfurth H.W., LaFerla F.M. Alzheimer’s disease. N. Engl. J. Med. 2010;362:329–344. doi: 10.1056/NEJMra0909142. - DOI - PubMed
    1. Agostinho P., Pliassova A., Oliveira C.R., Cunha R.A. Localization and trafficking of amyloid-β protein precursor protein and secretases: Impact on Alzheimer’s disease. J. Alzheimers. Dis. 2015;45:329–347. doi: 10.3233/JAD-142730. - DOI - PubMed
    1. Mockett B.G., Richter M., Abraham W.C., Muller U.C. Therapeutic potential of secreted amyloid precursor protein APPsα. Front. Mol. Neurosci. 2017;10:30. doi: 10.3389/fnmol.2017.00030. - DOI - PMC - PubMed
    1. Vincent B., Govitrapong P. Activation of the α-secretase processing of AβPP as a therapeutic approach in Alzheimer’s disease. J. Alzheimers Dis. 2011;24:75–94. doi: 10.3233/JAD-2011-110218. - DOI - PubMed
    1. Wang Y.Q., Qu D.H., Wang K. Therapeutic approaches to Alzheimer’s disease through stimulating of non-amyloidogenic processing of amyloid precursor protein. Eur. Rev. Med. Pharmacol. Sci. 2016;20:2389–2403. - PubMed

MeSH terms