

Validity and Prognostic Value of a Polygenic Risk Score for Parkinson's Disease
- PMID: 34946808
- PMCID: PMC8700849
- DOI: 10.3390/genes12121859
Validity and Prognostic Value of a Polygenic Risk Score for Parkinson's Disease
Abstract
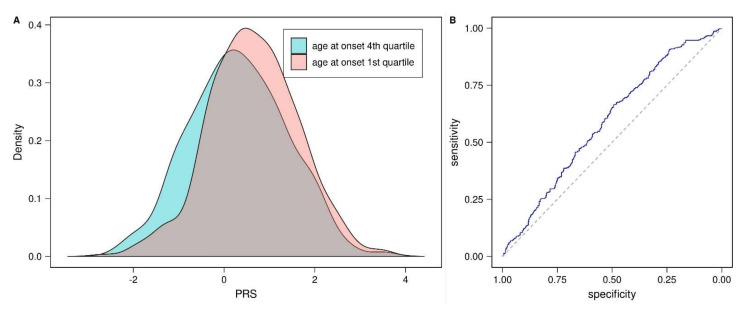
Idiopathic Parkinson's disease (PD) is a complex multifactorial disorder caused by the interplay of both genetic and non-genetic risk factors. Polygenic risk scores (PRSs) are one way to aggregate the effects of a large number of genetic variants upon the risk for a disease like PD in a single quantity. However, reassessment of the performance of a given PRS in independent data sets is a precondition for establishing the PRS as a valid tool to this end. We studied a previously proposed PRS for PD in a separate genetic data set, comprising 1914 PD cases and 4464 controls, and were able to replicate its ability to differentiate between cases and controls. We also assessed theoretically the prognostic value of the PD-PRS, i.e., its ability to predict the development of PD in later life for healthy individuals. As it turned out, the PD-PRS alone can be expected to perform poorly in this regard. Therefore, we conclude that the PD-PRS could serve as an important research tool, but that meaningful PRS-based prognosis of PD at an individual level is not feasible.
Keywords: Parkinson’s disease; genetic risk; polygenic risk score; prognostic value; replication; validation.
Conflict of interest statement
C.K. serves as a medical advisor for genetic testing reports in the field of movement disorders and dementia, but excluding Parkinson’s disease, to Centogene and as a member of the Scientific Advisory Board of Retromer Therapeutics. N.B. has previously served as a consultant for Centogene GmbH. The other authors declare no conflict of interest. The funders had no role in the design of the study; in the collection, analyses, or interpretation of data; in the writing of the manuscript, or in the decision to publish the results.
Figures
References
-
- Nalls M.A., Blauwendraat C., Vallerga C.L., Heilbron K., Bandres-Ciga S., Chang D., Tan M., Kia D.A., Noyce A.J., Xue A., et al. Identification of novel risk loci, causal insights, and heritable risk for Parkinson’s disease: A meta-analysis of genome-wide association studies. Lancet Neurol. 2019;18:1091–1102. doi: 10.1016/S1474-4422(19)30320-5. - DOI - PMC - PubMed
-
- Chang D., Nalls M.A., Hallgrimsdottir I.B., Hunkapiller J., van der Brug M., Cai F., International Parkinson’s Disease Genomics Consortium. 23andMe Research Team. Kerchner G.A., Ayalon G., et al. A meta-analysis of genome-wide association studies identifies 17 new Parkinson’s disease risk loci. Nat. Genet. 2017;49:1511–1516. doi: 10.1038/ng.3955. - DOI - PMC - PubMed
-
- Nalls M.A., Pankratz N., Lill C.M., Do C.B., Hernandez D.G., Saad M., DeStefano A.L., Kara E., Bras J., Sharma M., et al. Large-scale meta-analysis of genome-wide association data identifies six new risk loci for Parkinson’s disease. Nat. Genet. 2014;46:989–993. doi: 10.1038/ng.3043. - DOI - PMC - PubMed
Publication types
MeSH terms
LinkOut - more resources
Full Text Sources
Medical
Research Materials
