

A Case of Inherited t(4;10)(q26;q26.2) Chromosomal Translocation Elucidated by Multiple Chromosomal and Molecular Analyses. Case Report and Review of the Literature
- PMID: 34946906
- PMCID: PMC8701147
- DOI: 10.3390/genes12121957
A Case of Inherited t(4;10)(q26;q26.2) Chromosomal Translocation Elucidated by Multiple Chromosomal and Molecular Analyses. Case Report and Review of the Literature
Abstract
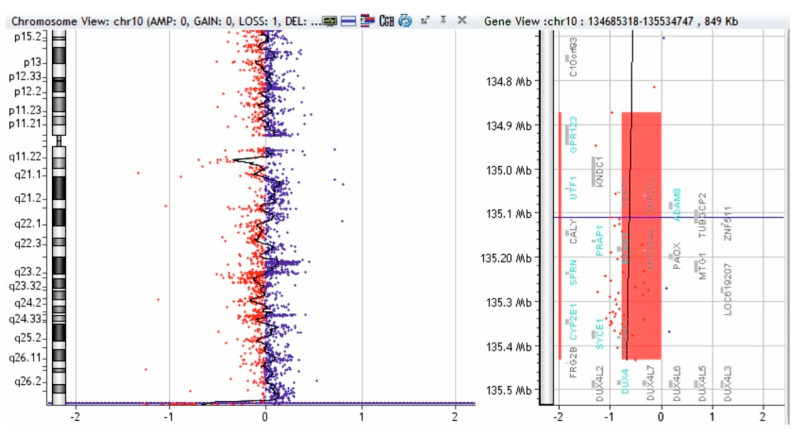
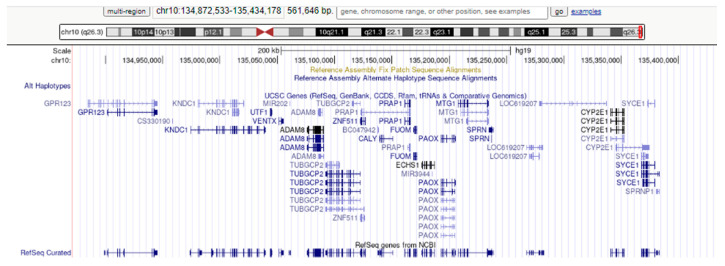
We present a complex chromosomal anomaly identified using cytogenetic and molecular methods. The child was diagnosed during the neonatal period with a multiple congenital anomalies syndrome characterized by: flattened occipital region; slight turricephaly; tall and broad forehead; hypertelorism; deep-set eyes; down slanting and short palpebral fissures; epicanthic folds; prominent nose with wide root and bulbous tip; microstomia; micro-retrognathia, large, short philtrum with prominent reliefs; low set, prominent ears; and congenital heart disease. The GTG banding karyotype showed a 46,XY,der(10)(10pter→10q26.2::4q26→4qter) chromosomal formula and his mother presented an apparently balanced reciprocal translocation: 46,XX,t(4;10)(q26;q26.2). The chromosomal anomalies of the child were confirmed by MLPA, and supplementary investigation discovered a quadruplication of the 4q35.2 region. The mother has a triplication of the same chromosomal fragment (4q35.2). Using array-CGH, we described the anomalies completely. Thus, the boy has a 71,057 kb triplication of the 4q26-q35.2 region, a 562 kb microdeletion in the 10q26.3 region, and a 795 kb quadruplication of the 4q35.2 region, while the mother presents a 795 kb triplication of the 4q35.2 region. Analyzing these data, we consider that the boy's phenotype is influenced only by the 4q partial trisomy. We compare our case with similar cases, and we review the literature data.
Keywords: 10q microdeletion; 4q partial trisomy; 4q35.2 triplication; cytogenetic analyses; multiple congenital anomalies syndrome.
Conflict of interest statement
The authors declare no conflict of interest.
Figures


Similar articles
-
[Cytogenetic and molecular characterization of partial trisomy 4q and partial monosomy 10q in a patient].Zhonghua Yi Xue Yi Chuan Xue Za Zhi. 2010 Apr;27(2):153-7. doi: 10.3760/cma.j.issn.1003-9406.2010.02.008. Zhonghua Yi Xue Yi Chuan Xue Za Zhi. 2010. PMID: 20376795 Chinese.
-
A child with multiple congenital anomalies due to partial trisomy 7q22.1 → qter resulting from a maternally inherited balanced translocation: a case report and review of literature.BMC Med Genomics. 2018 May 8;11(1):44. doi: 10.1186/s12920-018-0366-6. BMC Med Genomics. 2018. PMID: 29739404 Free PMC article.
-
A severely mental and motor retarded boy with monosomy 9pter-->p22 trisomy 10q26-->qter due to paternal reciprocal translocation 46,XY,t(9;10)(p23;q26).Genet Couns. 2011;22(4):417-23. Genet Couns. 2011. PMID: 22303803
-
An unusual clinical characterization of a male with distal partial trisomy 1q42.1 and monosomy 4q35.1 and review of the literature.Genet Couns. 2006;17(4):435-40. Genet Couns. 2006. PMID: 17375530 Review.
-
An infant with trisomy 9 and partial trisomy 12 derived from maternal balanced translocation: A case report and literature review.J Int Med Res. 2024 Nov;52(11):3000605241300093. doi: 10.1177/03000605241300093. J Int Med Res. 2024. PMID: 39612314 Free PMC article. Review.
Cited by
-
Genetic Counseling and Management: The First Study to Report NIPT Findings in a Romanian Population.Medicina (Kaunas). 2022 Jan 5;58(1):79. doi: 10.3390/medicina58010079. Medicina (Kaunas). 2022. PMID: 35056387 Free PMC article.
-
Approach and Management of Pregnancies with Risk Identified by Non-Invasive Prenatal Testing.J Pers Med. 2024 Mar 29;14(4):366. doi: 10.3390/jpm14040366. J Pers Med. 2024. PMID: 38672993 Free PMC article.
References
-
- World Health Organization Congenital Anomalies. [(accessed on 12 February 2021)]. Available online: https://www.who.int/health-topics/congenital-anomalies#tab=tab.
-
- Covic M., Ştefănescu D., Sandovici I., Gorduza E.V. Genetică Medicală. 3rd ed. Polirom; Iaşi, Romania: 2017.
-
- Surana R.B., Conen P.E. Partial trisomy 4 resulting from a 4-18 reciprocal translocation. Ann. Génét. 1972;15:191–194. - PubMed
Publication types
MeSH terms
Supplementary concepts
LinkOut - more resources
Full Text Sources
