. 2021 Dec 8;12(12):1958.
doi: 10.3390/genes12121958.

Optical Genome Mapping in Routine Human Genetic Diagnostics-Its Advantages and Limitations

Affiliations

Optical Genome Mapping in Routine Human Genetic Diagnostics-Its Advantages and Limitations

Paul Dremsek et al. Genes (Basel). .

Abstract

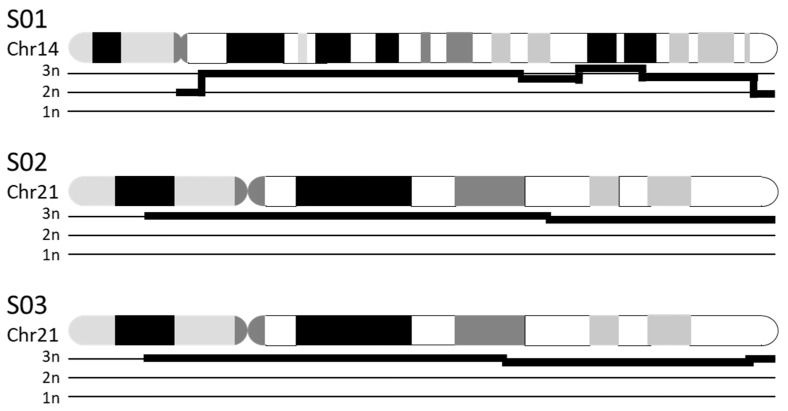
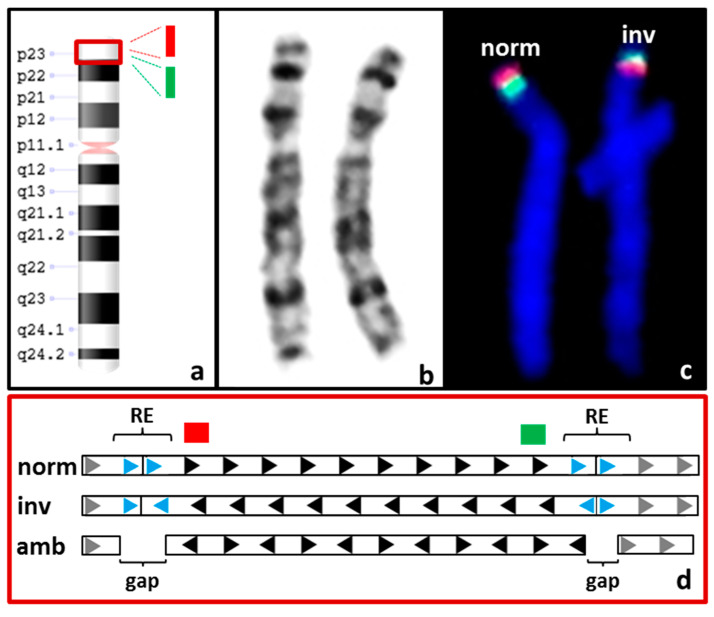
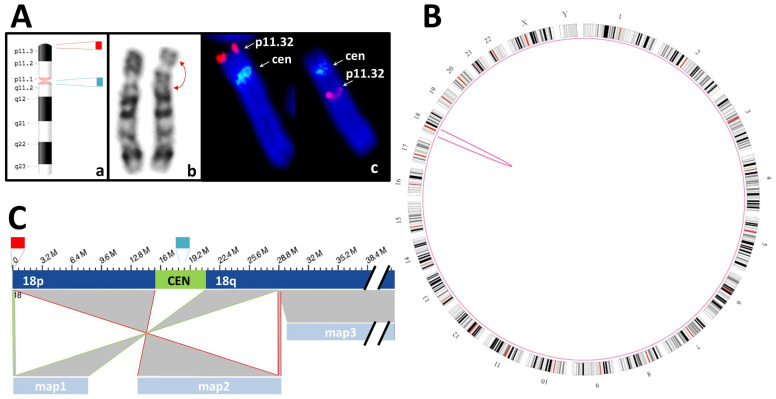
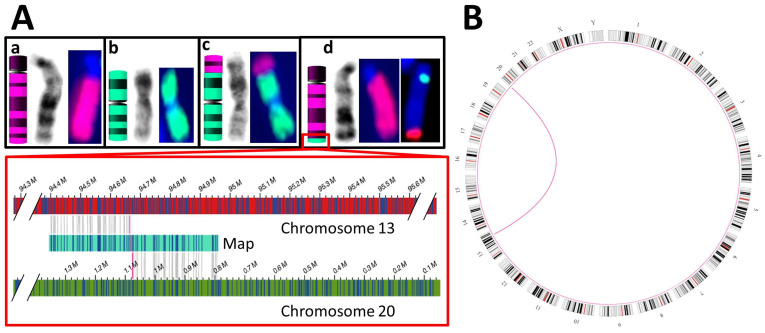
In recent years, optical genome mapping (OGM) has developed into a highly promising method of detecting large-scale structural variants in human genomes. It is capable of detecting structural variants considered difficult to detect by other current methods. Hence, it promises to be feasible as a first-line diagnostic tool, permitting insight into a new realm of previously unknown variants. However, due to its novelty, little experience with OGM is available to infer best practices for its application or to clarify which features cannot be detected. In this study, we used the Saphyr system (Bionano Genomics, San Diego, CA, USA), to explore its capabilities in human genetic diagnostics. To this end, we tested 14 DNA samples to confirm a total of 14 different structural or numerical chromosomal variants originally detected by other means, namely, deletions, duplications, inversions, trisomies, and a translocation. Overall, 12 variants could be confirmed; one deletion and one inversion could not. The prerequisites for detection of similar variants were explored by reviewing the OGM data of 54 samples analyzed in our laboratory. Limitations, some owing to the novelty of the method and some inherent to it, were described. Finally, we tested the successful application of OGM in routine diagnostics and described some of the challenges that merit consideration when utilizing OGM as a diagnostic tool.

Keywords: OGM; cytogenetics; cytogenomics; numerical chromosomal aberrations; optical genome mapping; routine genetic testing; structural chromosomal aberrations.


Conflict of interest statement

The authors declare no conflict of interest.

Figures

Figure 1
Figure 1
Schematic representation of Optical Genome Mapping (OGM) data to visualize trisomies. Free trisomies such as the depicted trisomies 14 (S01) and 21 (S02, S03) are detected by quantification of uniquely attributable genomic material, similar to the data obtained by aCGH. The graphs (bold black lines) underneath the ideograms (G-banding, black and gray: Giemsa positive, white: Giemsa negative) show the relative quantity of genetic material from chromosomes 14 and 21. In all three cases, the graphs show an elevated quantity of DNA, equaling three copies of each depicted chromosome. Centromeric regions and nonunique segments of the p-arms cannot be quantified, even though the continuous graphs suggest otherwise.
Figure 2
Figure 2
Inversion inv(8p23.1). The polymorphic inversion inv(8p23.1) of case S04 (a) is too small to be visible by karyotyping with GTG banding (b). Hence, it was initially detected by FISH analysis (c) using orange and green fluorescent probes that bind specifically to the inverted region (see orange and green fluorescent signals, blue: DAPI staining, the binding sites of the probes are indicated in (a,d) as green and orange blocks). Chromosome 8 carrying the inversion is depicted on the right (inv), with its green fluorescence signal above the orange signal, compared to normal chromosome 8 (norm) on the left side. (d) The repetitive elements (REs, represented by blue arrows) flank the segment that is proposed to be affected by the inversion (represented by black arrows). Gray arrows represent the surrounding sequences on chromosome 8p. When no inversion is present (norm), all arrows of the graphic representation are rightward oriented. When the inversion is present (inv), the arrows of the inverted segment are leftward oriented. The maps generated by OGM for case S04 did not span either RE (amb), leaving gaps and hence providing no frame of reference for the orientation of the segment between the REs. This creates ambiguity, where the inversion can be neither confirmed nor ruled out (represented by arrows with alternating orientation). By default, the Saphyr OGM system assumes the segment to be oriented correctly.
Figure 3
Figure 3
Inversion inv(18)(p11.3q12). (A): The pericentric inversion inv(18)(p11.3q12) of case S05 (a) can be detected by karyotyping with GTG banding (b) as well as by FISH analysis (c). The latter was done using orange and green fluorescent probes that bind specifically to the subtelomeric region of the p-arm of chromosome 18 and the centromere, respectively (see orange and green fluorescence signals, blue: DAPI staining). Normal chromosome 18 is on the left, whereas chromosome 18 carrying the inversion is on the right. (B): Circos plot with the ideograms of the 24 chromosomes (G-banding, black and gray: Giemsa positive, white: Giemsa negative, red: Centromere), generated by the Saphyr system, showing a pink arc at chromosome 18 protruding inwards from the breakpoints of the inversion. (C): Representation of a portion of chromosome 18 and the corresponding OGM maps (18p: full p-arm of chromosome 18; CEN: centromere; 18q: q-arm of chromosome 18, with its distal segment cropped; map1 through map3). The maps are connected to the segments with which they align by gray areas. Map1 aligns to a small, distal segment of the p-arm as well as to a large portion of the proximal q-arm (highlighted by green lines). Map2 aligns to a small segment of the q-arm as well as to a large portion of the proximal p-arm (highlighted by red lines). Map3 covers the rest of the q-arm. Maps 1 and 2 suggest that a pericentric inversion has taken place. As they are not continuous but separated by the centromere, the OGM system calls the SV as two intrachromosomal translocations.
Figure 4
Figure 4
Translocation t(13;20)(q32;p13). (A): Normal chromosomes 13 (a, pink) and 20 (b, green) are depicted from left to right as ideograms, stained with GTG banding and labeled with whole-chromosome paint (WCP) FISH probes specific for chromosomes 13 and 20, respectively. In (c), a variant chromosome 20 is depicted, carrying at its p-arm the terminal portion of the q-arm of chromosome 13. This portion is detectable by GTG banding and WCP-FISH. In (d), the variant chromosome 13 is depicted, carrying at its q-arm the terminal portion of the p-arm of chromosome 20. This portion is too small to be detectable by either GTG banding or WCP-FISH. Therefore, FISH probes specific for the subtelomeric region of the p-arm of chromosome 20 (red) and the centromere of chromosome 13 (green) were used. In the rightmost image of (d), it is shown that chromosome 13, labeled green at its centromere, carries the subtelomeric region of the p-arm of chromosome 20. The red box shows a close-up view of this breakpoint: here, the left portion of an OGM map (light blue) is aligned to the q-arm of chromosome 13, whereas its right portion is aligned to the p-arm of chromosome 20 (alignment matches indicated by vertical gray lines). The transition between alignments to chromosome 13 and chromosome 20 delineates the breakpoint (shown as vertical red lines). Notably, the map covering the breakpoint is only 500 kbp in length and does not extend far beyond the breakpoint. This is the normal behavior of the employed assembly algorithm. The remaining chromosome is covered by other maps not shown in this image. (B): Circos plot generated by the Saphyr system, showing a pink arc between chromosomes 13 and 20, protruding inwards from the breakpoints of the reciprocal balanced translocation.
Figure 5
Figure 5
Schematic representation of small-scale SVs. (A): The green tracks show the reference genome ChGR38 at the position of the NF2 gene of S12, with the gene itself shown as green widening of the track. Its exons are marked in orange. The OGM labels are marked in black. The blue tracks above and below the reference track show the two OGM maps covering the region and representing the two alleles present. They are likewise marked with the exons of NF2 and the OGM labels. OGM labels aligned between a map and the reference track are depicted as black lines connecting them. The map above the reference track shows the normal allele, whereas the map below contains a tandem duplication. The duplicated portion of the reference is indicated by the alignment of each of its labels with two labels of the map. The duplicated portion of the NF2 gene is situated between exons 14 and 15, thereby disrupting the gene (highlighted in red). The exact location of the breakpoint between exons 14 and 2, as determined by sequencing, is depicted below. (B): The deletion of several exons of the DMD gene of S13, shown using the same scheme as in (A).

References

    1. Tyson C., Harvard C., Locker R., Friedman J.M., Langlois S., Lewis M.E., Van Allen M., Somerville M., Arbour L., Clarke L., et al. Submicroscopic deletions and duplications in individuals with intellectual disability detected by array-CGH. Am. J. Med. Genet A. 2005;139:173–185. doi: 10.1002/ajmg.a.31015. - DOI - PubMed
    1. Ishihara T., Kikuchi Y., Sandberg A.A. Chromosomes of twenty cancer effusions: Correlation of karyotypic, clinical, and pathologic aspects. J. Natl. Cancer Inst. 1963;30:1303–1361. - PubMed
    1. Shaffer L.G., Bejjani B.A. A cytogeneticist’s perspective on genomic microarrays. Hum. Reprod. Update. 2004;10:221–226. doi: 10.1093/humupd/dmh022. - DOI - PubMed
    1. Bednar M. DNA microarray technology and application. Med. Sci. Monit. 2000;6:796–800. - PubMed
    1. Kosugi S., Momozawa Y., Liu X., Terao C., Kubo M., Kamatani Y. Comprehensive evaluation of structural variation detection algorithms for whole genome sequencing. Genome Biol. 2019;20:117. doi: 10.1186/s13059-019-1720-5. - DOI - PMC - PubMed

LinkOut - more resources