. 2021 Dec 14;12(12):1982.
doi: 10.3390/genes12121982.

Age-Related Changes of Gene Expression Profiles in Drosophila

Affiliations

Age-Related Changes of Gene Expression Profiles in Drosophila

Guillaume Bordet et al. Genes (Basel). .

Abstract

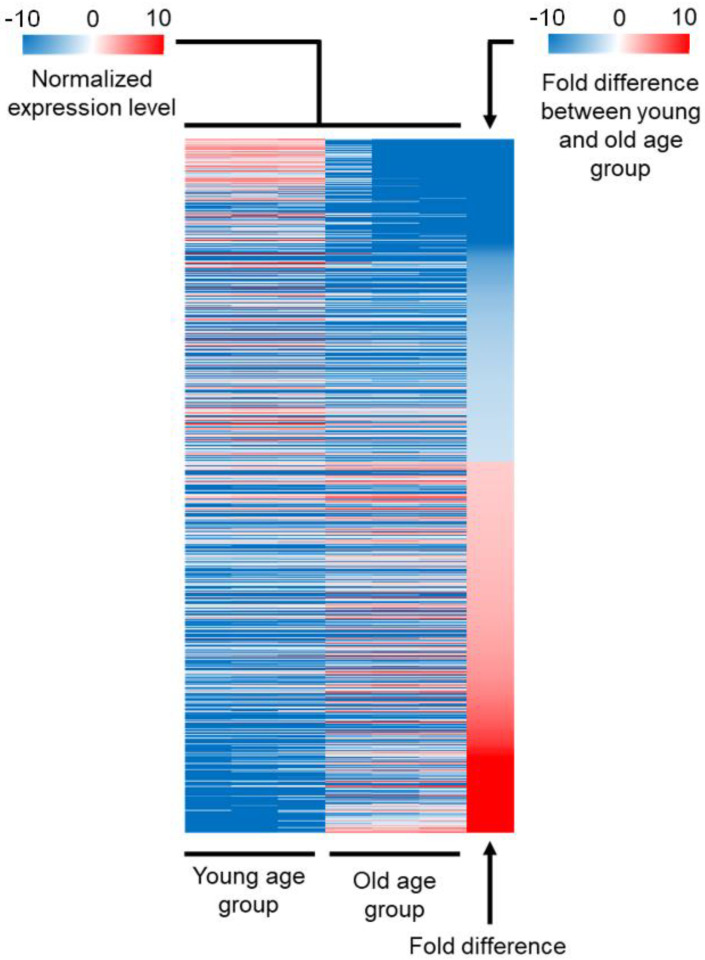
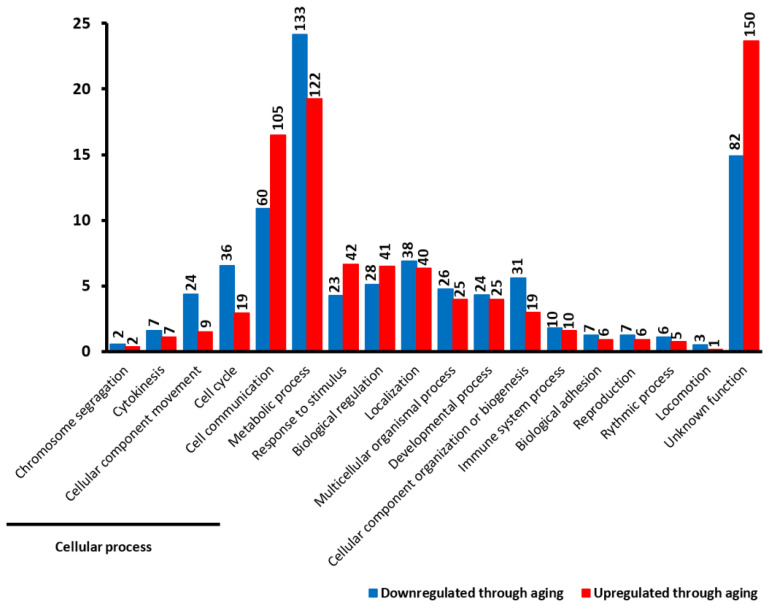
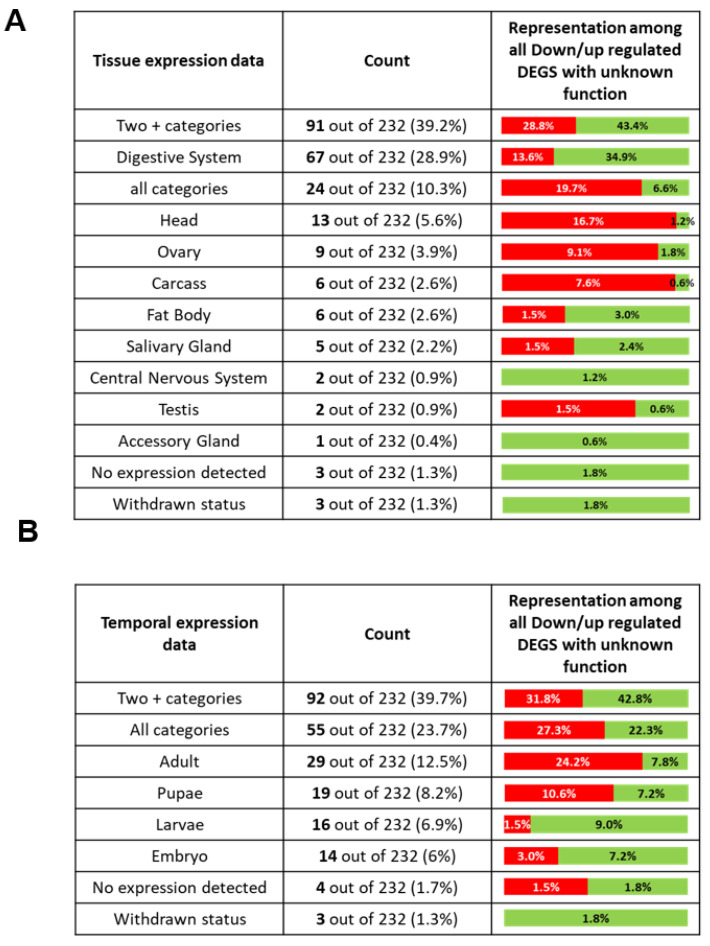
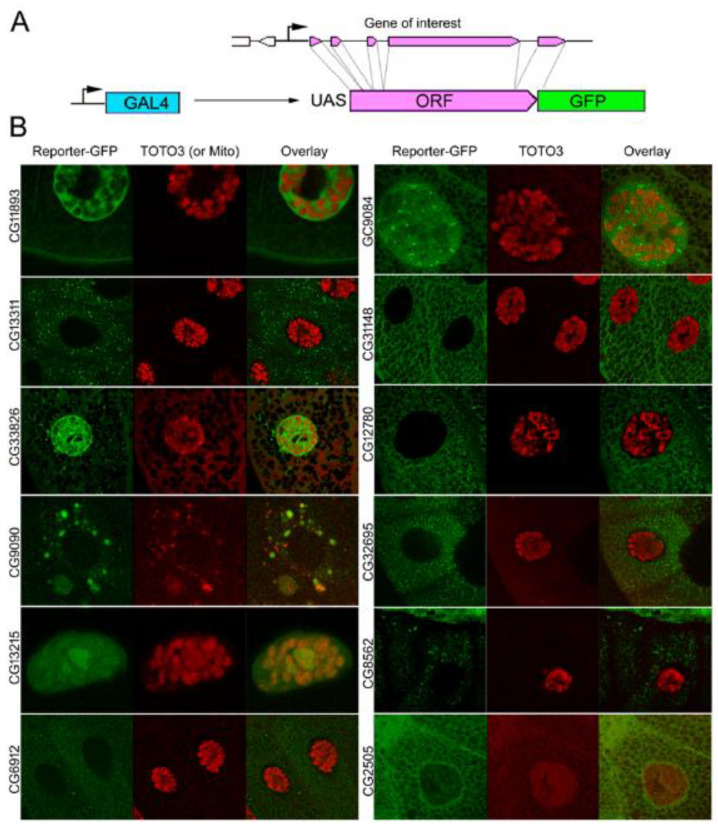
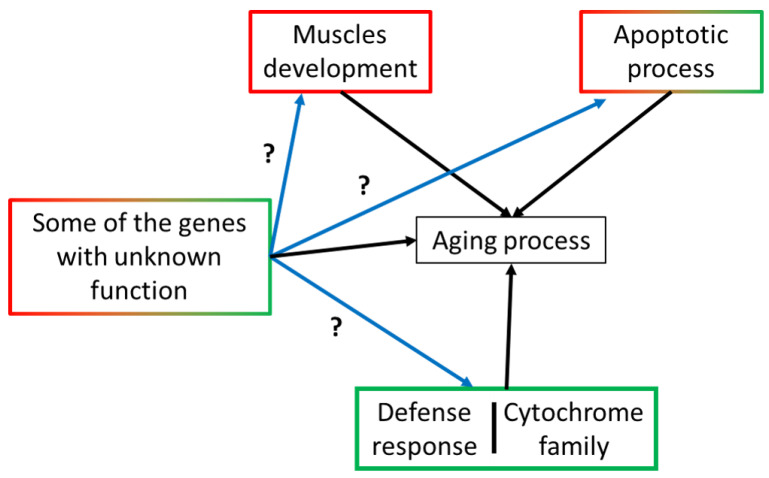
An individual's gene expression profile changes throughout their life. This change in gene expression is shaped by differences in physiological needs and functions between the younger and older organism. Despite intensive studies, the aging process is not fully understood, and several genes involved in this process may remain to be identified. Here we report a transcriptomic analysis of Drosophila melanogaster using microarrays. We compared the expression profiles of two-day-old female adult flies with those of 45-day-old flies. We identified 1184 genes with pronounced differences in expression level between young and old age groups. Most genes involved in muscle development/maintenance that display different levels of expression with age were downregulated in older flies. Many of these genes contributed to sarcomere formation and function. Several of these genes were functionally related to direct and indirect flight muscles; some of them were exclusively expressed in these muscles. Conversely, several genes involved in apoptosis processes were upregulated in aging flies. In addition, several genes involved in resistance to toxic chemicals were upregulated in aging flies, which is consistent with a global upregulation of the defense response system in aging flies. Finally, we randomly selected 12 genes among 232 genes with unknown function and generated transgenic flies expressing recombinant proteins fused with GFP protein to determine their subcellular expression. We also found that the knockdown of some of those 12 genes can affect the lifespan of flies.

Keywords: Drosophila; aging processes; cytochrome; microarray; muscle structure.


Conflict of interest statement

The authors declare that they have no conflict of interest about this manuscript.

Figures

Figure 1
Figure 1
Overview of the transcriptomic analysis. Heatmap representing the expression level of DEGs between old and young age groups that followed our three criteria: (1) fold difference higher than 2, (2) p-value of t-test based on three biological replicates lower than 0.05, and (3) false discovery rate (FDR) lower than 15%. The three biological replicates are shown separately. The expression level of each gene is normalized by subtracting the average level of expression for all genes. A negative value corresponds to a gene that is downregulated in old age flies (downregulated DEGs) (blue), while a positive value corresponds to a gene that is upregulated in old age flies (upregulated DEGs) (red). The last column represents the fold difference between old and young age groups. The value is negative when the expression is higher in the young age group (blue), and the value is positive when the expression is higher in the old age group (red).
Figure 2
Figure 2
Overview of main cellular functions of 1184 differentially expressed genes between young and old age groups. The first five processes are subcategories of the “cellular process”. The height of each bar corresponds to the percentage of genes belonging to each specific process. Genes downregulated in the old age group are represented in blue, whereas genes upregulated in the old age group are represented in red. The black number at the top of each bar corresponds to the number of DEGs belonging to each specific process.
Figure 3
Figure 3
Functional classification of differentially expressed genes between young and old age groups. (A) Heatmap of differentially expressed genes. Expression values for the old and young age groups are shown as normalized to the mean of the expression of all genes. Blue color indicates that the expression level of a gene is lower than the mean, whereas a red color indicates a higher expression level. The fold difference column corresponds to the difference of expression of a gene between old and young age groups. The blue color corresponds to a downregulated gene in the old age group, whereas the red color corresponds to an upregulated gene in the old age group. The six gene classes are shown. (B) GO-term function enrichment analysis of old and young age groups and the prevalence of each GO-term in each gene class. The first six columns correspond to the six classes represented in Figure 3A (c1 to c6). The significance of the most represented GO-term in the old and young age groups is indicated by the p-value in the last two columns (Y for the young age group and O for the old age group). The heatmap below each gene class corresponds to the percentage of genes belonging to each GO-term that are present in this gene class. A grey tile means that less than 5% of the DEGs that belong to this GO-term are members of this gene class. A dark grey tile means that this GO-term is not overrepresented in this category.
Figure 4
Figure 4
Breakdown of the RNA-seq profile of all DEGs with unknown function (modENCODE data). Two categories were addressed: “tissue expression data” (PRJNA75285) and “temporal expression data” (PRJNA75285). A gene is considered to be predominantly expressed in a specific tissue/stage if its expression level is at least two-fold higher in this tissue/stage than in the others. If the expression level of a DEG is similar in several tissues/stages, but is two-fold higher than at least one other tissue/stage, we considered this gene to be predominantly expressed in different tissues during different stages (labeled as “two + categories”). Conversely, if the fold difference of expression level of a DEG among all tested tissues/stages is lower than two, we considered the expression of this DEG to be similar in all tested tissues/stages (labeled as “all categories”). The third column of (A) and (B) corresponds to the difference of repartition between downregulated and upregulated DEGs. The red percentage corresponds to the proportion of downregulated DEGs that belong to this category, whereas a green percentage corresponds to the proportion of upregulated DEGs. Asterisks after the name correspond to the result of a two-tailed Fisher exact test. no asterisk: non-significant. (A) Expression of all DEGs with unknown function in different tissues. (B) Expression of all DEGs with unknown function during different developmental stages.
Figure 5
Figure 5
Cellular localization of twelve randomly selected genes out of the list of 232 with unknown function. (A) To allow transcription of the recombinant protein under the control of the GAL4 transcriptional factor, we fused cDNAs of these genes with GFP ORF and cloned them into a pUASt vector. (B) To study cellular localization and secretion of twelve recombinant proteins, we expressed them in larval salivary glands (SG) using a forkhead-GAL4 driver and examined them using confocal microscopy. Live, dissected larval salivary glands expressing reporter-transgenes (green) were stained with DNA-binding dye (red, shown only in Overlay) and analyzed by confocal microscopy live imaging. A single cell is shown for each experiment. We used TOTO3 staining (red) to detect nuclear DNA (chromatin) (for all except CG9090) and mitochondrial protein Tim17b (red) (for CG9090). We distinguished localization of the following proteins using morphology and co-staining: soluble nucleoplasm, chromatin, nucleolus, nucleoplasmic granules; soluble cytoplasm, secretory granules, mitochondria, perinuclear and peri-plasma membrane space and secreted when recombinant proteins accumulate in SG lumen.
Figure 6
Figure 6
Overview of the processes that are affected during aging process. Processes contoured in red are mainly downregulated during aging while processes contoured in green are mainly upregulated during aging. Among the 12 genes tested the knockdown of five decreased longevity, whereas their expression level increased during aging. Conversely, the knockdown of one increased longevity, whereas its expression level decreased during aging. Black arrows represent known interaction while blue arrows represent potential interaction.

References

    1. DePinho R.A. The age of cancer. Nature. 2000;408:248–254. doi: 10.1038/35041694. - DOI - PubMed
    1. Campisi J. Cancer and Ageing: Rival Demons? Nature. 2003;3:339–349. doi: 10.1038/nrc1073. - DOI - PubMed
    1. Lakatta E.G., Levy D. Arterial and Cardian Aging: Major Shareholders in Cardiovascular Disease Enterprises, Part II The Aging Heart in Health: Links to Heart Disease. Circulation. 2003;107:346–354. doi: 10.1161/01.CIR.0000048893.62841.F7. - DOI - PubMed
    1. Allikmets R., Shroyer N.F., Singh N., Seddon J.M., Lewis R.A., Bernstein P., Peiffer A., Zabriskie N., Li Y., Hutchinson A., et al. Mutation of the Stargardt disease gene (ABCR) in age-related macular degeneration. Science. 1997;277:1805–1807. doi: 10.1126/science.277.5333.1805. - DOI - PubMed
    1. Sato N., Hori O., Yamaguchi A., Lambert J.C., Chartier-Harlin M.C., Robinson P.A., Delacourte A., Schmidt A.M., Furuyama T., Imaizumi K., et al. A Novel Presenilin-2 Splice Variant in Human Alzheimer’s Disease Brain Tissue. J. Neurochem. 1999;72:2498–2505. doi: 10.1046/j.1471-4159.1999.0722498.x. - DOI - PubMed

Publication types

Substances