. 2021 Dec 18;12(12):2015.
doi: 10.3390/genes12122015.

Single Cell Sequencing of Induced Pluripotent Stem Cell Derived Retinal Ganglion Cells (iPSC-RGC) Reveals Distinct Molecular Signatures and RGC Subtypes

Affiliations

Single Cell Sequencing of Induced Pluripotent Stem Cell Derived Retinal Ganglion Cells (iPSC-RGC) Reveals Distinct Molecular Signatures and RGC Subtypes

Harini V Gudiseva et al. Genes (Basel). .

Abstract

We intend to identify marker genes with differential gene expression (DEG) and RGC subtypes in cultures of human-induced pluripotent stem cell (iPSC)-derived retinal ganglion cells. Single-cell sequencing was performed on mature and functional iPSC-RGCs at day 40 using Chromium Single Cell 3' V3 protocols (10X Genomics). Sequencing libraries were run on Illumina Novaseq to generate 150 PE reads. Demultiplexed FASTQ files were mapped to the hg38 reference genome using the STAR package, and cluster analyses were performed using a cell ranger and BBrowser2 software. QC analysis was performed by removing the reads corresponding to ribosomal and mitochondrial genes, as well as cells that had less than 1X mean absolute deviation (MAD), resulting in 4705 cells that were used for further analyses. Cells were separated into clusters based on the gene expression normalization via PCA and TSNE analyses using the Seurat tool and/or Louvain clustering when using BBrowser2 software. DEG analysis identified subsets of RGCs with markers like MAP2, RBPMS, TUJ1, BRN3A, SOX4, TUBB3, SNCG, PAX6 and NRN1 in iPSC-RGCs. Differential expression analysis between separate clusters identified significant DEG transcripts associated with cell cycle, neuron regulatory networks, protein kinases, calcium signaling, growth factor hormones, and homeobox transcription factors. Further cluster refinement identified RGC diversity and subtype specification within iPSC-RGCs. DEGs can be used as biomarkers for RGC subtype classification, which will allow screening model systems that represent a spectrum of diseases with RGC pathology.

Keywords: FACS analysis; RGC subtypes; clustering; glaucoma; iPSC-RGCs; iPSCs; marker genes; retinal ganglion cells; single cell sequencing; transcriptome.


Conflict of interest statement

The authors declare no conflict of interest. The funders had no role in the design of the study; in the collection, analyses, or interpretation of data; in the writing of the manuscript, or in the decision to publish the results.

Figures

Figure 1
Figure 1
Flow cytometry analysis to characterize iPSC-RPCs and iPSC-RGCs. (A,B) FACS analysis of iP SC-RPCs at day 15 showed that over 95.5% and 82% of the cells expressed ki67 and Chx10, respectively. About 82% of the cells expressed both the RPC markers. (CF) FACs analysis at day 35 showed that 87%, 93%, 85.5%, and 22.5% of the iPSC-RGCs were positive for BRN3, SNCG, CD90, and RBPMS, respectively. (G) A subset of the iPSC-RGC population (insert from (D)) expressed all the four RGC markers; namely 87% of the cells were positive for BRN3 and SNCG, whereas 81% was positive for CD90 and 19% was positive for RBPMS.
Figure 1
Figure 1
Flow cytometry analysis to characterize iPSC-RPCs and iPSC-RGCs. (A,B) FACS analysis of iP SC-RPCs at day 15 showed that over 95.5% and 82% of the cells expressed ki67 and Chx10, respectively. About 82% of the cells expressed both the RPC markers. (CF) FACs analysis at day 35 showed that 87%, 93%, 85.5%, and 22.5% of the iPSC-RGCs were positive for BRN3, SNCG, CD90, and RBPMS, respectively. (G) A subset of the iPSC-RGC population (insert from (D)) expressed all the four RGC markers; namely 87% of the cells were positive for BRN3 and SNCG, whereas 81% was positive for CD90 and 19% was positive for RBPMS.
Figure 2
Figure 2
scRNA-Seq analysis of iPSC-RGCs at differentiation Day 40. Uniform manifold approximation and projection (UMAP) clustering resulted in 11 overlapping clusters of iPSC-RGCs (A). Graph based clustering of 4556 cells after initial QC and filtering shows cells organized into 12 clusters as shown in this representation using BBrowser2 software (B). The number of cells in each cluster is represented in Figure 2B against each cluster.
Figure 3
Figure 3
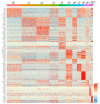
Heatmap showing top ten enriched genes in each cluster. Each horizontal line represents one gene, and each vertical line represents one cell. The heatmap demonstrates continuity between these clusters. The relative expression levels that were generated by averaging the normalized gene expression values in each cluster are shown in color scale.
Figure 4
Figure 4
Heatmap showing RGC-specific marker gene expressions transformed in to Z-score in all clusters from single cell sequencing. Corresponding color key histograms are displayed.
Figure 5
Figure 5
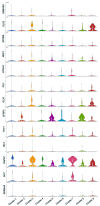
Violin plots showing RGC maturation markers expression.
Figure 6
Figure 6
Heatmap showing RGC-subtype specific expression in iPSC-RGC clusters. The expression is transformed to z scores and represented. Corresponding color key histograms are displayed.

References

    1. Dietze J., Blair K., Havens S.J. Glaucoma. StatPearls Publishing; Treasure Island, FL, USA: 2021.
    1. Zhao D., Cho J., Kim M.H., Friedman D.S., Guallar E. Diabetes, fasting glucose, and the risk of glaucoma: A meta-analysis. Ophthalmology. 2015;122:72–78. doi: 10.1016/j.ophtha.2014.07.051. - DOI - PubMed
    1. Langer K.B., Ohlemacher S.K., Phillips M.J., Fligor C.M., Jiang P., Gamm D.M., Meyer J.S. Retinal Ganglion Cell Diversity and Subtype Specification from Human Pluripotent Stem Cells. Stem. Cell Rep. 2018;10:1282–1293. doi: 10.1016/j.stemcr.2018.02.010. - DOI - PMC - PubMed
    1. Teotia P., Niu M., Ahmad I. Mapping developmental trajectories and subtype diversity of normal and glaucomatous human retinal ganglion cells by single-cell transcriptome analysis. Stem. Cells. 2020;38:1279–1291. doi: 10.1002/stem.3238. - DOI - PMC - PubMed
    1. Chavali V.R.M., Haider N., Rathi S., Vrathasha V., Alapati T., He J., Gill K., Nikonov R., Duong T.T., McDougald D.S., et al. Dual SMAD inhibition and Wnt inhibition enable efficient and reproducible differentiations of induced pluripotent stem cells into retinal ganglion cells. Sci. Rep. 2020;10:11828. doi: 10.1038/s41598-020-68811-8. - DOI - PMC - PubMed

Publication types

MeSH terms