. 2021 Nov 25;11(12):3193.
doi: 10.3390/nano11123193.

NIR-to-NIR Imaging: Extended Excitation Up to 2.2 μm Using Harmonic Nanoparticles with a Tunable hIGh EneRgy (TIGER) Widefield Microscope

Affiliations

NIR-to-NIR Imaging: Extended Excitation Up to 2.2 μm Using Harmonic Nanoparticles with a Tunable hIGh EneRgy (TIGER) Widefield Microscope

Laura Vittadello et al. Nanomaterials (Basel). .

Abstract

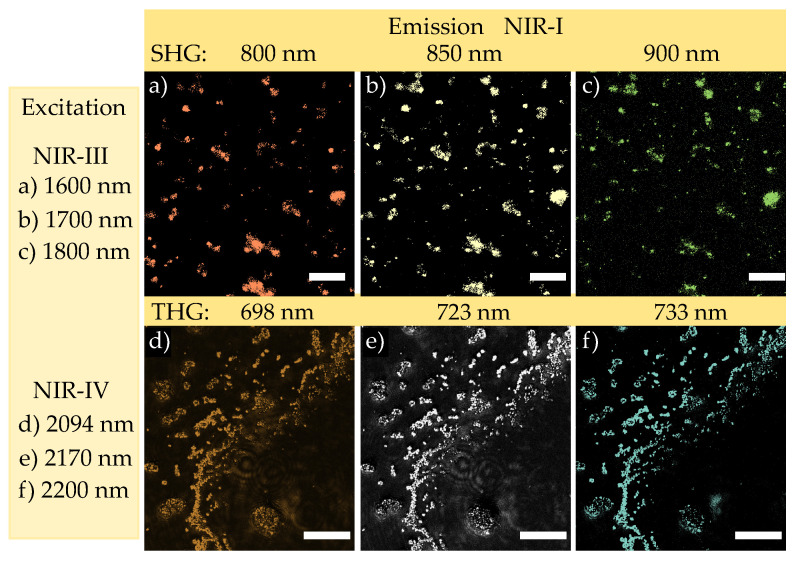
Near-infrared (NIR) marker-based imaging is of growing importance for deep tissue imaging and is based on a considerable reduction of optical losses at large wavelengths. We aim to extend the range of NIR excitation wavelengths particularly to values beyond 1.6 μm in order to profit from the low loss biological windows NIR-III and NIR-IV. We address this task by studying NIR-excitation to NIR-emission conversion and imaging in the range of 1200 up to 2400 nm at the example of harmonic Mg-doped lithium niobate nanoparticles (i) using a nonlinear diffuse femtosecond-pulse reflectometer and (ii) a Tunable hIGh EneRgy (TIGER) widefield microscope. We successfully demonstrate the existence of appropriate excitation/emission configurations in this spectral region taking harmonic generation into account. Moreover, NIR-imaging using the most striking configurations NIR-III to NIR-I, based on second harmonic generation (SHG), and NIR-IV to NIR-I, based on third harmonic generation (THG), is demonstrated with excitation wavelengths from 1.6-1.8 μm and from 2.1-2.2 μm, respectively. The advantages of the approach and the potential to additionally extend the emission range up to 2400 nm, making use of sum frequency generation (SFG) and difference frequency generation (DFG), are discussed.

Keywords: NIR imaging; NIR-III; NIR-IV; biological windows; deep tissue imaging harmonic nanoparticles; nonlinear microscopy; nonlinear photonics; second harmonic generation.


Conflict of interest statement

The authors declare no conflict of interest. The funders had no role in the design of the study; in the collection, analyses, or interpretation of data; in the writing of the manuscript, or in the decision to publish the results.

Figures

Figure 1
Figure 1
Extinction coefficient of PMMA nano-spheres diluted in water (black solid line) used as phantom tissue, skin (black dotted line) and skull bone (red dotted line). Superposed to the spectra, the information on the biological windows NIR-I, II, III, IV are added. (Spectra of skin and skull bone are taken from Ref. [11]).
Figure 2
Figure 2
Normalized intensity (logarithmic scale) of harmonic emission in false colors in the wavelength range from 266–1720 nm as a function of the pump wavelength in the range from 1200–2400 nm. All data were obtained by means of nonlinear diffuse fs-pulse reflectometry with LN:Mg nanoparticle powder pellets, as described in the text. Color coding according to the legend on the right. The greyish area marks the spectrometers dead zone, i.e., the transition regime between the VIS and NIR spectrometer. The dashed white lines shows the result of the fitting procedure. The yellow boxes represent the principle regimes for NIR-to-NIR pairing of the biological optical windows NIR-II/NIR-I, NIR-III/NIR-I, NIR-IV/NIR-I, and NIR-IV/NIR-II.
Figure 3
Figure 3
Nonlinear images acquired from nanoparticles dried on a coverslip using the TIGER microscope. NIR-III/NIR-I configuration using SHG: (a) 1600/800 nm (b) 1700/850 nm (c) 1800/900 nm. NIR-IV/NIR-I configuration using THG: (d) 2094/698 nm (e) 2170/723 nm and (f) 2200/733 nm. Scale bar is equal for all pictures to 20 μm. Images are presented in pseudo-color.
Figure 4
Figure 4
Study of the HNP emission in presence of a phantom tissue thickness of 0.3 mm (a,c) and 0.6 mm (b,d) for two different excitation wavelengths belonging, respectively, to NIR-I (a,b) and NIR-III (c,d). Scale bar is 50 μm for all figures.
Figure 5
Figure 5
Simulation on the sum frequency generation (a) and difference frequency generation (b) in the wavelength range from 600 till 2400 nm, covering the biological windows NIR-I to IV, marked in yellow. The emitted wavelength can be read in the colorbar. The dashed line represents the second harmonic generation, a special case of the sum frequency generation when λ1=λ2. The areas with reduced opacity refer to all wavelength pairs of SFG/DFG that are lying outside of the biological windows.

References

    1. Soga K., Umezawa M., Okubo K., editors. Transparency in Biology. Springer; Singapore: 2021. - DOI
    1. Welsher K., Sherlock S.P., Dai H. Deep-tissue anatomical imaging of mice using carbon nanotube fluorophores in the second near-infrared window. Proc. Natl. Acad. Sci. USA. 2011;108:8943–8948. doi: 10.1073/pnas.1014501108. - DOI - PMC - PubMed
    1. Sordillo L.A., Pu Y., Pratavieira S., Budansky Y., Alfano R.R. Deep optical imaging of tissue using the second and third near-infrared spectral windows. J. Biomed. Opt. 2014;19:056004. doi: 10.1117/1.JBO.19.5.056004. - DOI - PubMed
    1. Hemmer E., Benayas A., Légaré F., Vetrone F. Exploiting the biological windows: Current perspectives on fluorescent bioprobes emitting above 1000 nm. Nanoscale Horizons. 2016;1:168–184. doi: 10.1039/C5NH00073D. - DOI - PubMed
    1. Liu T.M., Conde J., Lipiński T., Bednarkiewicz A., Huang C.C. Revisiting the classification of NIR-absorbing/emitting nanomaterials for in vivo bioapplications. NPG Asia Mater. 2016;8:e295. doi: 10.1038/am.2016.106. - DOI

LinkOut - more resources