. 2021 Dec 7;22(24):13188.
doi: 10.3390/ijms222413188.

Serum Metabolomic and Lipidomic Profiling Reveals Novel Biomarkers of Efficacy for Benfotiamine in Alzheimer's Disease

Affiliations

Serum Metabolomic and Lipidomic Profiling Reveals Novel Biomarkers of Efficacy for Benfotiamine in Alzheimer's Disease

Ruchika Bhawal et al. Int J Mol Sci. .

Abstract

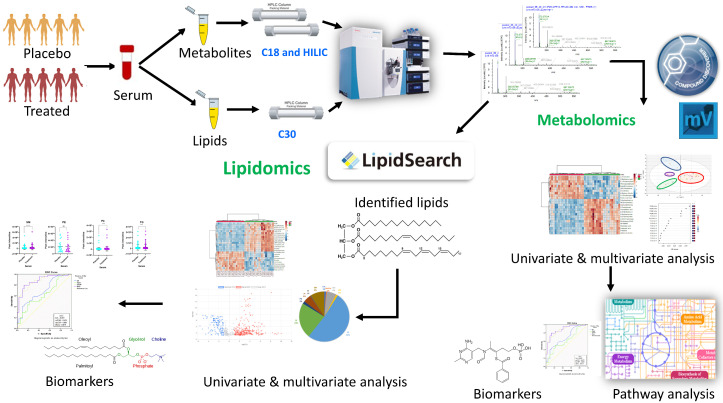
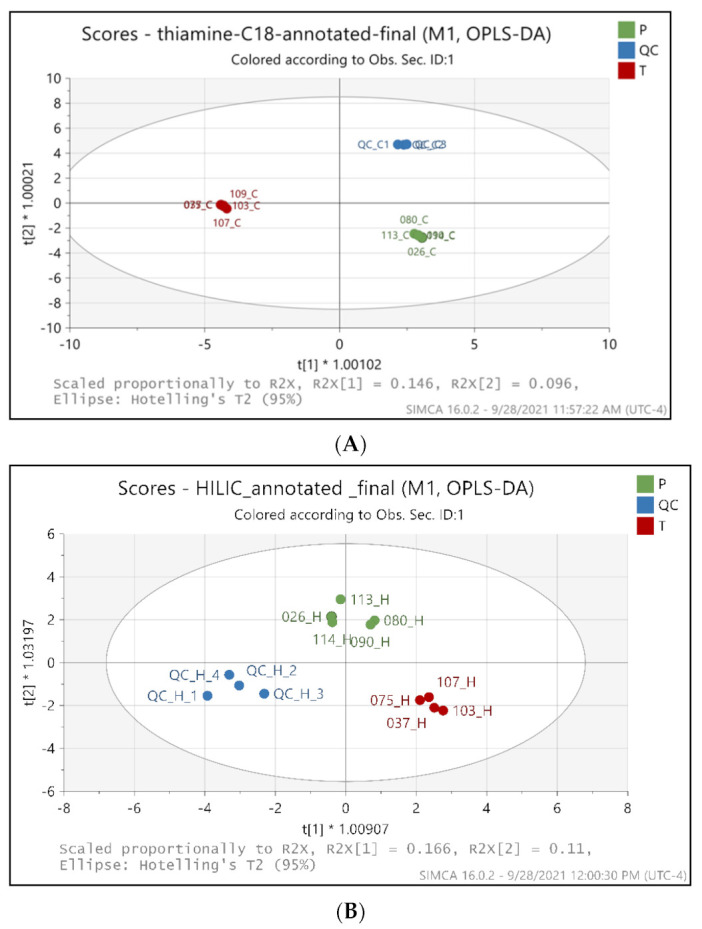
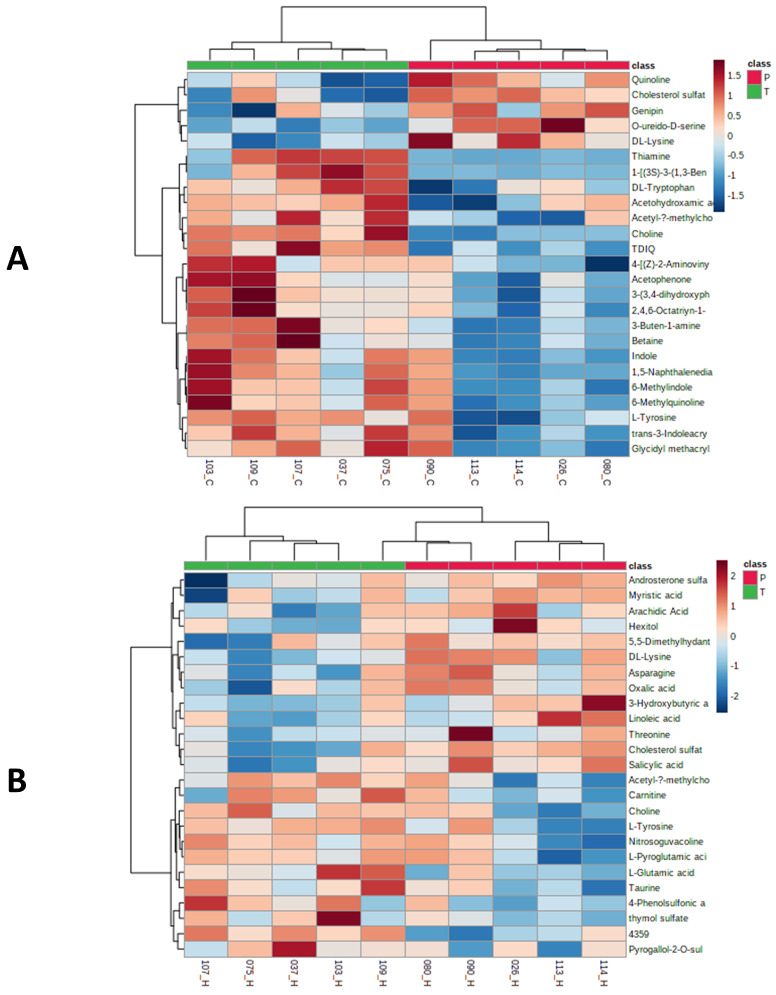
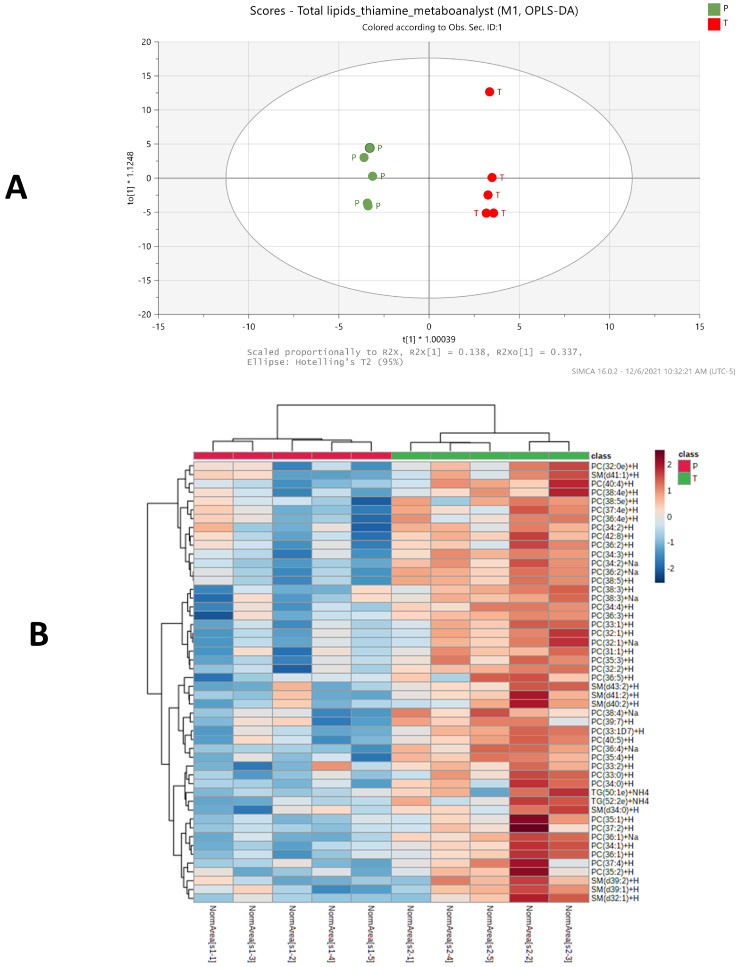
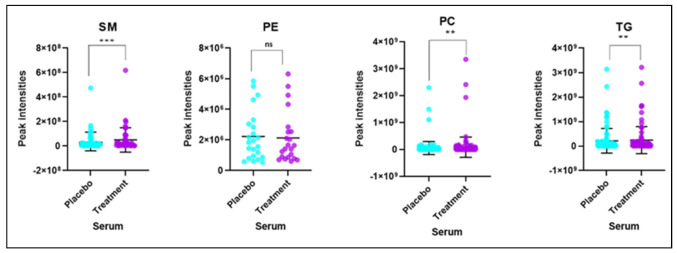
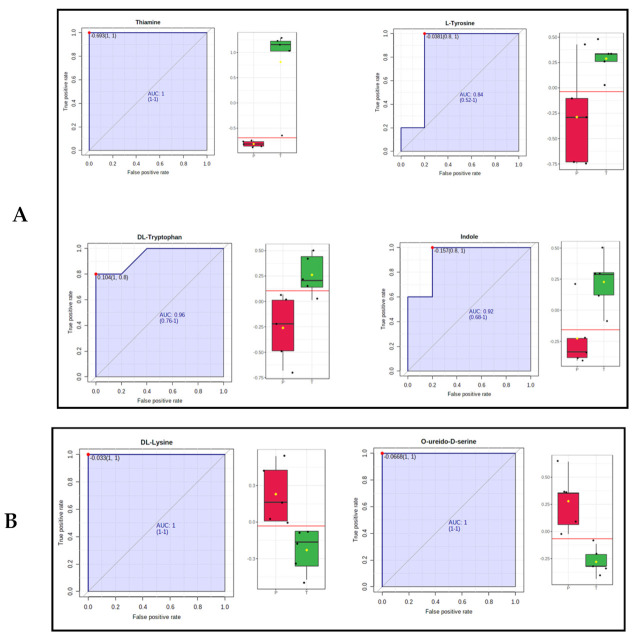
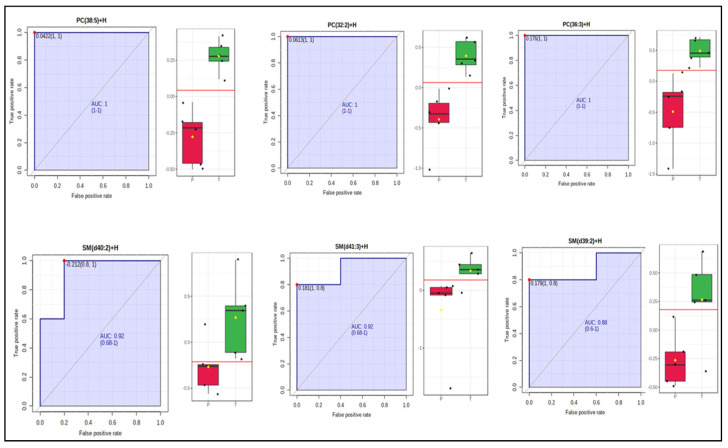
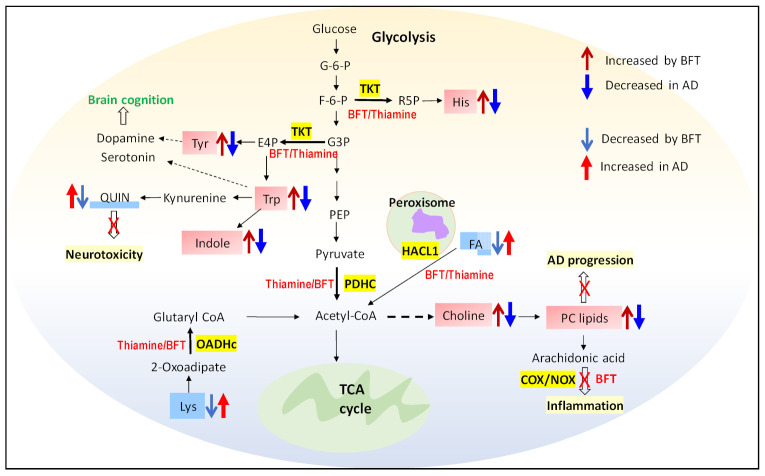
Serum metabolomics and lipidomics are powerful approaches for discovering unique biomarkers in various diseases and associated therapeutics and for revealing metabolic mechanisms of both. Treatment with Benfotiamine (BFT), a thiamine prodrug, for one year produced encouraging results for patients with mild cognitive impairment and mild Alzheimer's disease (AD). In this study, a parallel metabolomics and lipidomics approach was applied for the first exploratory investigation on the serum metabolome and lipidome of patients treated with BFT. A total of 315 unique metabolites and 417 lipids species were confidently identified and relatively quantified. Rigorous statistical analyses revealed significant differences between the placebo and BFT treatment groups in 25 metabolites, including thiamine, tyrosine, tryptophan, lysine, and 22 lipid species, mostly belonging to phosphatidylcholines. Additionally, 10 of 11 metabolites and 14 of 15 lipid species reported in previous literature to follow AD progression changed in the opposite direction to those reported to reflect AD progression. Enrichment and pathway analyses show that significantly altered metabolites by BFT are involved in glucose metabolism and biosynthesis of aromatic amino acids. Our study discovered that multiple novel biomarkers and multiple mechanisms that may underlie the benefit of BFT are potential therapeutic targets in AD and should be validated in studies with larger sample sizes.

Keywords: Alzheimer’s disease; benfotiamine; biomarkers; lipidomics; mass spectrometry; metabolomics; serum; thiamine.


Conflict of interest statement

The authors declare no conflict of interest.

Figures

Figure 1
Figure 1
Schematic diagram of the parallel metabolomic and lipidomic workflows used in this study. Serum samples were collected from patients, and aliquoted for separate extraction of metabolites and lipids. The extracted samples were analyzed by LC-MS/MS using C18 and HILIC columns (metabolomics) and C30 column (lipidomics). Raw MS and MS/MS data files were acquired by high resolution mass spectrometer on Orbitrap QE-HF and processed by Compound Discoverer (metabolomics) and LipidSearch (lipidomics). Further statistical and bioinformatics analyses were performed to identify altered metabolites/lipids and potential mechanistic pathways in response to benfotiamine treatment.
Figure 2
Figure 2
OPLS-DA score plots between the metabolites identified in placebo and benfotiamine treated serum samples in C18 mode (A) and HILIC mode (B). Green dots-Placebo samples, Red dots-benfotiamine-treated samples, Blue dots-QC pooled samples. Each dot represents a sample. P-Placebo, T-benfotiamine treated.
Figure 3
Figure 3
Heat maps showed the distribution of top 25 metabolites that were significantly different between placebo and treated serum samples by C18 (A) and HILIC (B) analyses. The serum samples from placebo and treatment groups were labeled with red and green ribbons, respectively. The heatmap scale ranges from-2 to 2 in log10 (auto scaled intensities) scales (KEGG pathway metabolites).
Figure 4
Figure 4
Lipidomic profiling distinguishes the BFT treatment from placebo group in an OPLS-DA score plot between the placebo, treatment serum samples (A), and a heatmap showing the distribution of top 50 lipids that were significantly different between placebo and treatment serum samples, PC-Phosphatidylcholine, SM-Sphingomyelins, TG-Triglycerides. (B). The serum samples from placebo and treatment groups were labeled with red and green ribbons, respectively. The heatmap scale ranges from −2 to 2 in log2 (auto scaled intensities) scales (Lipidomics analysis metabolites).
Figure 5
Figure 5
Intensities of different lipid classes or species in serum samples of placebo and benfotiamine treated mild AD (ns = not significant, ** p value <0.01, *** p value < 0.001), SM-Sphingomyelins, PE-Phosphatidylethanolamine, PC-Phosphatidylcholine, and TG-Triglycerides. Each dot represents a lipid species.
Figure 6
Figure 6
Univariate ROC analysis of the significantly changed metabolites. (A) ROC plots for four representative metabolites (Thiamine, L-tyrosine, L-Tryptophan and Indole) that increase in benfotiamine treatment serum samples (p value < 0.05). (B) ROC plots for three representative metabolites (O ureido-D-Seine, carboxymethyl-lysine) that decrease in benfotiamine treatment serum samples (p value < 0.05). Red boxes represent placebo samples, green boxes are BFT treated samples and yellow diamond denotes the median value for log2 (fold change).
Figure 7
Figure 7
Univariate ROC analysis of selected significantly changed lipids (PC 38:5, PC 32:2, PC 36:3, SM d40:2, SM d41:3, and SM d39:2) that increase in benfotiamine-treated serum samples (p value < 0.05). Red boxess represent placebo samples, green boxes are BFT treated samples and yellow diamond means the median value for log2 (fold change).
Figure 8
Figure 8
A schematic diagram represents proposed mechanistic pathways in response to benfotiamine treatment. Increased metabolites (light red boxes) and decreased metabolites (light blue box) are shown due to benfotiamine treatment in mild AD individuals. Highlighted yellow boxes represent the enzymes that are thiamine dependent and are responsible for the overserved changes of metabolites and lipids in benfotiamine treatment, which results in reversing the development of AD pathology. FA: fatty acid, Quin: quinoline, PC: phosphatidylcholine.

References

    1. Beltramo E., Berrone E., Tarallo S., Porta M. Effects of thiamine and benfotiamine on intracellular glucose metabolism and relevance in the prevention of diabetic complications. Acta Diabetol. 2008;45:131–141. doi: 10.1007/s00592-008-0042-y. - DOI - PubMed
    1. Kennedy D.O. B Vitamins and the Brain: Mechanisms, Dose and Efficacy—A Review. Nutrients. 2016;8:68. doi: 10.3390/nu8020068. - DOI - PMC - PubMed
    1. Dhir S., Tarasenko M., Napoli E., Giulivi C. Neurological, Psychiatric, and Biochemical Aspects of Thiamine Deficiency in Children and Adults. Front. Psychiatry. 2019;10:207. doi: 10.3389/fpsyt.2019.00207. - DOI - PMC - PubMed
    1. Yadav U.C., Kalariya N.M., Srivastava S.K., Ramana K.V. Protective role of benfotiamine, a fat-soluble vitamin B1 analogue, in lipopolysaccharide-induced cytotoxic signals in murine macrophages. Free Radic. Biol. Med. 2010;48:1423–1434. doi: 10.1016/j.freeradbiomed.2010.02.031. - DOI - PMC - PubMed
    1. Gibson G.E., Hirsch J.A., Fonzetti P., Jordan B.D., Cirio R.T., Elder J. Vitamin B1 (thiamine) and dementia. Ann. N. Y. Acad. Sci. 2016;1367:21–30. doi: 10.1111/nyas.13031. - DOI - PMC - PubMed