

Ascorbate-Glutathione Oxidant Scavengers, Metabolome Analysis and Adaptation Mechanisms of Ion Exclusion in Sorghum under Salt Stress
- PMID: 34948045
- PMCID: PMC8704531
- DOI: 10.3390/ijms222413249
Ascorbate-Glutathione Oxidant Scavengers, Metabolome Analysis and Adaptation Mechanisms of Ion Exclusion in Sorghum under Salt Stress
Abstract
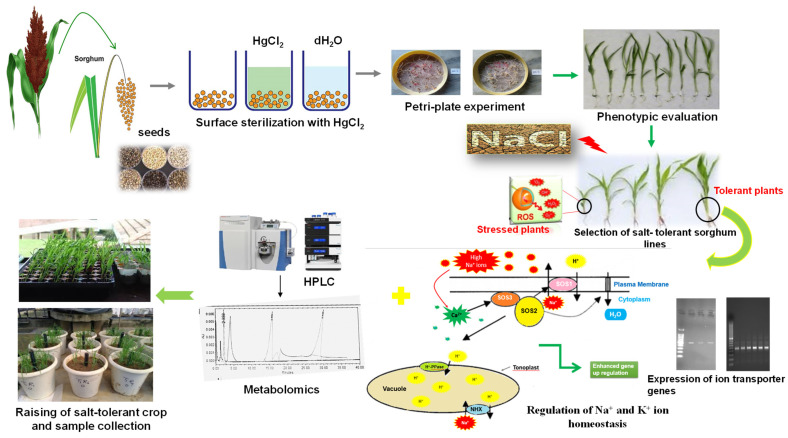
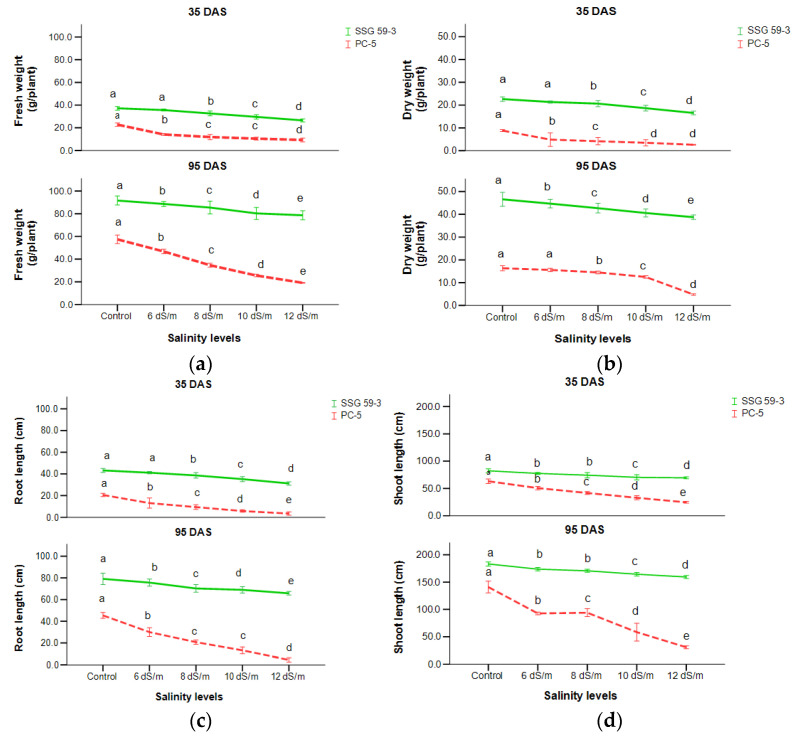
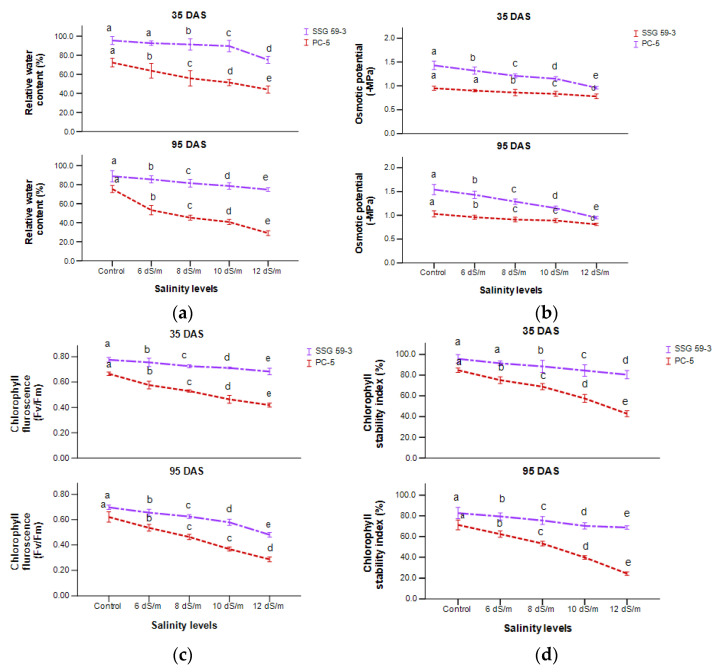
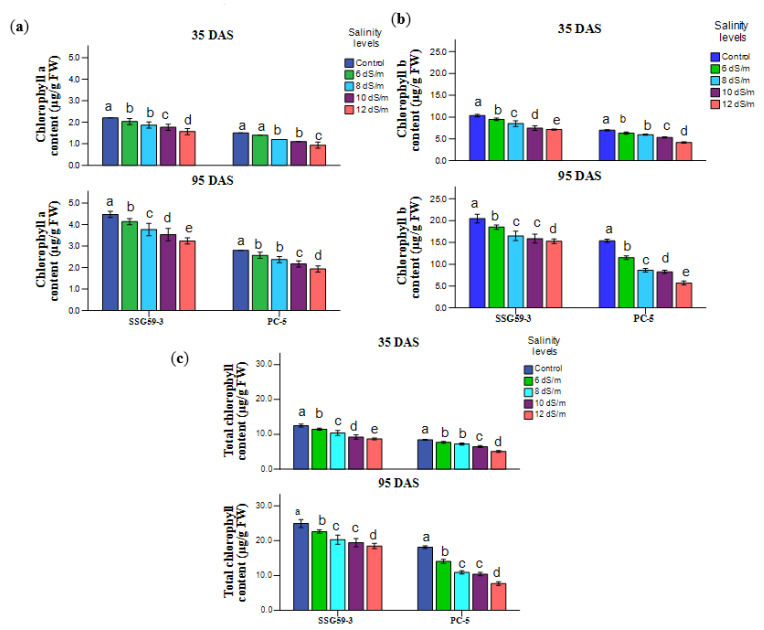
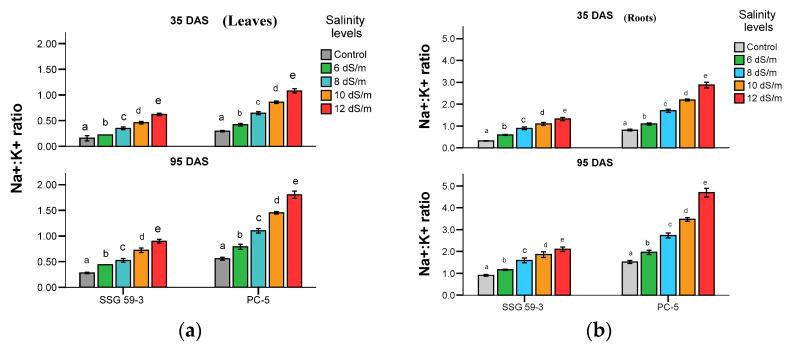
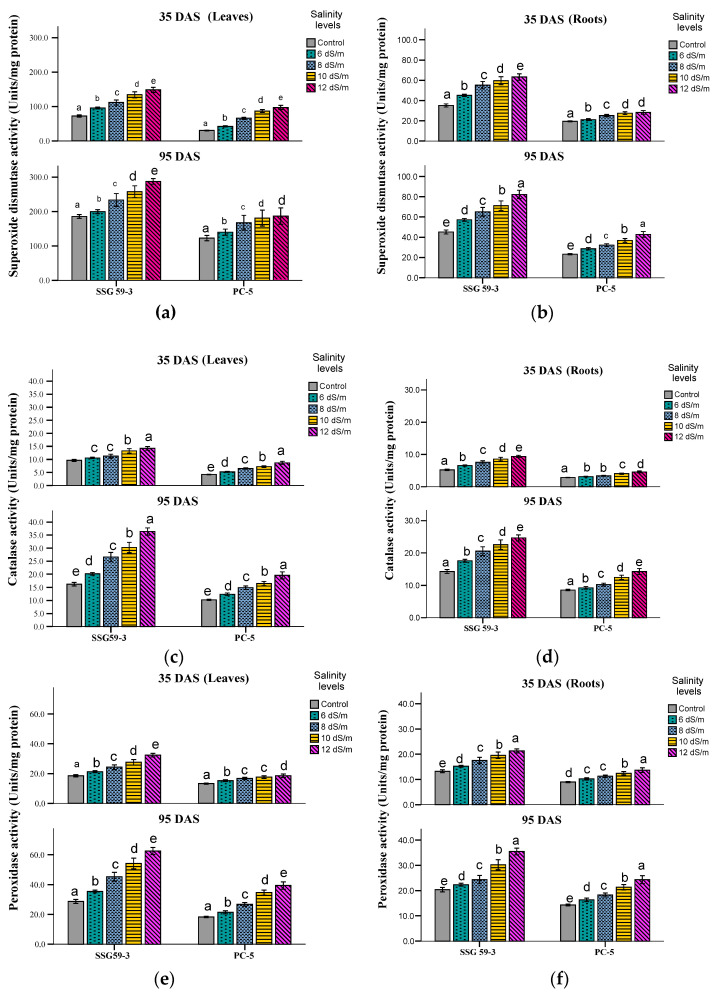
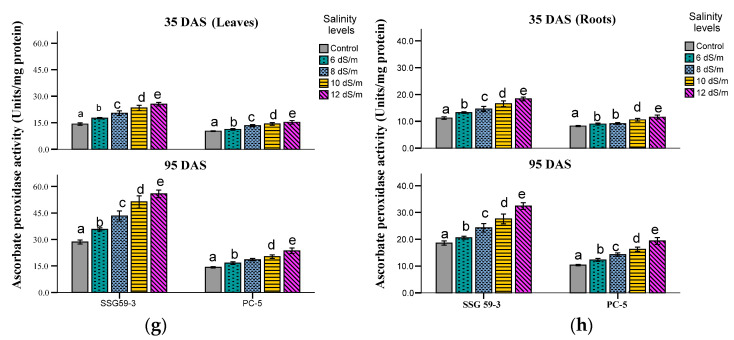
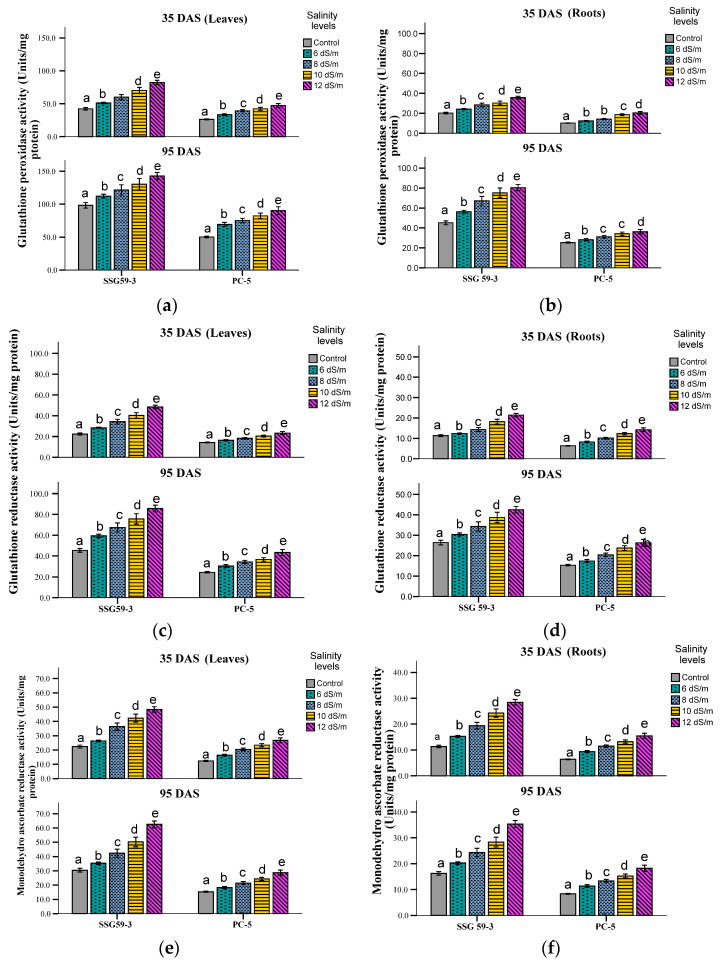
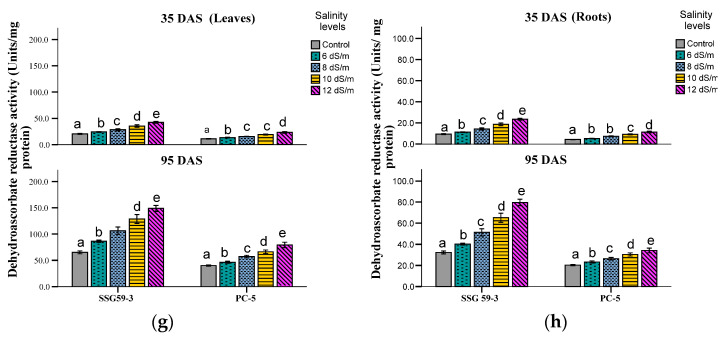
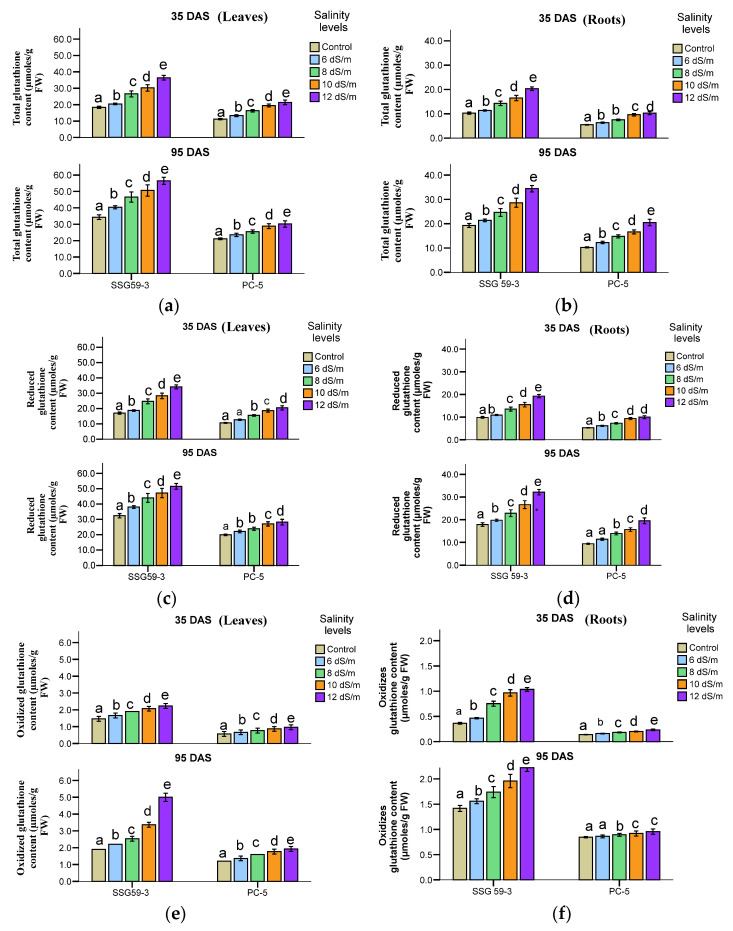
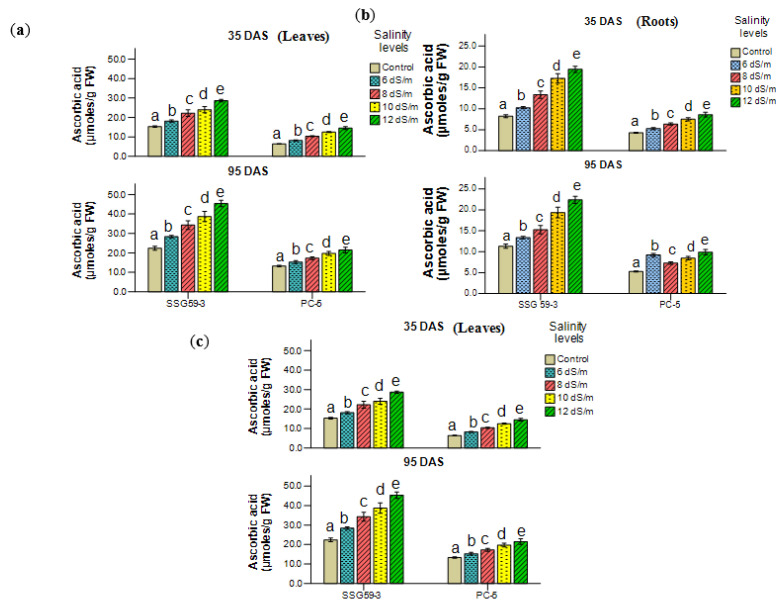
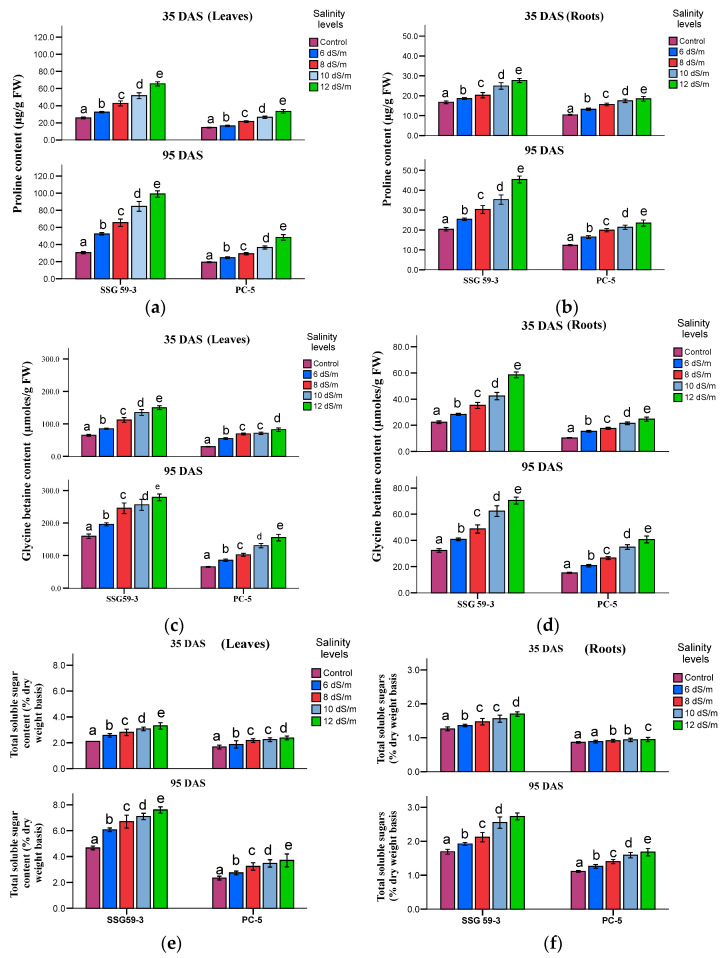
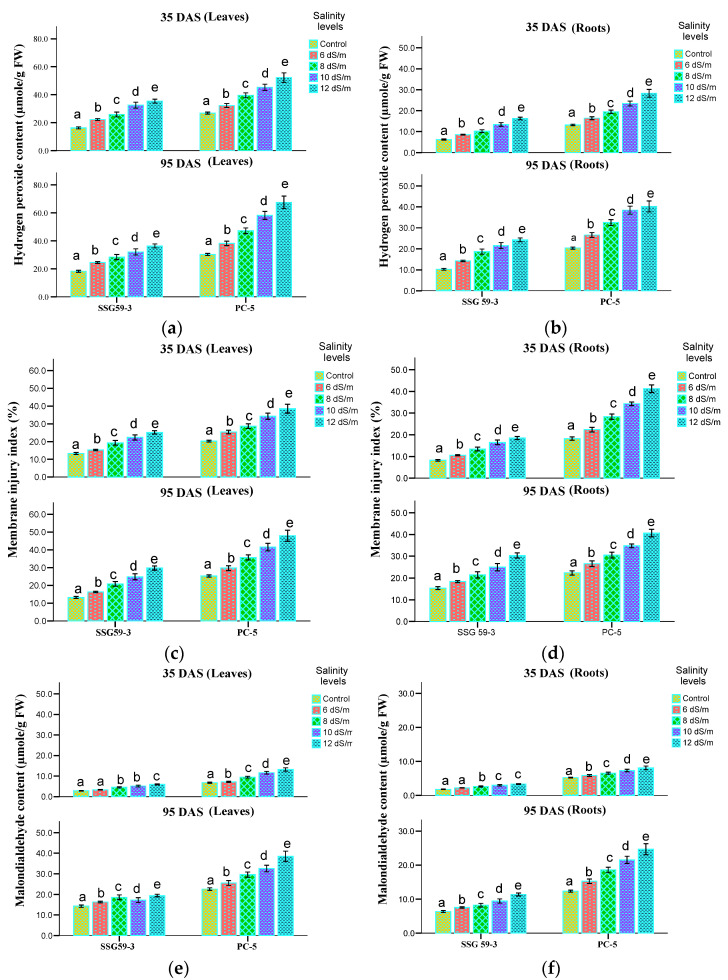
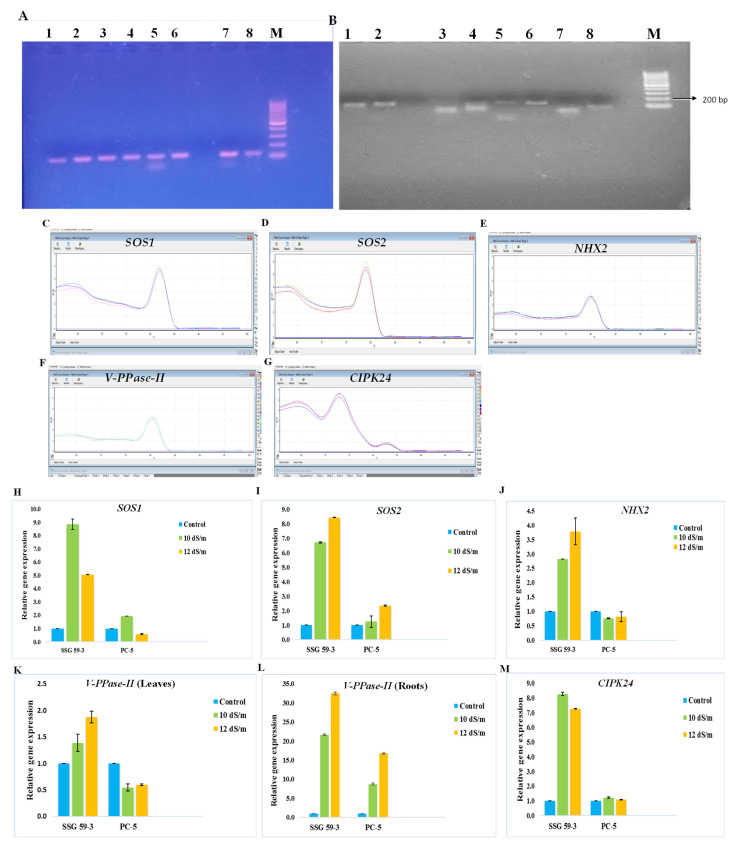
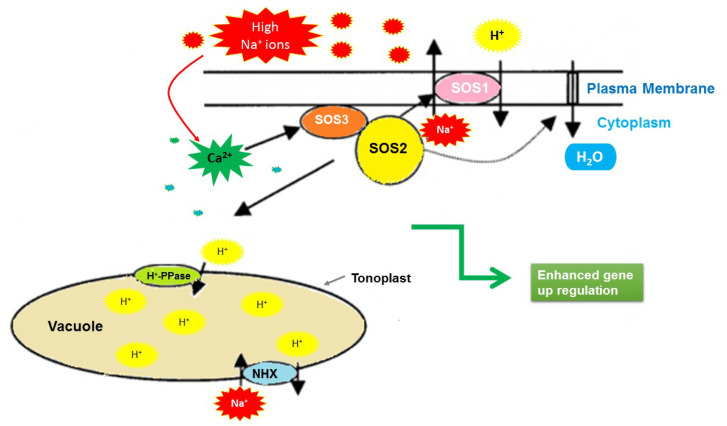
Salt stress is one of the major significant restrictions that hamper plant development and agriculture ecosystems worldwide. Novel climate-adapted cultivars and stress tolerance-enhancing molecules are increasingly appreciated to mitigate the detrimental impacts of adverse stressful conditions. Sorghum is a valuable source of food and a potential model for exploring and understanding salt stress dynamics in cereals and for gaining a better understanding of their physiological pathways. Herein, we evaluate the antioxidant scavengers, photosynthetic regulation, and molecular mechanism of ion exclusion transporters in sorghum genotypes under saline conditions. A pot experiment was conducted in two sorghum genotypes viz. SSG 59-3 and PC-5 in a climate-controlled greenhouse under different salt concentrations (60, 80, 100, and 120 mM NaCl). Salinity drastically affected the photosynthetic machinery by reducing the accumulation of chlorophyll pigments and carotenoids. SSG 59-3 alleviated the adverse effects of salinity by suppressing oxidative stress (H2O2) and stimulating enzymatic and non-enzymatic antioxidant activities (SOD, APX, CAT, POD, GR, GST, DHAR, MDHAR, GSH, ASC, proline, GB), as well as protecting cell membrane integrity (MDA, electrolyte leakage). Salinity also influenced Na+ ion efflux and maintained a lower cytosolic Na+/K+ ratio via the concomitant upregulation of SbSOS1, SbSOS2, and SbNHX-2 and SbV-Ppase-II ion transporter genes in sorghum genotypes. Overall, these results suggest that Na+ ions were retained and detoxified, and less stress impact was observed in mature and younger leaves. Based on the above, we deciphered that SSG 59-3 performed better by retaining higher plant water status, photosynthetic assimilates and antioxidant potential, and the upregulation of ion transporter genes and may be utilized in the development of resistant sorghum lines in saline regions.
Keywords: antioxidants; ion transporters; oxidative stress; proline; reactive oxygen species (ROS); salinity; sorghum.
Conflict of interest statement
The authors declare that there is no conflict of interest regarding the publication of this paper.
Figures
Similar articles
-
Deciphering Reserve Mobilization, Antioxidant Potential, and Expression Analysis of Starch Synthesis in Sorghum Seedlings under Salt Stress.Plants (Basel). 2021 Nov 15;10(11):2463. doi: 10.3390/plants10112463. Plants (Basel). 2021. PMID: 34834826 Free PMC article.
-
Exogenous Melatonin Counteracts NaCl-Induced Damage by Regulating the Antioxidant System, Proline and Carbohydrates Metabolism in Tomato Seedlings.Int J Mol Sci. 2019 Jan 16;20(2):353. doi: 10.3390/ijms20020353. Int J Mol Sci. 2019. PMID: 30654468 Free PMC article.
-
Genome-Wide Transcriptome Profiling, Characterization, and Functional Identification of NAC Transcription Factors in Sorghum under Salt Stress.Antioxidants (Basel). 2021 Oct 13;10(10):1605. doi: 10.3390/antiox10101605. Antioxidants (Basel). 2021. PMID: 34679740 Free PMC article.
-
Sorghum under saline conditions: responses, tolerance mechanisms, and management strategies.Planta. 2021 Jul 5;254(2):24. doi: 10.1007/s00425-021-03671-8. Planta. 2021. PMID: 34224010 Review.
-
Photosynthetic Regulation Under Salt Stress and Salt-Tolerance Mechanism of Sweet Sorghum.Front Plant Sci. 2020 Jan 15;10:1722. doi: 10.3389/fpls.2019.01722. eCollection 2019. Front Plant Sci. 2020. PMID: 32010174 Free PMC article. Review.
Cited by
-
Current advances in the molecular regulation of abiotic stress tolerance in sorghum via transcriptomic, proteomic, and metabolomic approaches.Front Plant Sci. 2023 May 10;14:1147328. doi: 10.3389/fpls.2023.1147328. eCollection 2023. Front Plant Sci. 2023. PMID: 37235010 Free PMC article. Review.
-
Investigating Mineral Accumulation and Seed Vigor Potential in Bottle Gourd (Lagenaria siceraria) through Crossbreeding Timing.Plants (Basel). 2023 Nov 28;12(23):3998. doi: 10.3390/plants12233998. Plants (Basel). 2023. PMID: 38068633 Free PMC article.
-
Superabsorbent Polymers as a Soil Amendment for Increasing Agriculture Production with Reducing Water Losses under Water Stress Condition.Polymers (Basel). 2022 Dec 29;15(1):161. doi: 10.3390/polym15010161. Polymers (Basel). 2022. PMID: 36616513 Free PMC article. Review.
-
Overexpression of soybean GmDHN9 gene enhances drought resistance of transgenic Arabidopsis.GM Crops Food. 2024 Dec 31;15(1):118-129. doi: 10.1080/21645698.2024.2327116. Epub 2024 Apr 2. GM Crops Food. 2024. PMID: 38564429 Free PMC article.
-
Nano-enhanced storage of American cotton using metal-oxide nanoparticles for improving seed quality traits.Sci Rep. 2024 Oct 18;14(1):24445. doi: 10.1038/s41598-024-71179-8. Sci Rep. 2024. PMID: 39424830 Free PMC article.
References
-
- Punia H., Tokas J., Malik A., Singh S., Phogat D.S., Bhuker A., Mor V.S., Rani A., Sheokand R.N. Discerning morpho-physiological and quality traits contributing to salinity tolerance acquisition in sorghum [Sorghum bicolor (L.) Moench] S. Afr. J. Bot. 2021;140:409–418. doi: 10.1016/j.sajb.2020.09.036. - DOI
-
- Corwin D.L., Scudiero E. Advances in Agronomy. Volume 158. Elsevier; Amsterdam, The Netherlands: 2019. Review of soil salinity assessment for agriculture across multiple scales using proximal and/or remote sensors; pp. 1–130.
-
- Shokat S., Großkinsky D.K. Tackling Salinity in Sustainable Agriculture—What Developing Countries May Learn from Approaches of the Developed World. Sustainability. 2019;11:4558. doi: 10.3390/su11174558. - DOI
MeSH terms
Substances
LinkOut - more resources
Full Text Sources
Medical
Research Materials
Miscellaneous
