. 2021 Dec 9;22(24):13256.
doi: 10.3390/ijms222413256.

Impaired Retromer Function in Niemann-Pick Type C Disease Is Dependent on Intracellular Cholesterol Accumulation

Affiliations

Impaired Retromer Function in Niemann-Pick Type C Disease Is Dependent on Intracellular Cholesterol Accumulation

Kristina Dominko et al. Int J Mol Sci. .

Abstract

Niemann-Pick type C disease (NPC) is a rare inherited neurodegenerative disorder characterized by an accumulation of intracellular cholesterol within late endosomes and lysosomes due to NPC1 or NPC2 dysfunction. In this work, we tested the hypothesis that retromer impairment may be involved in the pathogenesis of NPC and may contribute to increased amyloidogenic processing of APP and enhanced BACE1-mediated proteolysis observed in NPC disease. Using NPC1-null cells, primary mouse NPC1-deficient neurons and NPC1-deficient mice (BALB/cNctr-Npc1m1N), we show that retromer function is impaired in NPC. This is manifested by altered transport of the retromer core components Vps26, Vps35 and/or retromer receptor sorLA and by retromer accumulation in neuronal processes, such as within axonal swellings. Changes in retromer distribution in NPC1 mouse brains were observed already at the presymptomatic stage (at 4-weeks of age), indicating that the retromer defect occurs early in the course of NPC disease and may contribute to downstream pathological processes. Furthermore, we show that cholesterol depletion in NPC1-null cells and in NPC1 mouse brains reverts retromer dysfunction, suggesting that retromer impairment in NPC is mechanistically dependent on cholesterol accumulation. Thus, we characterized retromer dysfunction in NPC and propose that the rescue of retromer impairment may represent a novel therapeutic approach against NPC.

Keywords: NPC1; cholesterol homeostasis; endolysosomal pathway; neurodegeneration; neurodegenerative diseases; rare diseases; retromer.


Conflict of interest statement

The authors declare no conflict of interest.

Figures
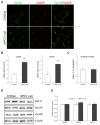
Figure 1
Figure 1
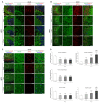
Retromer proteins accumulate in enlarged vesicles at the periphery in NPC1-null cells compared to CHOwt. (A) The cells were grown in 10% FBS in DMEM/F12 media, fixed and stained for Vps26 (green) and Vps35 (red). Cells were analyzed by confocal microscopy, and fluorescent signals were quantified using ImageJ software. (B) Size of Vps26 or Vps35-positive puncta and (C) colocalization of Vps26 and Vps35 were compared between CHOwt and NPC1-null cells, *** p < 0.001, n = 30 cells per group from three different experiments. (D,E) The levels of retromer proteins Vps26 and Vps35 and retromer receptor sorLA, analyzed by western blot, did not reveal any differences in the protein levels. Protein signals were quantified using the ImageJ software. The statistical significance of the tests was set at p < 0.05. The data are shown as mean ± SD normalized to control and represent data from three different experiments in duplicates, n = 6 per group. Scale bar—20 µm.
Figure 2
Figure 2
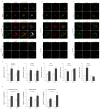
Retromer trafficking within the endolysosomal pathway is altered in NPC1-null cells. Trafficking of the retromer protein Vps35 in CHOwt and NPC1-null cells was monitored by immunofluorescence (AC), and the obtained signals were quantified using ImageJ software (D,E). The cells were grown in 10% FBS in DMEM/F12 media, fixed and stained for Vps35 (green) and (A) early endosome marker EEA1 (red), (B) recycling endosome marker transferrin receptor (TfR, red) and (C) lysosome marker LAMP1. Filipin was used to stain free cholesterol. (D) Size of EEA1, TfR and LAMP1-positive puncta and (E) colocalization of Vps35 with EEA1, TfR and LAMP1 were compared between CHOwt and NPC1-null cells, *** p < 0.001. The data are shown as mean ± SD normalized to control, n = 30 cells per group from three independent experiments. Scale bar—20 µm (unzoomed images) and 10 µm (zoomed images).
Figure 3
Figure 3
Colocalization of Vps35-positive vesicles and APP-CT is increased in NPC1-null cells. (A) The cells were grown in 10% FBS in DMEM/F12 media, fixed and stained for Vps35 (green) and C-terminal APP antibody (APP-CT), which detects full-length-APP and the membrane-bound C-terminal APP fragments. Filipin was used for the staining of free cholesterol. Cells were analyzed by confocal microscopy, and fluorescent signals were quantified using ImageJ software. (B) Colocalization of Vps35 and APP-CT was compared between CHOwt and NPC1-null cells, *** p < 0.001. The data are shown as mean ± SD normalized to control, n = 30 cells per group from three different experiments. Scale bar—20 µm (unzoomed figures) and 10 µm (zoomed figures).
Figure 4
Figure 4
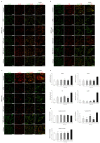
Altered distribution of Vps35 and sorLA in NPC1 mouse brains is already observed at the presymptomatic stage of the disease. Shown are the results of Vps35 and sorLA immunostaining of 4, 7 and 10-week old NPC1 vs. wt mouse cerebella (A), hippocampi (B) and cortices (C). (D) The obtained immunofluorescent signals in (AC) were quantified using the ImageJ software. The *** (p < 0.001) represents statistically significant signal intensities in comparison to wt brains; +++ (p < 0.001) in comparison to NPC1 4-week old brains and ### (p < 0.001) in comparison to NPC1 7-week old brains. The data are shown as mean ± SD normalized to control and represent data from three different experiments, n = 9 slices per animal, 6 animals per group. Scale bar—100 µm (unzoomed pictures) and 20 µm (zoomed pictures).
Figure 5
Figure 5
Endosomal fractionation reveals an altered retromer and endocytic distribution between NPC1 and wt-mouse cerebella. Eleven cerebellar fractions (of 1 mL) of 10-week old wt and NPC1 mice were collected from the top of the gradient and were analyzed by Western blotting, as indicated in the material and methods section. (A) Western blot analyses of Vps35 (retromer complex protein), sorLA (sortilin-related receptor) and endocytic markers EEA1 (early endosomes), Rab7 (late endosomes) and LAMP1 (lysosomes). Graphs represent quantified protein signals of Vps35, sorLA, EEA1, Rab7 and LAMP1 in each fraction of wt and NPC1 mice, obtained by signal quantification using the ImageJ software, normalized to protein concentration in the corresponding PNS. (B) Western blot analyses of BACE1 substrate Sez6L and BACE1. Graphs represent quantified protein signals of Sez6L and BACE1 in each fraction of wt and NPC1 mice, obtained by signal quantification using the ImageJ software, normalized to protein concentration in the corresponding PNS. (C) The levels of free cholesterol were determined in early endosome (EE) and late endosome fractions (LE), fractions 4 and 5, and fractions 1 and 2, respectively, from the cerebellum of 10-week old NPC1 and wt-mice by Amplex Red cholesterol assay (Student’s t-test, * p < 0.05). The shown data are from three different experiments, n = 3 cerebella per group.
Figure 6
Figure 6
Retromer protein Vps35 accumulates within enlarged endolysosomal EEA1, TfR and LAMP1-positive vesicles in NPC1 hippocampal neurons. Hippocampal neurons were isolated at postnatal day 0 (P0), grown in culture for 14 DIV, fixed and stained for Vps35 (green) and (A) lysosomal marker LAMP1 (red), (B) transferrin receptor TfR (red) and (C) early endosome marker EEA1 (red). Filipin was used for the staining of free cholesterol. Cells were analyzed using confocal microscopy, and fluorescent signals were quantified using ImageJ software. (D) Size of Vps35, LAMP1, TfR, EEA1 and filipin-positive vesicles and (E) colocalization of Vps35 and EEA1, TfR and LAMP1 in neuronal soma and axons was compared between wt and NPC1 neurons, * p < 0.05, *** p < 0.001. The data are shown as mean ± SD normalized to control, n = 20 neurons per group from three different experiments. Scale bar—20 µm (unzoomed figures) and 10 µm (zoomed figures).
Figure 7
Figure 7
Vps35 is present in axonal swellings of hippocampal NPC1 neurons. Hippocampal neurons were isolated at postnatal day 0 (P0), grown in culture for 14 DIV, fixed and stained for Vps35 (green), lysosomal marker LAMP1 (red) and neuronal marker TUJ-1 (blue). Cells were analyzed using confocal microscopy. The axonal swelling is depicted by white square and in zoomed picture. Scale bar—50 µm (unzoomed) and 10 µm (zoom).
Figure 8
Figure 8
Retromer and endolysosomal trafficking defect is rescued upon cholesterol depletion in vitro in NPC1-null cells. Cholesterol levels in NPC1-null cells were lowered using four different approaches: LPDS-, LPDS+lovastatin, methyl-β cyclodextrin (MβC)-acute and MβC-chronic treatment. After treatments, cells were fixed and stained for (A) Vps26 (green) and Vps35 (red), (B) Vps35 (green) and transferrin receptor, TfR (red) and (C) Vps35 (green) and lysosomal marker, LAMP1 (red). Cells were analyzed by confocal microscopy, and fluorescent signals were quantified using ImageJ software (D,E). (D) Size of Vps26, Vps35, TfR and LAMP1-positive puncta were compared to the data obtained in untreated NPC1-null cells (*** p < 0.001). (E) Colocalization of the indicated markers was compared to the data obtained in untreated NPC1-null cells (*** p < 0.001). The data are shown as mean ± SD normalized to control and represent data from three independent experiments, n = 30 cells per group. Scale bar—20 µm (unzoomed pictures) and 10 µm (zoomed pictures).
Figure 9
Figure 9
Cholesterol-loading in CHOwt cells causes retromer trafficking defect similar to that as in NPC1-null cells. The cells were grown in 10% FBS in DMEM/F12 media. Cholesterol levels were increased in vitro in CHOwt cells using U18666A and MβC-cholesterol complex treatment, after which they were fixed and stained for (A) Vps26 (green) and Vps35 (red), or Vps35 (green) and (B) early endosome marker EEA1, (C) transferrin receptor (TfR, red), (D) late endosome marker Rab7 or (E) lysosomal marker LAMP1 (red). Cells were analyzed by confocal microscopy, and fluorescent signals were quantified using ImageJ software (F,G). (F) Size of Vps26, Vps35, EEA1, TfR, Rab7 and LAMP1-positive puncta were compared to the data obtained in untreated CHOwt cells (*** p < 0.001). (G) Colocalization of the indicated markers was compared to the data obtained in untreated CHOwt cells (*** p < 0.001). The data are shown as mean ± SD normalized to control and represent data from three independent experiments, n = 30 cells per group. Scale bar—20 µm (unzoomed pictures) and 10 µm (zoomed pictures).
Figure 10
Figure 10
SorLA and Vps35 distribution in the cortex of 10-week old NPC1 mice is rescued by cholesterol depletion in vivo. NPC1 mice were treated with cholesterol-lowering therapy, MβCD or statin (fluvastatin). (A) Immunostaining of Vps35 (green) and sorLA (red) was analyzed by confocal microscopy. (B) Fluorescent signals (integrated density) were quantified using ImageJ software and compared to untreated NPC1-mice (*** p < 0.001). The data are shown as mean ± SD normalized to control and represent data from three different experiments, n = 9 slices per animal, 6 animals per group. Scale bar—100 µm (unzoomed pictures) and 20 µm (zoomed pictures).

Similar articles

Cited by

References

    1. Cataldo A.M., Barnett J.L., Pieroni C., Nixon R.A. Increased Neuronal Endocytosis and Protease Delivery to Early Endosomes in Sporadic Alzheimer’s Disease: Neuropathologic Evidence for a Mechanism of Increased β-Amyloidogenesis. J. Neurosci. 1997;17:6142–6151. doi: 10.1523/JNEUROSCI.17-16-06142.1997. - DOI - PMC - PubMed
    1. Cataldo A.M., Petanceska S., Terio N.B., Peterhoff C.M., Durham R., Mercken M., Mehta P.D., Buxbaum J., Haroutunian V., Nixon R.A. Aβ localization in abnormal endosomes: Association with earliest Aβ elevations in AD and Down syndrome. Neurobiol. Aging. 2004;25:1263–1272. doi: 10.1016/j.neurobiolaging.2004.02.027. - DOI - PubMed
    1. Nixon R.A., Cataldo A.M., Mathews P.M. The endosomal-lysosomal system of neurons in Alzheimer’s disease pathogenesis: A review. Neurochem. Res. 2000;25:1161–1172. doi: 10.1023/A:1007675508413. - DOI - PubMed
    1. Lauritzen I., Pardossi-Piquard R., Bourgeois A., Pagnotta S., Biferi M.G., Barkats M., Lacor P., Klein W., Bauer C., Checler F. Intraneuronal aggregation of the β-CTF fragment of APP (C99) induces Aβ-independent lysosomal-autophagic pathology. Acta Neuropathol. 2016;132:257–276. doi: 10.1007/s00401-016-1577-6. - DOI - PMC - PubMed
    1. Seaman M.N., McCaffery J.M., Emr S.D. A membrane coat complex essential for endosome-to-Golgi retrograde transport in yeast. J. Cell Biol. 1998;142:665–681. doi: 10.1083/jcb.142.3.665. - DOI - PMC - PubMed

MeSH terms