. 2021 Dec 9;22(24):13260.
doi: 10.3390/ijms222413260.

Live-Cell Imaging of Single Neurotrophin Receptor Molecules on Human Neurons in Alzheimer's Disease

Affiliations

Live-Cell Imaging of Single Neurotrophin Receptor Molecules on Human Neurons in Alzheimer's Disease

Klaudia Barabás et al. Int J Mol Sci. .

Abstract

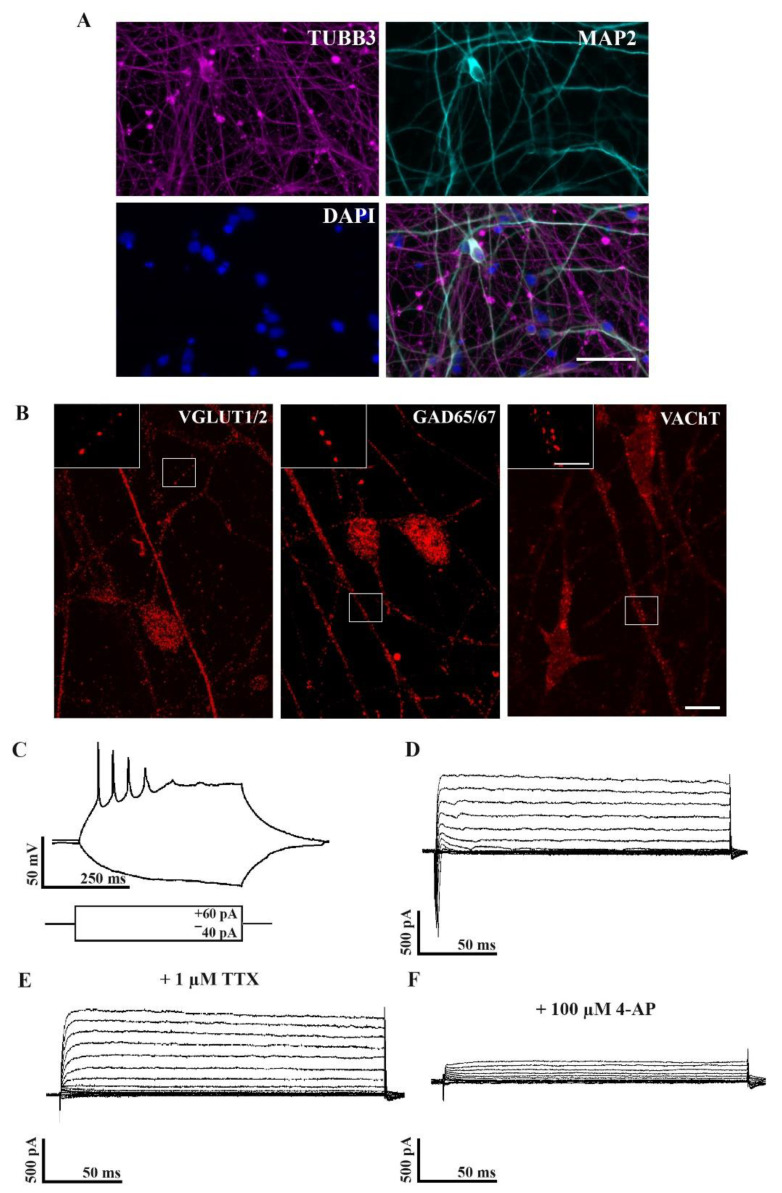
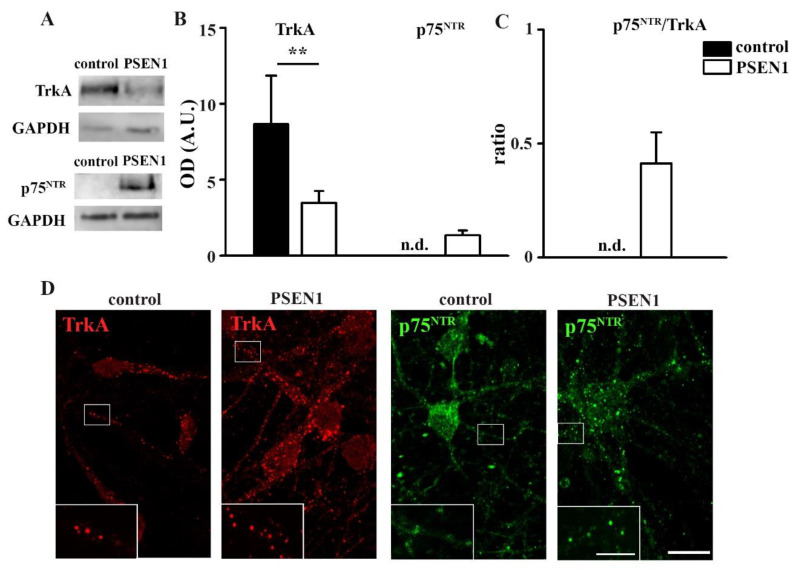
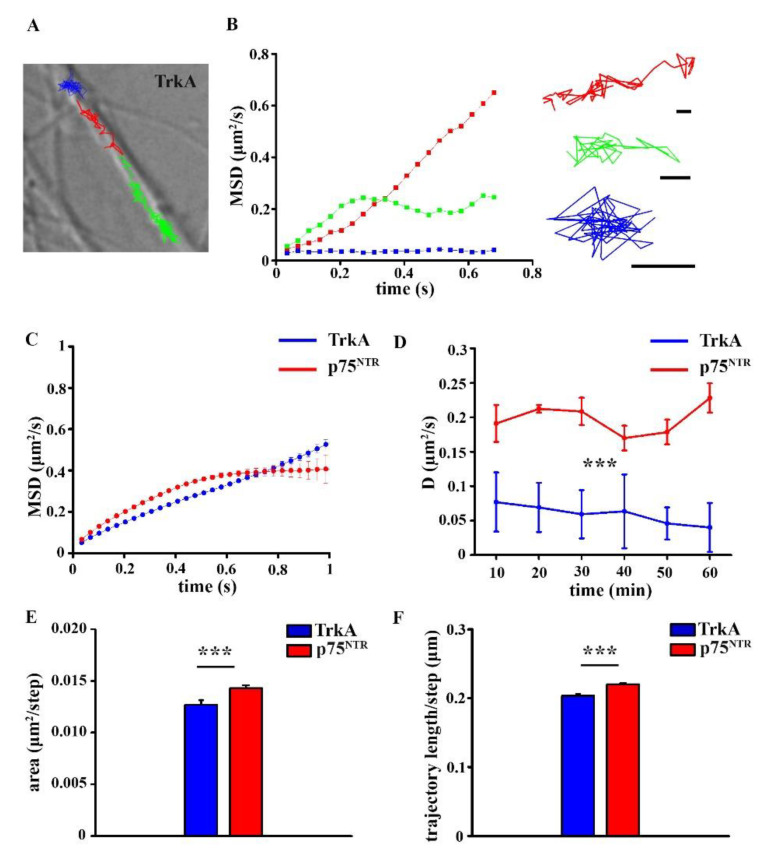
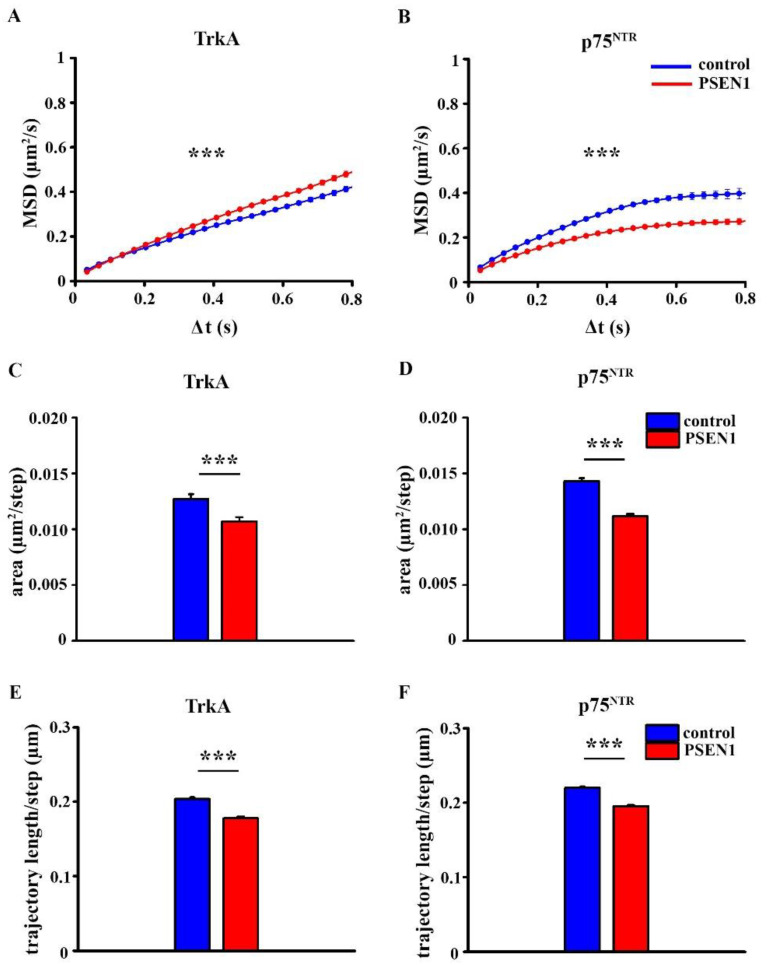
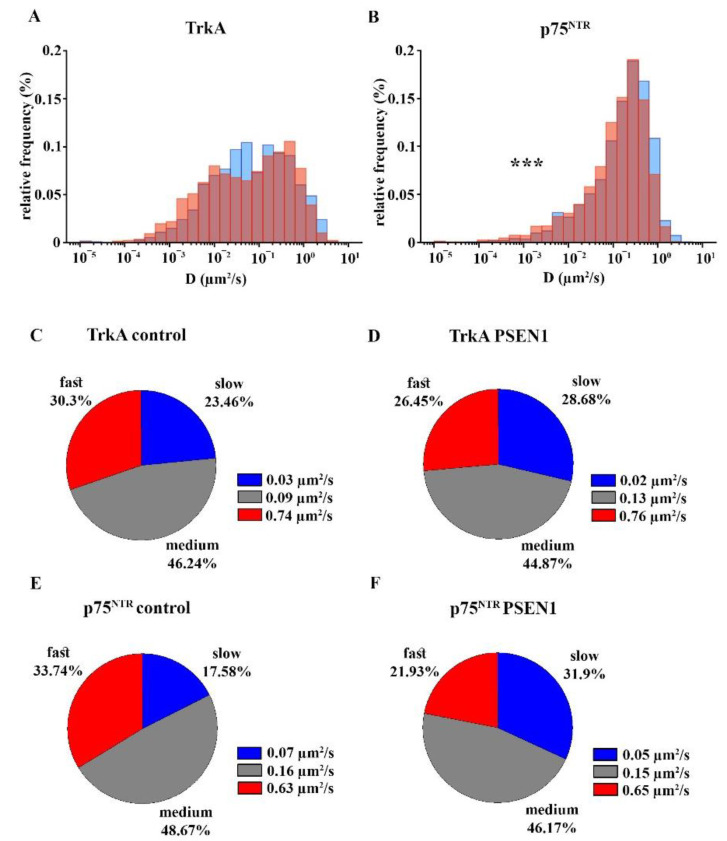
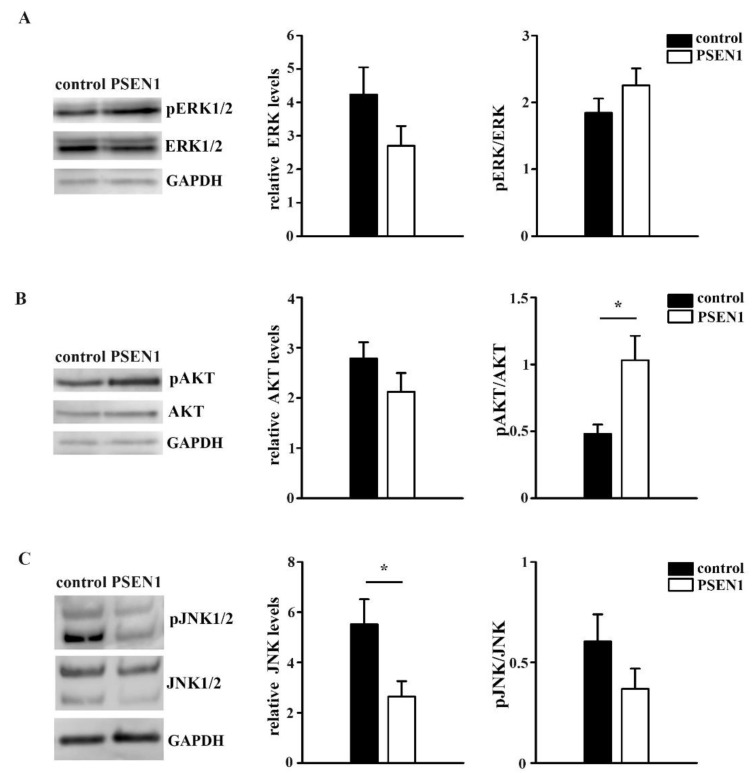
Neurotrophin receptors such as the tropomyosin receptor kinase A receptor (TrkA) and the low-affinity binding p75 neurotrophin receptor p75NTR play a critical role in neuronal survival and their functions are altered in Alzheimer's disease (AD). Changes in the dynamics of receptors on the plasma membrane are essential to receptor function. However, whether receptor dynamics are affected in different pathophysiological conditions is unexplored. Using live-cell single-molecule imaging, we examined the surface trafficking of TrkA and p75NTR molecules on live neurons that were derived from human-induced pluripotent stem cells (hiPSCs) of presenilin 1 (PSEN1) mutant familial AD (fAD) patients and non-demented control subjects. Our results show that the surface movement of TrkA and p75NTR and the activation of TrkA- and p75NTR-related phosphoinositide-3-kinase (PI3K)/serine/threonine-protein kinase (AKT) signaling pathways are altered in neurons that are derived from patients suffering from fAD compared to controls. These results provide evidence for altered surface movement of receptors in AD and highlight the importance of investigating receptor dynamics in disease conditions. Uncovering these mechanisms might enable novel therapies for AD.

Keywords: Alzheimer’s disease; TrkA; human-induced pluripotent stem cell; live-cell single-molecule imaging; neuronal; p75NTR; receptor dynamics.


Conflict of interest statement

J.K. and A.T. were the employee of BioTalentum Ltd. at the time when the published experiments were performed. A.D. is the director and owner of BioTalentum Ltd.

Figures

Figure 1
Figure 1
Neuronal phenotypes of differentiated hiPSCs. Immunofluorescence staining of microtubule-associated protein 2 (MAP2, red) and β–III tubulin (TUBB3, green) indicating that the hiPSC-derived neuronal cultures show neuronal phenotypes by week seven (A). Nuclei were labeled with DAPI (blue). Scale bar = 50 µm. Images depict VGLUT1/2, GAD65/67, and VAChT immunoreactivity in the cytoplasm and neurites of seven week old human iPSC-derived neurons (B). Inserts demonstrate VGLUT1/2, GAD65/67, and VAChT immunoreactive dots on neurites of hiPSCs. IPSC lines: Ctrl-2, fAD-1. Scale bar = 10 µm, insert = 5 µm. Whole-cell patch-clamp recordings show that maturing neurons (seven weeks old) generate action potentials (C) and display Na+ and K+ currents (D) that can be blocked by TTX (E) or 4-AP (F), respectively; n = 12.
Figure 2
Figure 2
Characterization of TrkA and p75NTR expression in control and PSEN1 mutant neurons. Representative blots represent TrkA and p75NTR expression in PSEN1 mutant cultures compared to controls (A). IPSC lines: Ctrl-2, fAD-1; n = 6. Histograms demonstrate TrkA (A), p75NTR (B) expression in PSEN1 mutant neuronal cultures compared to controls and their ratio (C) (** p < 0.01). Images show TrkA (red) and p75NTR (green) expression in the cytoplasm and neurites of seven week old controls (Ctrl-2) and PSEN1 mutant neurons (fAD-1) (D). The data are expressed in optical densities (pixel/area) ± SEM. Scale bar = 20 µm, scale bar insert = 5 µm.
Figure 3
Figure 3
Single-molecule imaging of TrkA and p75NTR in control neurons. Representative trajectories of TrkA molecules on neurites (A). Scale bar: 5 µm. The mean square displacement (MSD) functions represent TrkA molecules with different diffusion modes (B). Scale bars: 0.5 µm. MSD-Δt plots show the diffusion mode of TrkA and p75NTR in the control neurites (C). The diffusion coefficient of TrkA and p75NTR are shown on healthy individual-derived neurites at different time points (D). Histograms display the diffusion area (E) and the trajectory length (F) of TrkA and p75NTR molecules in control neurites. The data are expressed as mean ± SEM (*** p < 0.001). The number of trajectories of TrkA in the control and PSEN1 mutant neurons = 1154; 1246, the number of trajectories of p75NTR in control and PSEN1 mutant neurons = 1830; 2148. IPSC lines: Ctrl-1, Ctrl-2, Ctrl-3; fAD-1; fAD-2, fAD-3.
Figure 4
Figure 4
MSD-Δt plots, diffusion area, and trajectory length of TrkA and p75NTR in the control and PSEN1 mutant neurons. MSD curves show the diffusion modes of TrkA (A) and p75NTR (B) in non-demented and PSEN1 mutant neurites. Graphs display the diffusion area of TrkA (C) and p75NTR (D) in the control and PSEN1 mutant neurites. Histograms exhibit the trajectory length of TrkA (E) and p75NTR (F) in control and PSEN1 mutant neurites. The data are expressed as mean ± SEM (*** p < 0.001). The number of trajectories of TrkA in control and PSEN1 mutant neurons = 1154; 1246, the number of trajectories of p75NTR in control and PSEN1 mutant neurons = 1830; 2148. IPSC lines: Ctrl-1, Ctrl-2, Ctrl-3; fAD-1; fAD-2, fAD-3.
Figure 5
Figure 5
Distribution of the diffusion coefficients and the percentage of slow, medium, and fast fractions of TrkA and p75NTR in the control and PSEN1 mutant neurons. Logarithmic distribution histograms show the relative frequency of different diffusion intervals in the range of 10−5–10 µm2/s for TrkA (A) and p75NTR (B) in control (blue bars) and PSEN1 mutant neurites (red bars). The number of trajectories of TrkA in control and PSEN1 mutant neurons = 1154; 1246, p75NTR: the number of trajectories of p75NTR in control and PSEN1 mutant neurons = 1830; 2148. Pie charts demonstrate the percentage of slow, medium, and fast fractions of the trajectories of TrkA (C,D) and p75NTR (E,F) per neurite and their average diffusion coefficients in the control (C,E) and PSEN1 mutant neurons (D,F). The data are expressed as mean ± SEM (*** p < 0.001). The number of neurites in the control and PSEN1 mutant cultures for TrkA = 142; 197, the number of neurites in the control and PSEN1 mutant cultures for p75NTR = 154; 219. IPSC lines: Ctrl-1, Ctrl -2, Ctrl -3; fAD-1; fAD-2, fAD-3.
Figure 6
Figure 6
Signaling pathways in the control and PSEN1 mutant neurons. Representative blots illustrate the expression levels of pERK1/2, ERK1/2, pAKT, AKT, pJNK1/2, and JNK1/2 signaling molecules and GAPDH in PSEN1 mutant and control cultures. Histograms show the expression of ERK (A), AKT (B), JNK (C) normalized to GAPDH and their ratio of pERK/ERK, pAKT/AKT, and pJNK/JNK in the PSEN1 mutant cultures compared to controls. The data are expressed in optical densities (pixel/area) ± SEM (* p < 0.05), IPSC lines: Ctrl-2, fAD-1; n = 6.

References

    1. Shibata S.C., Hibino K., Mashimo T., Yanagida T., Sako Y. Formation of signal transduction complexes during immobile phase of NGFR movements. Biochem. Biophys. Res. Commun. 2006;342:316–322. doi: 10.1016/j.bbrc.2006.01.126. - DOI - PubMed
    1. Yanagawa M., Hiroshima M., Togashi Y., Abe M., Yamashita T., Shichida Y., Murata M., Ueda M., Sako Y. Single-molecule diffusion-based estimation of ligand effects on G protein–coupled receptors. Sci. Signal. 2018;11:eaao1917. doi: 10.1126/scisignal.aao1917. - DOI - PubMed
    1. Bohush A., Niewiadomska G., Filipek A. Role of Mitogen Activated Protein Kinase Signaling in Parkinson’s Disease. Int. J. Mol. Sci. 2018;19:2973. doi: 10.3390/ijms19102973. - DOI - PMC - PubMed
    1. Albert-Gascó H., Ros-Bernal F., Castillo-Gómez E., Olucha-Bordonau F.E. MAP/ERK Signaling in Developing Cognitive and Emotional Function and Its Effect on Pathological and Neurodegenerative Processes. Int. J. Mol. Sci. 2020;21:4471. doi: 10.3390/ijms21124471. - DOI - PMC - PubMed
    1. Hers I., Vincent E.E., Tavaré J.M. Akt signalling in health and disease. Cell. Signal. 2011;23:1515–1527. doi: 10.1016/j.cellsig.2011.05.004. - DOI - PubMed

MeSH terms