. 2021 Dec 13;22(24):13368.
doi: 10.3390/ijms222413368.

Melatonin Protects Tobacco Suspension Cells against Pb-Induced Mitochondrial Dysfunction

Affiliations

Melatonin Protects Tobacco Suspension Cells against Pb-Induced Mitochondrial Dysfunction

Agnieszka Kobylińska et al. Int J Mol Sci. .

Abstract

Recent studies have shown that melatonin is an important molecule in plant physiology. It seems that the most important is that melatonin effectively eliminates oxidative stress (direct and indirect antioxidant) and switches on different defence strategies (preventive and interventive actions) during environmental stresses. In the presented report, exogenous melatonin potential to protect Nicotiana tabacum L. line Bright Yellow 2 (BY-2) exposed to lead against death was examined. Analyses of cell proliferation and viability, the level of intracellular calcium, changes in mitochondrial membrane potential (ΔΨm) as well as possible translocation of cytochrome c from mitochondria to cytosol and subsequent caspase-like proteolytic activity were conducted. Our results indicate that pretreatment BY-2 with melatonin protected tobacco cells against mitochondrial dysfunction and caspase-like activation caused by lead. The findings suggest the possible role of this indoleamine in the molecular mechanism of mitochondria, safeguarding against potential collapse and cytochrome c release. Thus, it seems that applied melatonin acted as an effective factor, promoting survival and increasing plant tolerance to lead.

Keywords: BY-2 tobacco cells; caspase-like protease; cytochrome c; melatonin; mitochondria; programmed cell death.


Conflict of interest statement

The authors declare no conflict of interest. The funders had no role in the design of the study; in the collection, analyses, or interpretation of data; in the writing of the manuscript; or in the decision to publish the results.

Figures
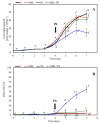
Figure 1
Figure 1
Kinetics of cell proliferation (A) and mortality (B) of BY-2 tobacco cells during conducted culture (0–7 days). Cell variants: C—BY-2 cells cultured on LS medium (the control variant); MEL—BY-2 cells cultured on LS medium with 200 nM of melatonin added from the beginning of the culture; Pb—BY-2 cells cultured on LS medium with 15 µM Pb2+ added on the fourth day of the culture and MEL+Pb—BY-2 cells cultured on LS medium with melatonin added from the start of the culture and with Pb2+ added on the fourth day of culture. (A) Proliferation of ANOVA results: Variant (C, MEL, Pb, MEL + Pb) F(3; 84) = 45.2 p < 0.00001; Day of culture (0, 1, 2, 3, 4, 5, 6, 7) F(7; 84) = 722.7 p < 0.00001; and interaction Variant x Day of culture F(21; 84) = 12.6 p < 0.00001. (B) Mortality ANOVA results: Variant (C, MEL, Pb, MEL + Pb) F(3; 71) = 334.7 p < 0.00001; Day of culture (0, 1, 2, 3, 4, 5, 6, 7) F(7; 71) = 165.6 p < 0.00001; and interaction Variant x Day of culture F(21; 71) = 98.4 p < 0.00001.
Figure 2
Figure 2
Ca2+ concentration in all experimental variants of BY-2 tobacco cells exposed to lead. Cell variants: C—BY-2 cells cultured on LS medium (the control variant); MEL—BY-2 cells cultured on LS medium with 200 nM melatonin added from the beginning of the culture; Pb—BY-2 cells cultured on LS medium with 15 µM Pb2+ added on the 4th day of the culture; and MEL+Pb—BY-2 cells cultured on LS medium with melatonin added from the start of the culture and with Pb2+ added on the 4th day of culture. The intensity of Fluo-4-NW probe fluorescence was measured: 4, 24 and 72 h after lead treatment. Fluorescence of BY-2 control cells (C) above indicated that moments of the experiment were assumed as 100%. Ca2+ concentration ANOVA results: Variant (MEL, Pb, MEL + Pb) F(2; 18) = 157 p < 0.00001; Hours of Pb exposure (4, 24, 72) F(3; 18) = 104.7 p < 0.00001; and interaction Variant x Hours of Pb exposure F(4; 18) = 30.9 p < 0.00001.
Figure 3
Figure 3
Changes in mitochondrial membrane potential (ΔΨm) of BY-2 tobacco cells in conducted experiments. Cell variants: C—BY-2 cells cultured on LS medium – the control variant; MEL—BY-2 cells cultured on LS medium with 200 nM melatonin added from the beginning of the culture; Pb—BY-2 cells cultured on LS medium with 15 µM Pb2+ added on the 4th day of the culture; and MEL+Pb—BY-2 cells cultured on LS medium with melatonin added from the start of the culture and with Pb2+ added on the 4th day of culture. Fluorescence ratio of JC-1 dimers/JC-1 monomers in BY-2 cells were measured 4, 24 and 72 h after lead treatment. Fluorescence of BY-2 control cells (C) in above indicated moments of the experiment were assumed as 100%. Mitochondrial membrane potential ANOVA results: Variant (MEL, Pb, MEL + Pb) F(2; 43) = 185.3 p < 0.00001; Hours of Pb exposure (4, 24, 72) F(2; 43) = 20.6 p < 0.00001; and interaction Variant x Hours of Pb exposure F(4; 43) = 2.2 p = 0.084.
Figure 4
Figure 4
Translocation of cytochrome c protein from mitochondria to the cytosol fraction in all experimental variants: C—BY-2 cells cultured on LS medium, the control variant; MEL—BY-2 cells cultured on LS medium with 200 nM melatonin added from the beginning of the culture; Pb—BY-2 cells cultured on LS medium with 15 µM Pb2+ added on the 4th day of the culture; and MEL+Pb—BY-2 cells cultured on LS medium with melatonin added from the start of the culture and with Pb2+ added on the 4th day of culture. Cells were exposed to lead for 4, 24 and 72 h. Then, samples were separated by SDS-PAGE and probed with antibodies to cytochrome c by Western blotting.
Figure 5
Figure 5
Optical density of cytochrome c in mitochondrial and cytosolic fraction in all experimental variants: C—BY-2 cells cultured on LS medium, the control variant; MEL—BY-2 cells cultured on LS medium with 200 nM melatonin added from the beginning of the culture; Pb—BY-2 cells cultured on LS medium with 15 µM Pb2+ added on the 4th day of the culture; and MEL+Pb—BY-2 cells cultured on LS medium with melatonin added from the start of the culture and with Pb2+ added on the 4th day of culture. Cells were exposed to lead for 4, 24 and 72 h. Then, samples were separated by SDS-PAGE, probed with antibody to cytochrome c by Western blotting and subsequently videodensitometry analysis was perfromed. (A) Cytochrome c in mitochondrial fraction ANOVA results: Variant (C, MEL, Pb, MEL + Pb) F(3; 16) = 36.5 p < 0.00001; Hours of Pb exposure (4, 24, 72) F(2; 16) = 261.5 p < 0.00001; and interaction Variant x Hours of Pb exposure F(6; 16) = 10.1 p < 0.0005. (B) Cytochrome c in cytosolic fraction ANOVA results: Variant (C, MEL, Pb, MEL + Pb) F(3; 12) = 17.4 p < 0.0005; Hours of Pb exposure (4, 24, 72) F(2; 12) = 57.5 p < 0.00001; and interaction Variant x Hours of Pb exposure F(6; 16) = 1.3 p = 0.323.
Figure 6
Figure 6
Measurements of caspase-like activities in tobacco cells: (A) caspase 9-like activity with (+Inh) or without the caspase-9 inhibitor Ac-LEHD-CHO; (B) caspase 3-like activity with (+Inh) or without the caspase-3 inhibitor Ac-DEVD-CHO. Cell variants: C—BY-2 cells cultured on LS medium (the control variant); MEL—BY-2 cells cultured on LS medium with 200 nM melatonin added from the beginning of the culture; Pb—BY-2 cells cultured on LS medium with 15 µM Pb2+ added on the 4th day of the culture; and MEL + Pb—BY-2 cells cultured on LS medium with melatonin added from the start of the culture and with Pb2+ added on the 4th day of culture. Caspase-like activities were measured 4, 24 and 72 h after lead exposure. (A) Caspase-9-like ANOVA results: Variant (LS, LS + Inh, MEL, MEL + Inh, Pb, PB + Inh, MEL + Pb, MEL + PB + Inh) F(7; 74) = 121 p < 0.00001; Hours of Pb exposure (4, 24, 72) F(2; 74) = 1.65 p = 0.198; and interaction Variant x Hours of Pb exposure F(14; 74) = 9.5 p < 0.00001. (B) Caspase-3-like ANOVA results: Variant (LS, LS + Inh, MEL, MEL + Inh, Pb, PB + Inh, MEL + Pb, MEL + PB + Inh) F(7; 87) = 180 p < 0.00001; Hours of Pb exposure (4, 24, 48) F(2; 87) = 45.5 p < 0.00001; and interaction Variant x Hours of Pb exposure F(14; 87) = 13.6 p < 0.00001.

References

    1. Nicholls A.M., Mal T.K. Effects of lead and copper exposure on growth of an invasive weed, Lythrum salicaria L. (Purple Loosestrife) Ohio J. Sci. 2003;103:129–133.
    1. Fahr M., Laplaze L., Bendaou N., Hocher V., El Mzibri M., Bogusz D., Smouni A. Effect of lead on root growth. Front. Plant Sci. 2013;4:175. doi: 10.3389/fpls.2013.00175. - DOI - PMC - PubMed
    1. Kabata-Pendias A. Trace Elements in Soils and Plants. 4th ed. CRC press; Boca Raton, FL, USA: 2010.
    1. Verbruggen N., Juraniec M., Baliardini C., Meyer C.L. Tolerance to cadmium in plants: The special case of hyperaccumulators. BioMetals. 2013;26:633–638. doi: 10.1007/s10534-013-9659-6. - DOI - PubMed
    1. Muszyńska E., Hanus-Fajerska E., Ciarkowska K. Studies on lead and cadmium toxicity in Dianthus carthusianorum calamine ecotype cultivated in vitro. Plant Biol. 2018;20:474–482. doi: 10.1111/plb.12712. - DOI - PubMed

MeSH terms

LinkOut - more resources