. 2021 Dec 15;22(24):13477.
doi: 10.3390/ijms222413477.

The Nutritional Supplement L-Alpha Glycerylphosphorylcholine Promotes Atherosclerosis

Affiliations

The Nutritional Supplement L-Alpha Glycerylphosphorylcholine Promotes Atherosclerosis

Zeneng Wang et al. Int J Mol Sci. .

Abstract

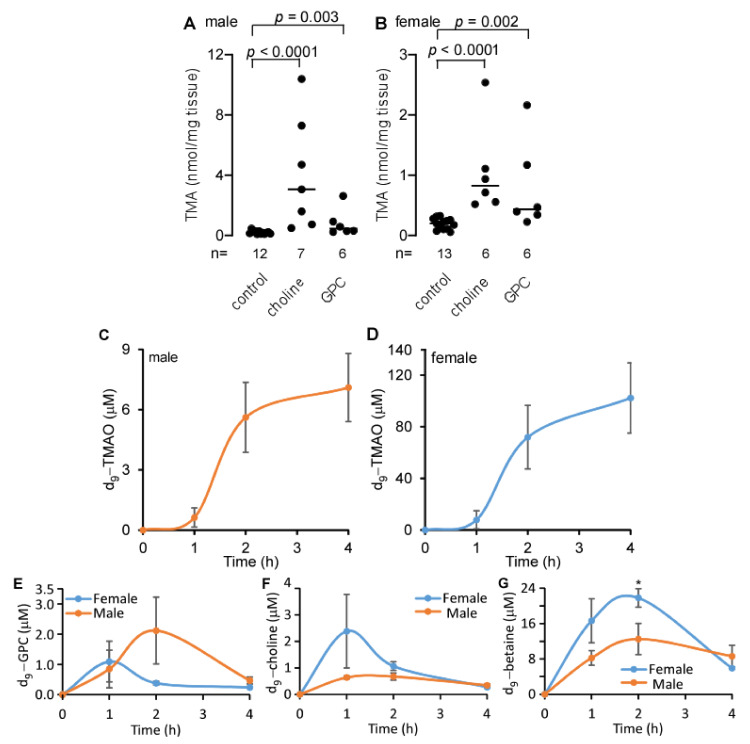
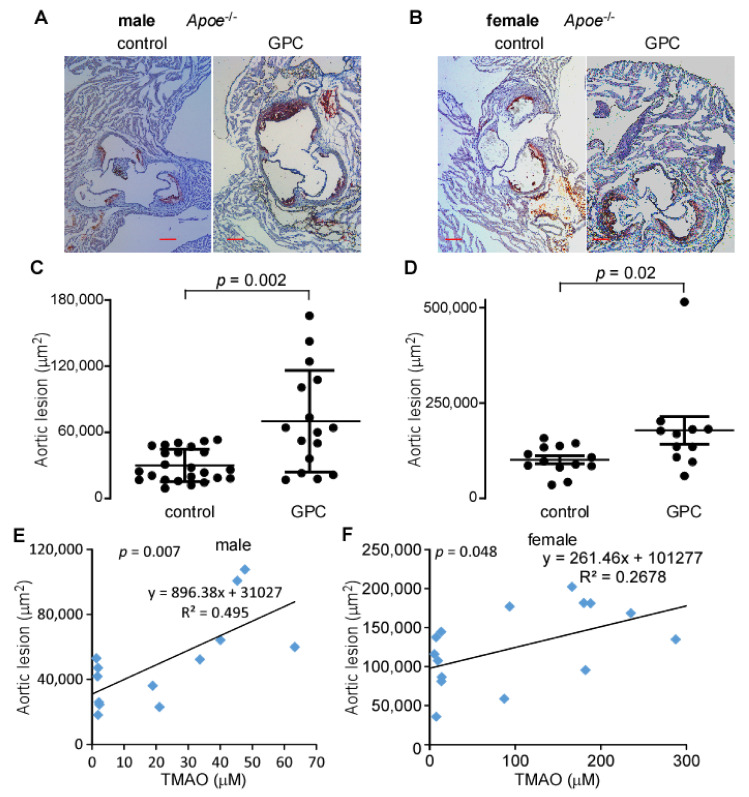
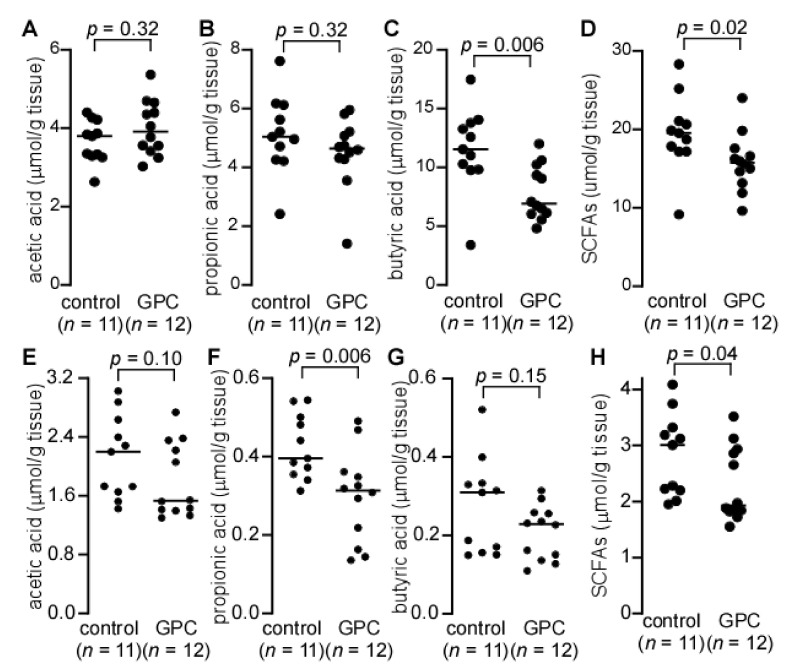
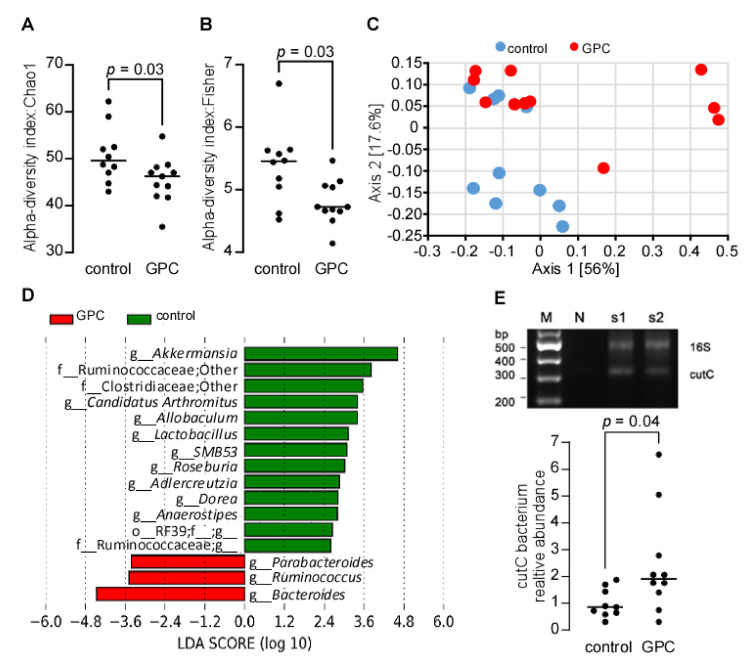
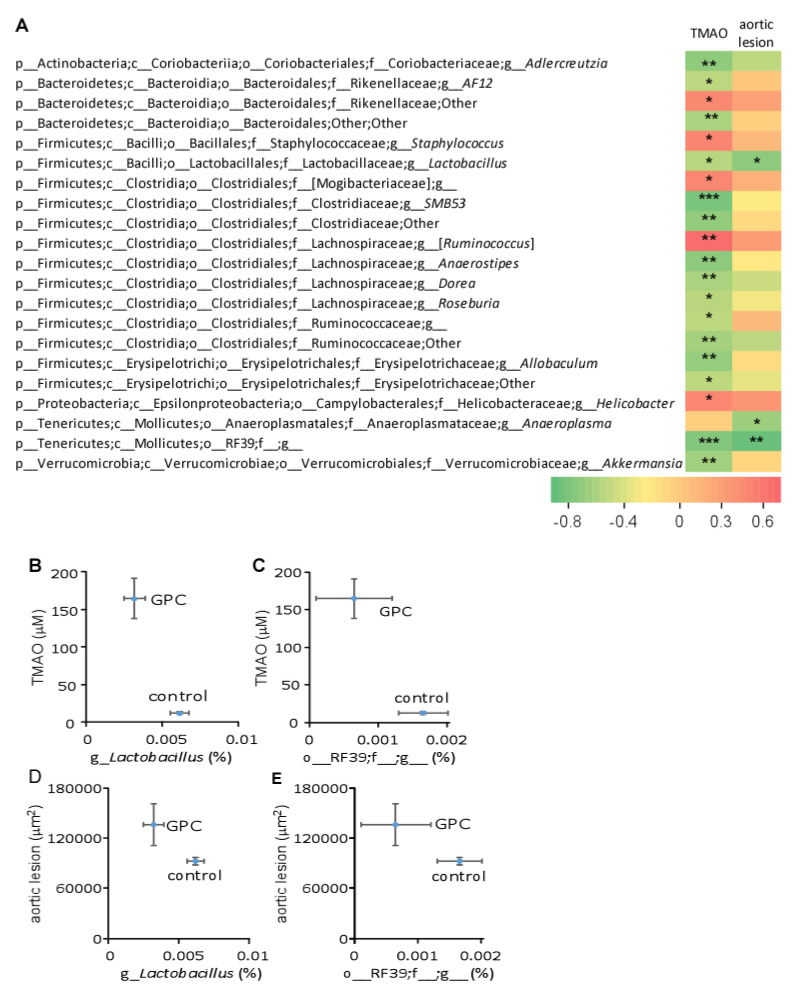
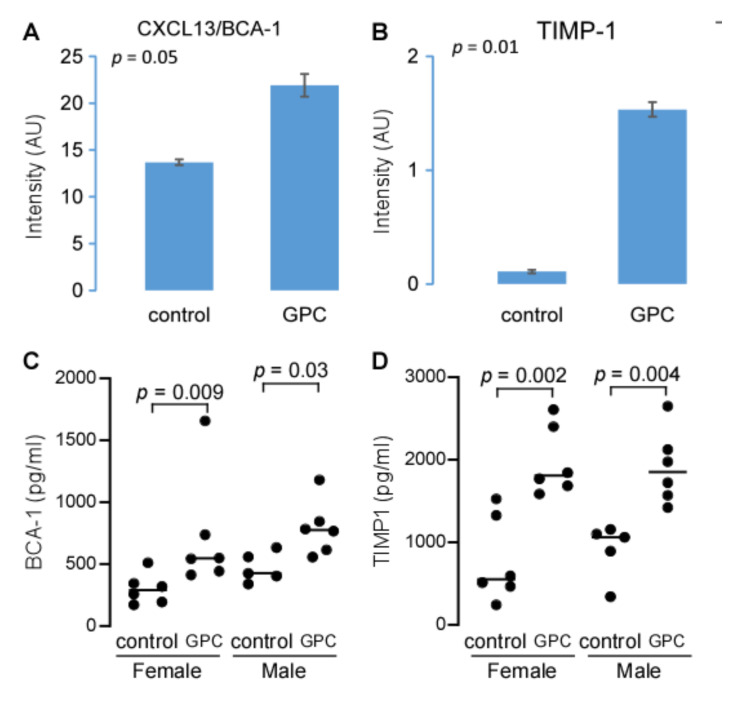
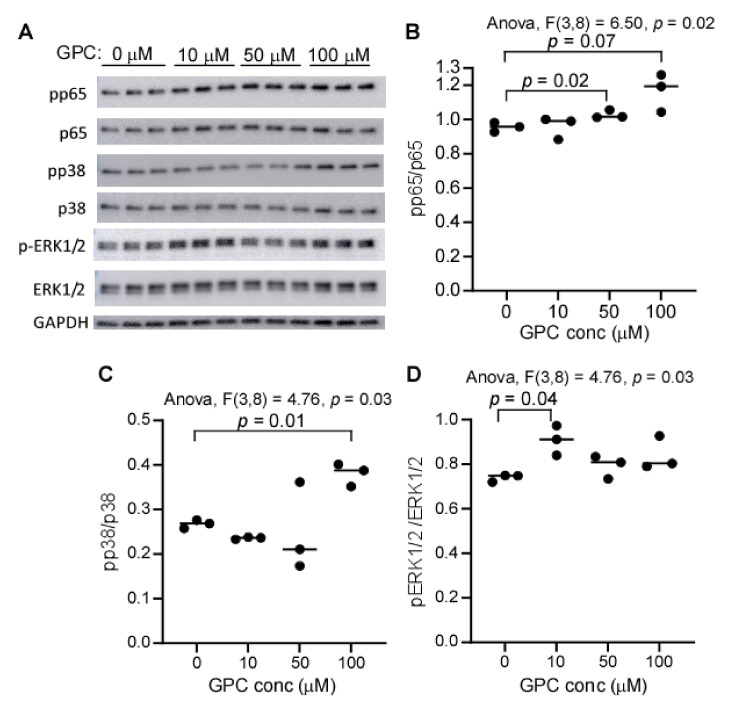
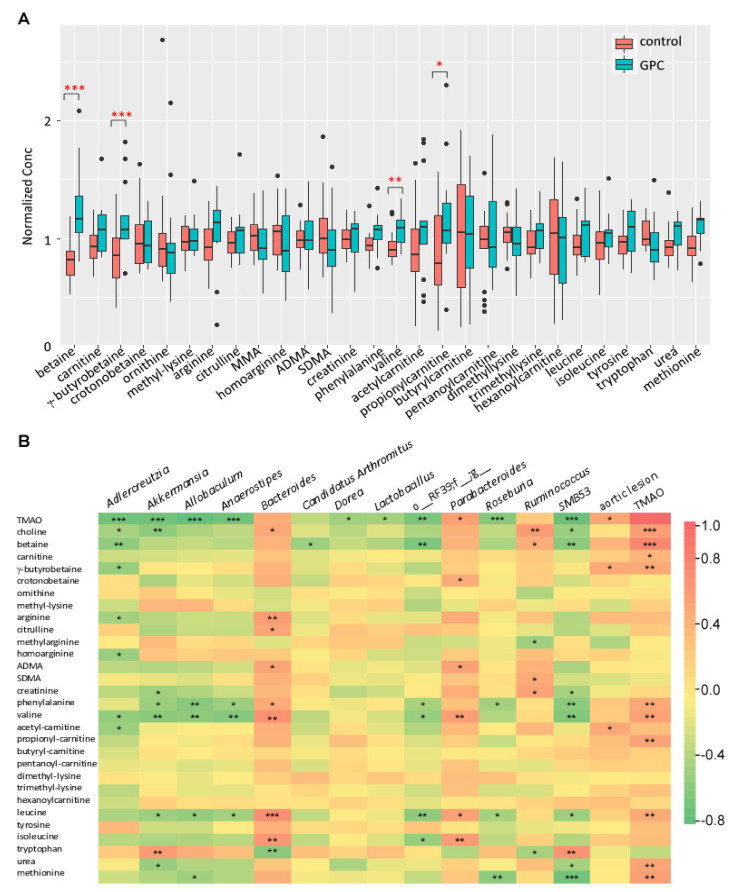
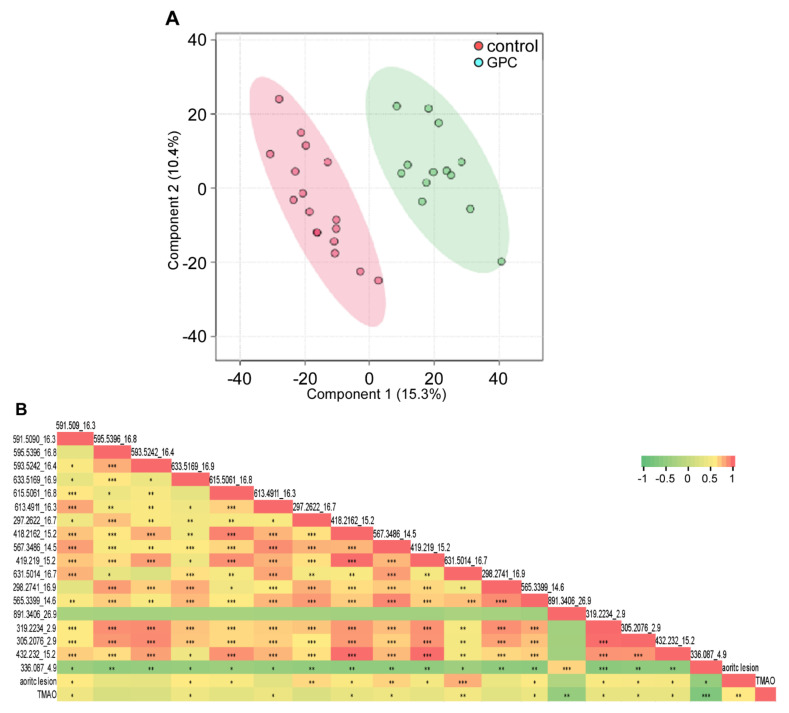
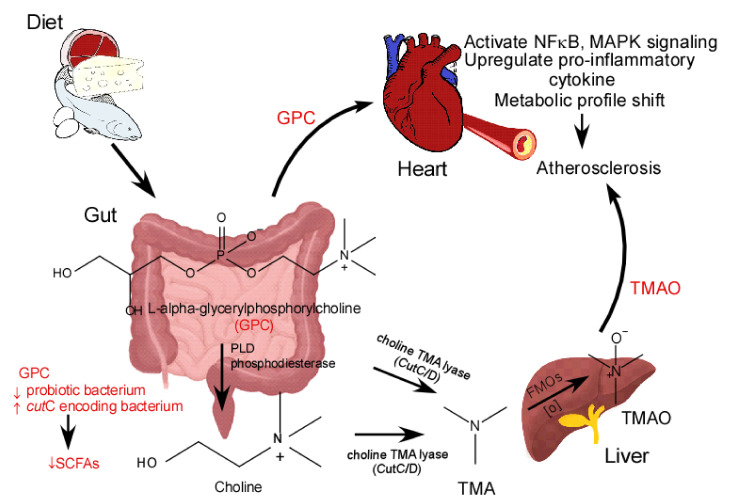
L-alpha glycerylphosphorylcholine (GPC), a nutritional supplement, has been demonstrated to improve neurological function. However, a new study suggests that GPC supplementation increases incident stroke risk thus its potential adverse effects warrant further investigation. Here we show that GPC promotes atherosclerosis in hyperlipidemic Apoe-/- mice. GPC can be metabolized to trimethylamine N-oxide, a pro-atherogenic agent, suggesting a potential molecular mechanism underlying the observed atherosclerosis progression. GPC supplementation shifted the gut microbial community structure, characterized by increased abundance of Parabacteroides, Ruminococcus, and Bacteroides and decreased abundance of Akkermansia, Lactobacillus, and Roseburia, as determined by 16S rRNA gene sequencing. These data are consistent with a reduction in fecal and cecal short chain fatty acids in GPC-fed mice. Additionally, we found that GPC supplementation led to an increased relative abundance of choline trimethylamine lyase (cutC)-encoding bacteria via qPCR. Interrogation of host inflammatory signaling showed that GPC supplementation increased expression of the proinflammatory effectors CXCL13 and TIMP-1 and activated NF-κB and MAPK signaling pathways in human coronary artery endothelial cells. Finally, targeted and untargeted metabolomic analysis of murine plasma revealed additional metabolites associated with GPC supplementation and atherosclerosis. In summary, our results show GPC promotes atherosclerosis through multiple mechanisms and that caution should be applied when using GPC as a nutritional supplement.

Keywords: L-alpha glycerylphosphorylcholine; atherosclerosis; microbiota; trimethylamine; trimethylamine N-oxide.


Conflict of interest statement

Wang and Hazen report being named as co-inventors on pending and issued patents held by the Cleveland Clinic relating to cardiovascular diagnostics and therapeutics. Wang and Hazen report having received royalty payments for inventions or discoveries related to cardiovascular diagnostics or therapeutics from Cleveland Heart Lab, a fully owned subsidiary of Quest Diagnostics, and Procter & Gamble. Hazen is a paid consultant for Procter & Gamble, Zehna Therapeutics, and has received research funds from Proctor & Gamble, Zehna Therapeutics, Pfizer Inc., and Roche Diagnostics. The other authors have reported that they have no relationships relevant to the contents of this paper to disclose.

Figures

Figure 1
Figure 1
GPC can be efficiently metabolized to TMA and choline after incubation with intestinal segments. (A,B) d9-TMA, (C,F) d9-GPC, and (D,E) d9-choline content after intestinal segments were incubated with 20 volumes of 50 µM d9-GPC (A,C,E) or d9-choline (B,D,F). Different intestinal segments were harvested from five female or three male C57/BL6J mice and incubated with d9-choline and d9-GPC under anaerobic conditions for 16 h. d9-TMA, d9-GPC, and d9-choline were quantified by LC-MS/MS, as described in Materials and Methods. Data are presented as mean ± SE from the indicated numbers of mice. p values were calculated by Student’s test, and only the values less than 0.05 are provided.
Figure 2
Figure 2
Similarity of GPC to choline as a precursor to produce TMA. (A) Proteus mirabilis 29906 lysate catalyzed d9-TMA production by utilizing d9-choline and d9-GPC as substrates. Three milligrams of protein equivalents of lysate were used to incubate with 100 µM d9-choline or d9-GPC in 2 mL PBS at 37 °C for 16 h. (B) d9-TMA and d6-TMA produced from d9-GPC and d6-choline after incubation with P. mirabilis cells at the indicated time, respectively. P. mirabilis was grown in LB medium overnight, and the bacterial cells after centrifugation were resuspended in ¼ volume of cold PBS with d9-GPC and d6-choline added, each at 100 µM. (C) Inhibition of d9-TMA and d6-TMA production from d9-GPC and d6-choline, respectively, in the presence of different concentrations of fluoromethylcholine (FMC) for 2 h. Bacterial culture and substrate incubation were conducted as described in panel (B). (D) Human fecal TMA lyase activity utilizing different substrates. Twenty volumes of 100 µM different d9-labeled substrates were incubated with fecal tissue for 16 h to quantify d9-TMA production by LC-MS. Fecal TMA lyase activity is expressed as pmol d9-TMA/mg feces/h. Comparison between substrates was conducted by Wilcoxon matched-pairs signed rank test, where p < 0.05 is considered significant. (E) Correlation of d6-TMA to d9-TMA after mouse cecal contents were incubated with 100 µM d9-GPC and 100 µM d6-choline at the same time for 16 h under anaerobic conditions, n = 23. (F) Correlation of d6-choline to d9-choline after cecal contents were incubated with d6-choline and d9-GPC, as described in panel E. d9-TMA and d6-TMA were quantified by LC-MS/MS, as described in Materials and Methods, and d6-choline and d9-choline were quantified by LC-MS/MS after being filtered through a 3K-cut off filter with d4-choline added as internal standard. Data are presented as mean ± SD from three replicates in panel (A), two replicates in panels (B,C), and ten replicates in panel (D), with scatter plots in panels (A,D).
Figure 3
Figure 3
Monitoring product formation after bacterial incubation with deuterated substrates. P. mirabilis, E. fergusonii, E. coli Top10, and L. acidophilus were cultured in LB medium overnight. 200 µL of overnight growth suspension was mixed with 200 µL 100 µM d9-GPC and d6-choline. After 10 min of incubation at 37 °C, bacterial suspensions were filtered through a 3K cutoff membrane, and the filtrate was mixed with d4-choline as internal standard to determine the concentrations of d9-GPC, d9-choline, and d6-choline. (AC) Ion extracted LC chromatograms in positive-ion multiple reaction monitoring mode with parent to daughter transitions of 267 → 125, 113 → 69, and 110 → 66, corresponding to d9-GPC (A), d9-choline (B), and d6-choline (C), respectively. (DF) concentrations of d9-GPC, d9-choline, and d6-choline, respectively, calculated after bacterial incubation. Each dot in panels (DF) denote an independent experiment.
Figure 4
Figure 4
GPC is abundant in the gut. GPC and choline distribution in the mouse gut. Four female C57BL/6J mice were sacrificed and the gut was collected to quantify GPC and choline by LC-MS. Data are presented as mean ± SE.
Figure 5
Figure 5
GPC supplementation increases cecal TMA and plasma TMAO production. (A,B) Cecal TMA content in LDLr−/− male (A) and female (B) mice fed choline, GPC supplemented chow diet, and control chow diet for one month. p values were calculated by Wilcoxon rank sum test. (C,D) Production of d9-TMAO in plasma of Apoe−/− male (C) and female (D) mice after oral gavage with 150 µL 150 mM d9-GPC. (EG) Plasma d9-GPC, d9-choline, and d9-betaine in Apoe−/− male and female mice after oral gavage with 150 µL 150 mM d9-GPC. Data are presented as mean ± SE from five male and five female mice in each group (CG). * p < 0.05 for comparison between male and female mice, determined by Student’s t test.
Figure 6
Figure 6
GPC promotes atherosclerosis. (A,B) Representative Oil-red-O/haematoxylin-stained aortic root sections from male (A) and female (B) C57BL/6J Apoe−/− mice fed control or GPC supplemented chow diets, scale bar = 0.2 mm. (C,D) Aortic lesion area in 20-week-old male (C) and female (D) C57BL/6J Apoe−/− mice fed GPC supplemented chow diet versus control chow diet. p values were calculated by Wilcoxon rank sum test. (E,F) Pearson correlation of aortic lesion to plasma TMAO in 20-week-old male and female C57BL/6J Apoe−/− mice fed either GPC supplemented chow diet or control chow diet for 16 weeks.
Figure 7
Figure 7
Cecal and fecal short chain fatty acids (SCFAs) in LDLr−/− mice fed GPC supplemented or control chow diet. (AD) LDLr−/− mice were fed GPC supplemented chow diet or control chow diet for one month and cecum was collected to quantify SCFAs. (EH) LDLr−/− mice were fed GPC supplemented chow diet or control chow diet for three weeks, and feces was collected to quantify SCFAs. Cecum and feces were homogenized in water with isotope labeled SCFAs, [13C2] acetic acid, [13C3] propionic acid, and [13C4] butyric acid added as internal standards. The filtrate was used to quantify SCFAs after derivatization by LC-MS. p values were calculated by Wilcoxon rank sum test. Panels (D,H) display total SCFAs, which is the sum of acetic acid, propionic acid, and butyric acid, from panels (AC) and (EG), respectively.
Figure 8
Figure 8
GPC supplementation shifts the gut microbial community. (A,B) alpha-diversity: Chao1 (A) and Fisher index (B) of gut microbiota community structure in female C57BL/6J Apoe−/− mice after 16 weeks on GPC supplemented (n = 11) or control chow diet (n = 10). Cecal DNA was extracted for 16S rRNA gene sequencing. (C) Principal coordinates analysis of weighted UniFrac distances of microbial community with proportion of variance explained by each principal coordinate axis denoted in each axis label. (D) LEfSe identified cecal microbial taxa enriched in GPC-fed mice vs. control chow diet-fed mice (p < 0.05 by the Kruskal–Wallis test, log10(LDA score) > 2). (E) RT-PCR quantitation of choline TMA lyase C subunit (CutC) encoding bacterium relative abundance in female C57BL/6J Apoe−/− mice fed either GPC supplemented chow or control chow diet. The relative abundance of CutC-containing bacteria was normalized to that of control chow diet feeding mice. The top panel in (E) is the confirmation of specificity for CutC and 16S rRNA gene PCR products from two typical samples by 2% agarose gel electrophoresis with no DNA template as negative control (N) and 100 bp DNA ladder as marker (M). p values were calculated by Wilcoxon rank sum test.
Figure 9
Figure 9
Bacterial taxa in mouse cecum that significantly correlate to either plasma TMAO level or aortic lesion area. (A) Spearman correlation heat map demonstrating the association between the indicated microbial taxonomic genera and TMAO concentrations or aortic lesion area. * p < 0.05; ** p < 0.01; *** p < 0.001. (BE) GPC supplementation shifts the relative abundance of two genera that significantly correlate with plasma TMAO level or aortic lesion area. Ten female C57BL/6J Apoe−/− mice fed control chow diet and 11 female C57BL/6J Apoe−/− mice fed GPC supplemented chow diet were utilized.
Figure 10
Figure 10
GPC increases expression of the pro-inflammatory chemokine CXCL13/BCA-1 and cytokine TIMP-1. (A,B) Comparison of plasma CXCL13/BCA-1 (A) and TIMP-1 (B) expression levels. Plasma was pooled from 10 female C57BL/6J LDLr−/− mice fed GPC supplemented chow diet, or 10 female mice fed control chow diet with 10 µL plasma each mouse. CXCL13/BCA-1 (A) and TIMP-1 (B) were determined by Proteome ProfilerTM Array using Mouse Cytokine Array Panel A kit. (C,D) BCA-1 and TIMP-1 concentrations in plasma were determined by ELISA. Each group contains 5 or 6 C57BL/6J LDLr−/− mice fed GPC supplemented chow diet or control chow diet, as indicated, for one month. p values in (A,B) were calculated by Student’s t test and in (C,D) by Wilcoxon rank sum test.
Figure 11
Figure 11
GPC activates NFκB and MAPK signaling in HCAEC. (A) SDS-PAGE/Western blotting analysis of ERK1/2, p38, and p65, and their respective phospho-proteins. HCAEC cells were treated with different concentrations of GPC for 20 min, and the lysate was employed to run SDS-PAGE followed by immunoblotting. Each well was loaded with 4 µg protein equivalent of cell lysate. (BD) The relative intensity of phospho-protein to its native protein, as quantified by ImageJ software. p values were calculated by one-way ANOVA followed by Student’s t test, and only p values less than 0.10 are provided.
Figure 12
Figure 12
GPC supplementation alters the plasma concentration of gut microbial metabolites implicated in the TMAO pathway. (A) Targeted metabolomic profile in plasma in female C57BL/6J Apoe−/− mice fed a GPC supplemented chow diet for 16 weeks versus control chow diet. The concentration for each metabolite was normalized to the average concentration in the combined chow and GPC groups. (B) Heat map showing Spearman correlation coefficients for the targeted metabolites and the bacterial taxa showing discrimination between the two diet arms as shown in Figure 8D and aortic lesion area and plasma TMAO level. * p < 0.05; ** p < 0.01; *** p < 0.001.
Figure 13
Figure 13
Untargeted metabolomic analysis of plasma metabolites in GPC supplemented chow diet-fed mice versus control chow diet-fed mice. (A) PLS-DA of the untargeted metabolomic data in plasma resulted in a clear separation of the metabolic features between female C57BL/6J Apoe−/− mice fed GPC supplemented or control chow diets. (B) Pearson correlations (r) among the untargeted metabolomic features with fold change larger and FDR smaller than TMAO by comparison of the two groups and plasma TMAO concentration, aortic lesion area. Untargeted metabolomic features in the plasma of female C57BL/6J Apoe−/− mice fed GPC supplemented or control chow diet for 16 weeks were acquired by LC-Triple TOF 5600 mass spectrometer using positive IDA mode. The acquired data were analyzed by XCMS to extract ion specific feature labeled with m/z and retention time (rt). Plasma TMAO concentration was determined by stable isotope dilution LC-MS. * p < 0.05; ** p < 0.01; *** p < 0.001.
Figure 14
Figure 14
Schematic Figure showing GPC promoting atherosclerosis through multiple mechanisms. PLD, phospholipase D; FMOs, Flavin monooxygenases; SCFAs, short chain fatty acids.

References

    1. Amenta F., Tayebati S.K., Vitali D., Di Tullio M.A. Association with the cholinergic precursor choline alphoscerate and the cholinesterase inhibitor rivastigmine: An approach for enhancing cholinergic neurotransmission. Mech. Ageing Dev. 2006;127:173–179. doi: 10.1016/j.mad.2005.09.017. - DOI - PubMed
    1. Gatti G., Barzaghi N., Acuto G., Abbiati G., Fossati T., Perucca E. A comparative study of free plasma choline levels following intramuscular administration of L-alpha-glycerylphosphorylcholine and citicoline in normal volunteers. Int. J. Clin. Pharmacol. Ther. Toxicol. 1992;30:331–335. - PubMed
    1. USDA Database for the Choline Content of Common Foods. [(accessed on 4 November 2021)];2008 Available online: https://www.ars.usda.gov/ARSUserFiles/80400525/Data/Choline/Choln02.pdf.
    1. Bang H.J., Kim I.H., Kim B.H. Phospholipase A1-catalyzed hydrolysis of soy phosphatidylcholine to prepare l-alpha-glycerylphosphorylcholine in organic-aqueous media. Food Chem. 2016;190:201–206. doi: 10.1016/j.foodchem.2015.05.093. - DOI - PubMed
    1. Song Y., Roh S., Hwang J., Chung M.Y., Kim I.H., Kim B.H. Immobilized Phospholipase A1-Catalyzed Preparation of l-alpha-Glycerylphosphorylcholine from Phosphatidylcholine. J. Agric. Food Chem. 2020;68:12375–12383. doi: 10.1021/acs.jafc.0c06381. - DOI - PubMed

MeSH terms