

Geographical Access to Child and Family Healthcare Services and Hospitals for Africa-Born Migrants and Refugees in NSW, Australia; A Spatial Study
- PMID: 34948813
- PMCID: PMC8701331
- DOI: 10.3390/ijerph182413205
Geographical Access to Child and Family Healthcare Services and Hospitals for Africa-Born Migrants and Refugees in NSW, Australia; A Spatial Study
Abstract
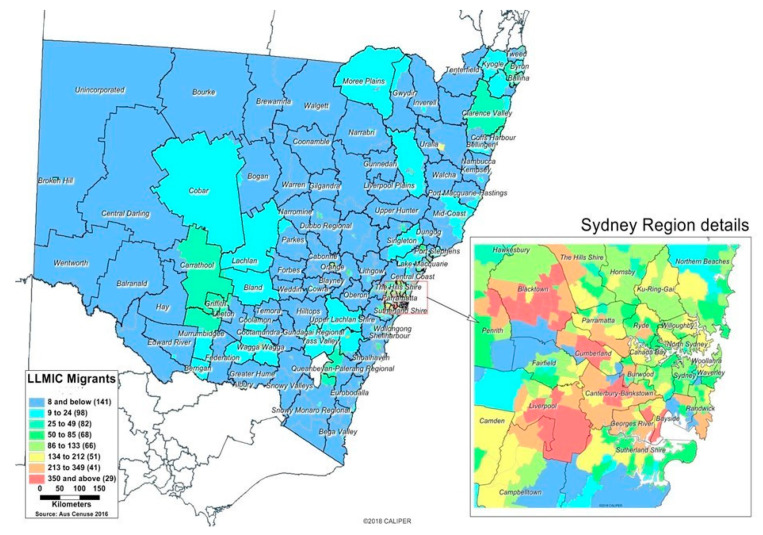
Background: African-born migrants and refugees arriving from fragile states and countries with political and economic challenges have unique health needs requiring tailored healthcare services and support. However, there is little investigation into the distribution of this population and their spatial access to healthcare in Australia. This paper reports on research that aimed to map the spatial distribution of Africa-born migrants from low and lower-middle-income countries (LLMICs) and refugees in New South Wales (NSW) and access to universal child and family health (CFH) services and hospitals. Methods: We analysed the Australian Bureau of Statistics 2016 Census data and Department of Social Services 2018 Settlement data. Using a Geographic Information System mapping software (Caliper Corporation. Newton, MA, USA), we applied data visualisation techniques to map the distribution of Africa-born migrants and refugees relative to CFH services and their travel distance to the nearest service. Results: Results indicate a spatial distribution of 51,709 migrants from LLMICs in Africa and 13,661 refugees from Africa live in NSW, with more than 70% of the total population residing in Sydney. The Africa-born migrant and refugee population in Sydney appear to be well served by CFH services and hospitals. However, there is a marked disparity between local government areas. For example, the local government areas of Blacktown and Canterbury-Bankstown, where the largest number of Africa-born migrants and refugees reside, have more uneven and widely dispersed services than those in Sydney's inner suburbs. Conclusion: The place of residence and travel distance to services may present barriers to access to essential CFH services and hospitals for Africa-born refugees and migrants. Future analysis into spatial-access disadvantages is needed to identify how access to health services can be improved for refugees and migrants.
Keywords: African; Australia; healthcare; migrants; refugees; spatial-access; vulnerable populations.
Conflict of interest statement
The authors have no conflict of interest to declare.
Figures


References
-
- ABS . Census of Population and Housing 2016. ABS; Canberra, ACT, Australia: 2017.
-
- ABS Population Projection. [(accessed on 31 March 2021)];2021 Available online: https://www.abs.gov.au/statistics/people/population.
-
- Refugee Council of Australia An analysis of UNHCR’s 2018 Global Refugee Statistics. How Generous is Australia’s Refugee Program Compared to Other Countries? 2019. [(accessed on 22 September 2019)]. Available online: https://reliefweb.int/report/australia/analysis-unhcr-s-2018-global-refu....
-
- SSI Refugee FAQs. What Is the Difference between A Refugee and A Migrant? [(accessed on 24 May 2021)]. Available online: https://www.ssi.org.au/faqs/refugee-faqs/148-what-is-the-difference-betw....
Publication types
MeSH terms
LinkOut - more resources
Full Text Sources
Miscellaneous
