Review
. 2022 Jan;43(1):2-10.
doi: 10.3174/ajnr.A7362. Epub 2021 Dec 23.

Spectrum of Neuroradiologic Findings Associated with Monogenic Interferonopathies

Affiliations
Review

Spectrum of Neuroradiologic Findings Associated with Monogenic Interferonopathies

P Benjamin et al. AJNR Am J Neuroradiol. 2022 Jan.

Abstract

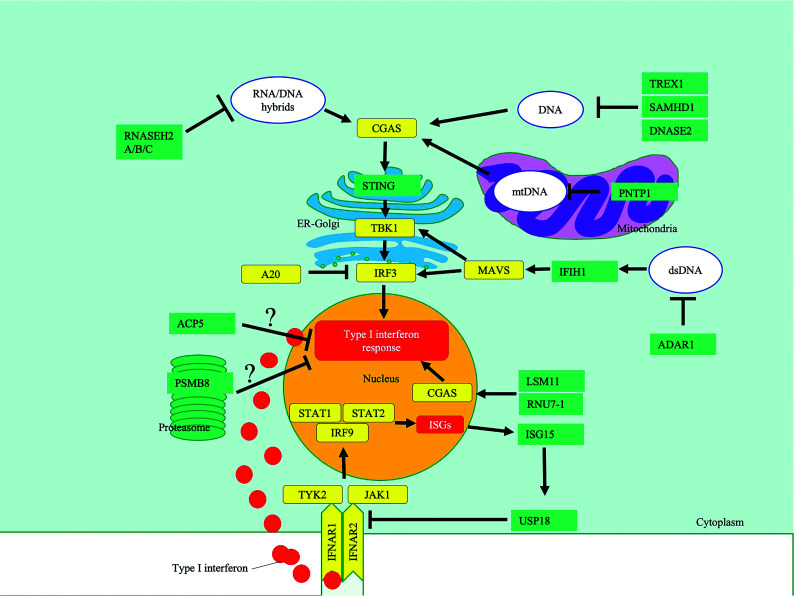
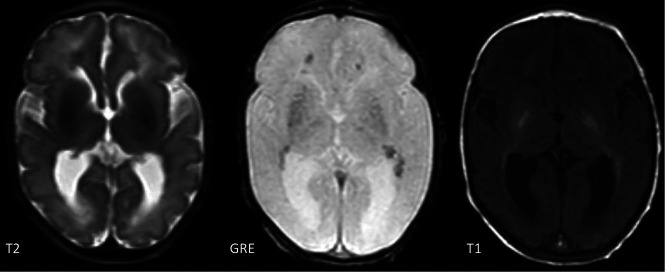
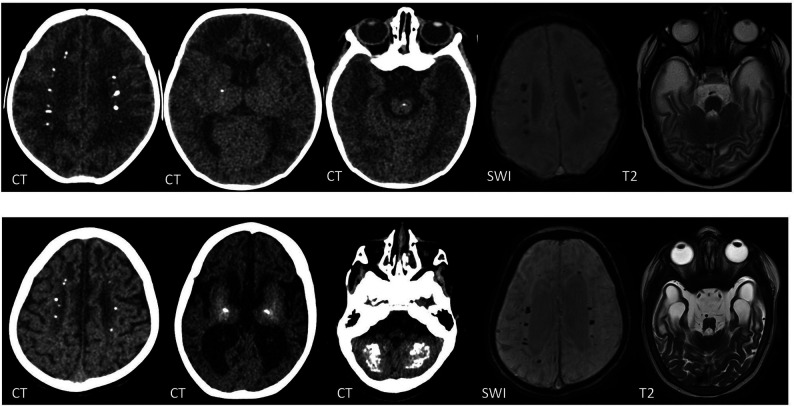
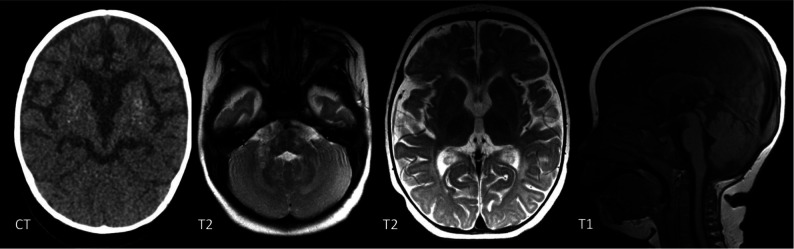
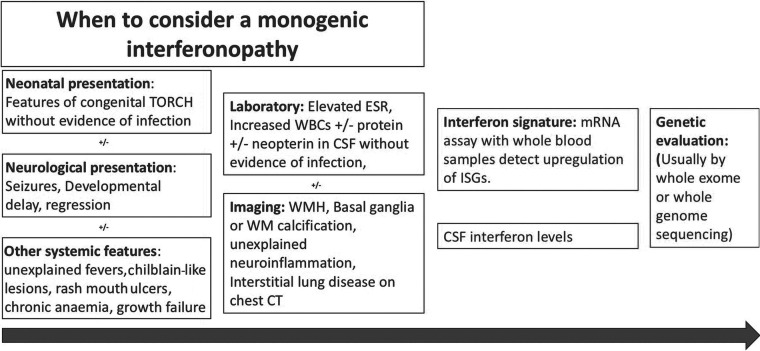
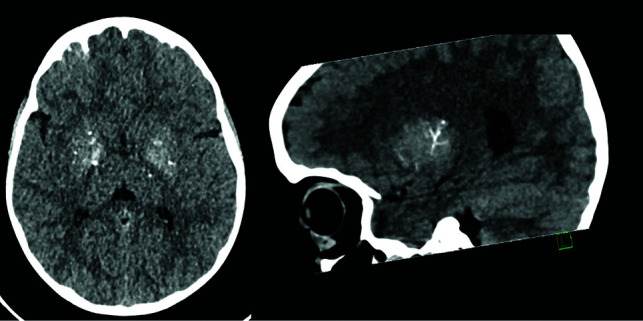
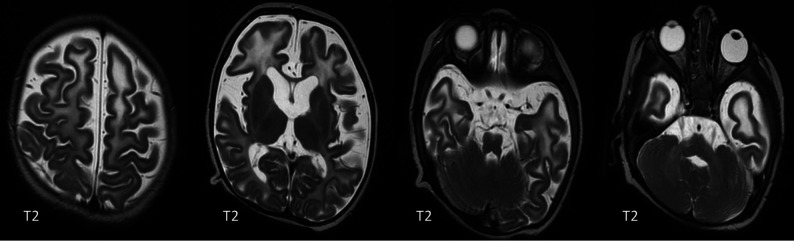
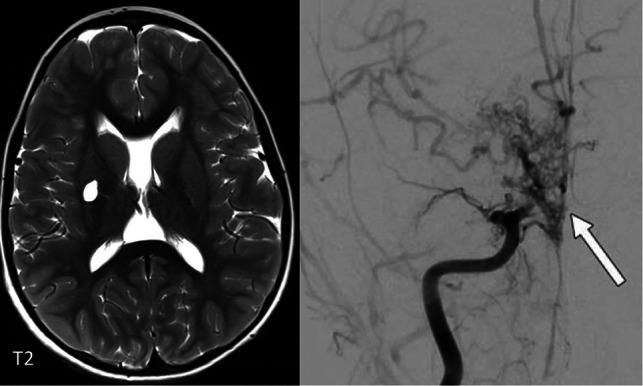
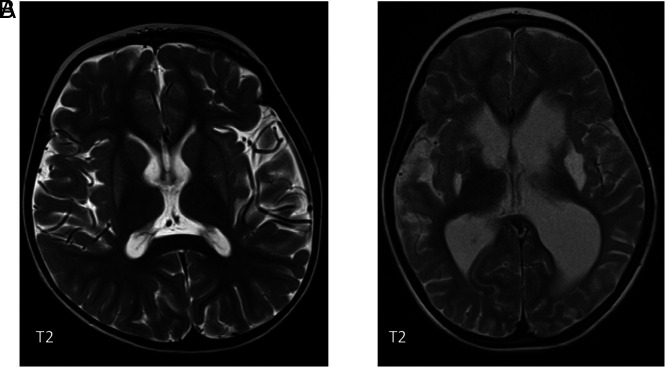
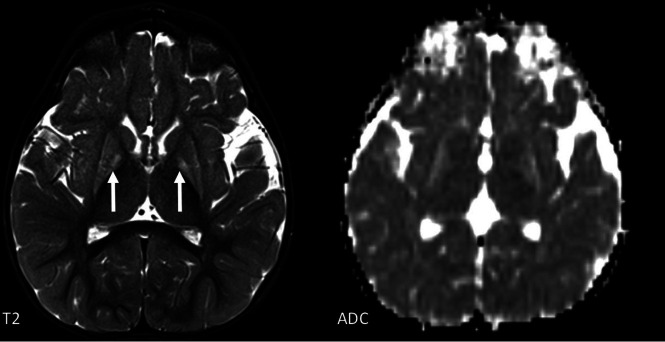
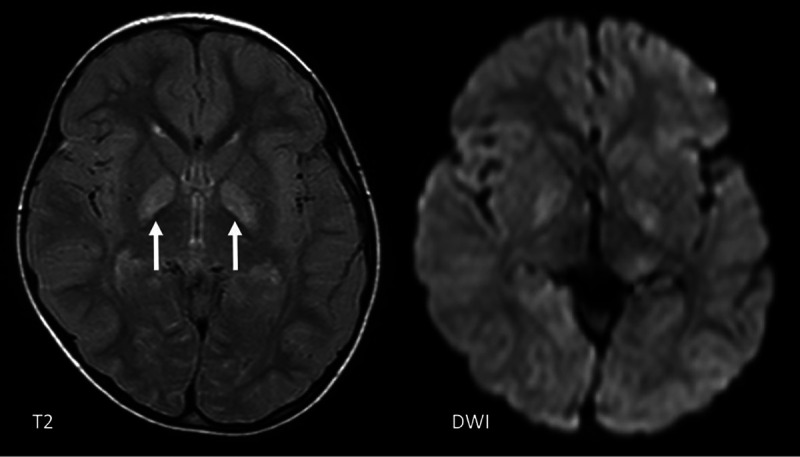
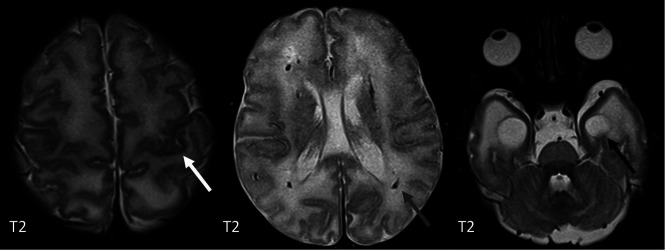
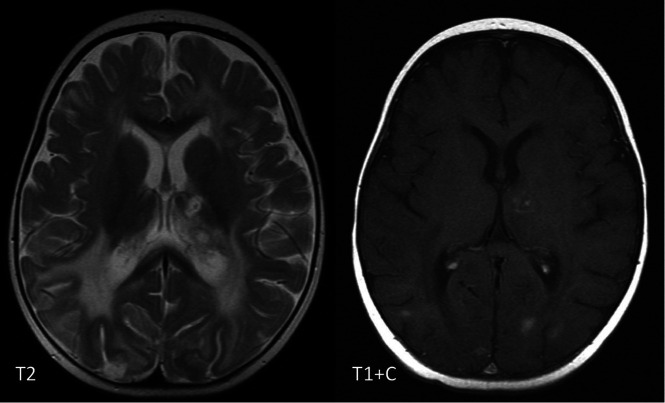
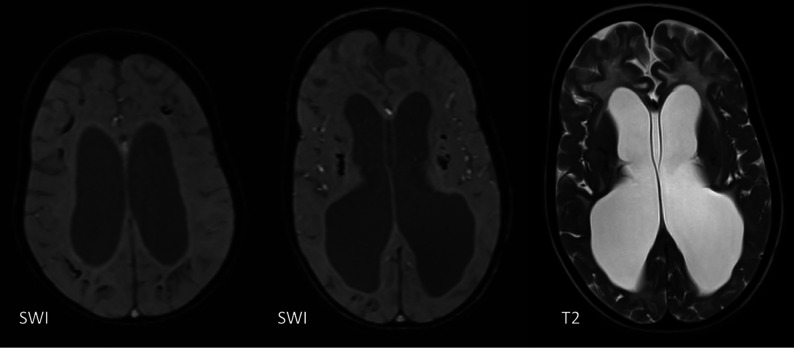
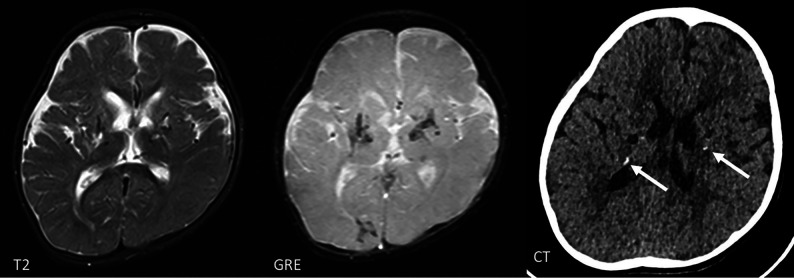
The genetic interferonopathies are a heterogeneous group of disorders thought to be caused by the dysregulated expression of interferons and are now commonly considered in the differential diagnosis of children presenting with recurrent or persistent inflammatory phenotypes. With emerging therapeutic options, recognition of these disorders is increasingly important, and neuroimaging plays a vital role. In this article, we discuss the wide spectrum of neuroradiologic features associated with monogenic interferonopathies by reviewing the literature and illustrate these with cases from our institutions. These cases include intracerebral calcifications, white matter T2 hyperintensities, deep WM cysts, cerebral atrophy, large cerebral artery disease, bilateral striatal necrosis, and masslike lesions. A better understanding of the breadth of the neuroimaging phenotypes in conjunction with clinical and laboratory findings will enable earlier diagnosis and direct therapeutic strategies.


Figures

FIG 1.
FIG 1.
A highly simplified diagram highlighting key pathways affected in type 1 interferonopathies, in which neuroimaging findings have been described. The black bars indicate inhibition, and the arrows, activation. ? indicates that the mechanism of IFN induction is unclear. CGAS indicates cyclic GMP-AMP synthase; TBK1, TANK-binding kinase 1; IRF3, IFN regulatory factor 3; MAVS, mitochondrial antiviral-signaling protein; IFNAR, IFN α/β receptor; JAK1, Janus kinase 1; TYK2, tyrosine kinase 2; PSMB8, proteasome subunit β type-8; TREX1, three prime repair exonuclease 1; RNASE H, ribonuclease H; SAMHD1, SAM And HD domain-containing deoxynucleoside triphosphate triphosphohydrolase 1; IFIH1, interferon induced with helicase C domain 1; PNPT1, polyribonucleotide nucleotidyltransferase 1; DNASE2, deoxyribonuclease 2; ACP5, acid phosphatase 5; ISG15, interferon-stimulated gene 15; RNU7-1, RNA, U7 small nuclear 1; USP18, ubiquitin-specific peptidase 18; STAT2, signal transducer and activator of transcription 2; ER, endoplasmic reticulum; mtDNA, mitochondrial DNA.
FIG 2.
FIG 2.
T2, gradient recalled-echo (GRE) and T1-weighted images of a 9-day-old boy with a TREX1 mutation demonstrating basal ganglia and periventricular calcifications.
FIG 3.
FIG 3.
CT, SWI, and T2-weighted images of a boy with a TREX1 mutation. The upper row shows imaging at 2 months of age, and the lower row, at 2 years of age. There are periventricular, basal ganglia, brainstem, and cerebellar WM calcifications, which progress with time. Note the interval volume loss with WM rarefaction, most marked in the anterior temporal lobes.
FIG 4.
FIG 4.
A 1-year-old girl with a RNASEH2B mutation. There are patchy WMH throughout the brain. Symmetric T2-signal abnormality is noted in the globus pallidus, thalamus, and dentate nucleus. There is global cerebral volume loss. CT confirms basal ganglia calcifications.
FIG 5.
FIG 5.
A potential route to the diagnosis of monogenic type 1 interferonopathies. The red boxes contain clinical, laboratory, and imaging findings that lead one to suspect an interferonopathy. The green boxes contain diagnostic tests performed when a monogenic type 1 interferonopathy is strongly suspected. ESR indicates erythrocyte sedimentation rate; WBC, white blood cells; ISG, interferon-stimulated genes; TORCH, (T)oxoplasmosis, (O)ther Agents, (R)ubella (also known as German Measles), (C)ytomegalovirus, and (H)erpes Simplex; mRNA, messenger RNA.
FIG 6.
FIG 6.
A CT study in axial and sagittal reconstructions shows punctate and linear branching calcifications along the deep perforators in a 7-year-old boy with a SAMHD1 mutation.
FIG 7.
FIG 7.
A 24-week-old boy with a RNASEH2C mutation with WM abnormalities in the frontal and temporal lobes and generalized volume loss.
FIG 8.
FIG 8.
Lacunar infarct in the right putamen in a 7-year-old boy with a SAMDH1 mutation. The angiogram on the right demonstrates a Moyamoya-type vasculopathy with occlusion of the right M1 and A1 (arrow).
FIG 9.
FIG 9.
A, Bilateral putaminal signal abnormality in a 4-year-old boy with a confirmed ADAR1 mutation. There was no diffusion restriction. B, A different patient also with an ADAR1 mutation showing cavitation in both putamina.
FIG 10.
FIG 10.
An 18-month-old girl with a PNTP1 mutation with signal abnormality and decreased volume of both the putamina and globi pallidi. Diffusion restriction is seen in the globi pallidi.
FIG 11.
FIG 11.
Atypical imaging features in a 4-year-old girl with an ADAR1 mutation showing a T2 signal abnormality and mild diffusion restriction in the globi pallidi bilaterally (arrows), but not in the putamina.
FIG 12.
FIG 12.
T2-weighted MR imaging of a 9-day-old girl with congenital cytomegalovirus infection showing polymicrogyria (white arrow), periventricular calcifications (gray arrow), and anterior temporal lobe cysts (black arrow).
FIG 13.
FIG 13.
A 6 month-old girl with perforin-deficient hemophagocytic lymphohistiocytosis. There is diffuse WM signal abnormality seen on the T2-weighted image and multiple enhancing pseudotumoural lesions seen on the T1 postcontrast image (T1 + C) in the left thalamus and posterior temporal and occipital lobes bilaterally.
FIG 14.
FIG 14.
A 6-year-old boy with Cockayne syndrome showing subcortical and basal ganglia calcifications on SWI and diffuse WM signal abnormality seen on the T2-weighted image. There is marked WM volume loss.
FIG 15.
FIG 15.
Hemosiderin-lined cavities in the basal ganglia and thalamus and subtle periventricular calcification on CT (white arrows) in a 3-year-old boy with a COL4A1 mutation.

References

    1. Crow YJ, Manel N. Aicardi–Goutières syndrome and the type I interferonopathies. Nat Rev Immunol 2015;15:429–40 10.1038/nri3850 - DOI - PubMed
    1. Lee-Kirsch MA. The type I interferonopathies. Annu Rev Med 2017;68:297–315 10.1146/annurev-med-050715-104506 - DOI - PubMed
    1. Eleftheriou D, Brogan PA. Genetic interferonopathies: an overview. Best Pract Res Clin Rheumatol 2017;31:441–59 10.1016/j.berh.2017.12.002 - DOI - PubMed
    1. Volpi S, Picco P, Caorsi R, et al. . Type I interferonopathies in pediatric rheumatology. Pediatr Rheumatol Online 2016;14:35 10.1186/s12969-016-0094-4 - DOI - PMC - PubMed
    1. McGlasson S, Jury A, Jackson A, et al. . Type I interferon dysregulation and neurological disease. Nat Rev Neurol 2015;11:515–23 10.1038/nrneurol.2015.143 - DOI - PubMed

Publication types

LinkOut - more resources